of Chemical
Engineering
ISSN 0104-6632 Printed in Brazil www.scielo.br/bjce
Vol. 35, No. 02, pp. 631 - 640, April - June, 2018 dx.doi.org/10.1590/0104-6632.20180352s20160453
EFFECT OF STIRRING SPEED ON CONVERSION
AND TIME TO PARTICLE STABILIZATION OF
POLY (VINYL CHLORIDE) PRODUCED BY
SUSPENSION POLYMERIZATION PROCESS AT
THE BEGINNING OF REACTION
Rita Marinho
1*, Lucas Horiuchi
1and
Carlos Augusto Pires
21 Braskem PVC, R. Hidrogênio 3342, Pólo Petroquímico de Camaçari (Braskem
PVC), 42810-280, Camaçari - BA, Brazil. E-mail: [email protected]; [email protected]
2 Departamento de Engenharia Química, UFBA Universidade Federal da Bahia,
Brasil. E-mail: [email protected] ão
(Submitted: July 26, 2016; Revised: January 6, 2017; Accepted: January 20, 2017)
Abstract - The effect of changes in the stirring speed during suspension polymerization of vinyl chloride
monomer (VCM) was investigated near the particle stabilization. Preliminary tests were conducted to check the highest conversion and information regarding the porosity and particle stabilization of two formulations, which are based on different concentrations of initiators and dispersing agents. The influence of stirring speed during the first 2 h of reaction was investigated for the best formulation, indicating that there was a proportional relationship between the increase in speed and the increase in conversion. The results presented suggest that the highest stirring speeds (900 and 1000 rpm) tended to achieve the same conversion with increasing reaction time. This was also observed with the lower stirring speeds (600 and 700 rpm); however, the conversions obtained were lower than those found with higher stirring speeds. The conversions achieved in 20 to 30 min of reaction were similar for all stirring speeds studied (20 min: 4.8% ± 1.3%; 30 min: 7.5% ±1.4%). However, there was greater variation in conversion for longer reaction times (60 min: 15.9 ± 2.8%; 120 min 36.5 ± 2.4%). Stability of the particles was achieved for 6-8% conversion for all stirring speeds used when breakage and coalescence processes stop. The conversion interval obtained in this work was smaller than the values found in the literature (between 15 and 20%). The effect of stirred conditions on particle size distribution showed that better stability of the particle size occurred at 900 rpm for the system studied. In this case, variations in the particle size decreased when the conversion increased.
Keywords:Vinyl chloride monomer, stirring speed, conversion, particle size, suspension polymerization.
INTRODUCTION
The PVC suspension polymerization process (PVC-S) is one of the most widely used processes in the world, and its first plants began operation in the 1940s. The PVC reaction occurs in batch type
reactors, with volumes that can reach 200 m3 (Junior
and Ormanji, 2006).
PVC particle formation is complex, and the
morphological distribution of grain size and porosity
depend on a number of conditions, including stirring rate, temperature, suspending agents, volume ratio of monomer to demineralized water (VCM / DW) and conversion (Junior and Ormanji, 2006).
In this process, vinyl chloride monomer (VCM),
initiators, dispersing agents and stabilizers are agitated.
Droplets of liquid VCM are bounded by a pericellular
membrane, dispersed in a continuous aqueous phase. The pericellular membrane forms during the
initial stages of polymerization at approximately 2% conversion. PVC primary particles begin to precipitate within the VCM monomer droplet, thereby forming
a solid phase inside the liquid phase, which contains the monomer. Precipitated species grow and form small particles, which aggregate into even larger particles. Several authors (Allsopp, 1982; Clark, 1982; Stephenson and Smallwood, 1989; Mariasi, 1986) have suggested the mechanism of grain formation.
According to Darvishi et al. (2015), the
morphological effects are usually the result of the dynamic equilibrium between the coalescence and drop-breaking processes. Droplet stability must
be evaluated to enable changes in the operating variables of the PVC grain formation process so that
the quality of the resin can be improved. Junior and Ormanji (2006) reported that the drop stability can be changed according to the speed of agitation. Very low speeds are insufficient to maintain stability because the excessively large droplets can undergo complete
separation from the aqueous phase owing to the
density difference.
The effect of the agitation rate on the average grain size was studied by Barclay (1976), Hofmann
and Kunmert (1976), and Lewis and Johnson (1981). The authors concluded that the particle size tends to decrease with increasing speed until a minimum value and then increases in size. Johnson (1980) studied
the effect of changing the agitator speed on particle
formation relating to the Weber number. The Weber number is proportional to the agitator rotational
velocity squared. At very low values of Weber number, the particle size is very large. Then, as the
Weber number is increased, the particle size decreases, reaches a minimum value, and then begins to increase again. As the Weber number increases, the individual monomer droplets becomes smaller. This increases the interfacial area. At some point, the colloid is spread out over the interfacial area to such a degree that
the effectiveness begins to diminish. Agglomeration
of the individual particles occurs, and the combined agglomerate begins to grow in size. According to de Faria Jr (2008), many correlations were carried out between the properties of the polymerization and the average
particle size diameter (D50). In his opinion, the best
one is that presented by Lee (1999), which incorporates both the characteristics of the physical system (specific
power of the stirrer and power consumption per unit
volume) and the physical properties of the suspending
agents.
Zerfa and Brooks (1996, 1997) and Bao and
Brooks (2002) studied the influence of the operating conditions on the polymerization and concluded that
the reduction in stirring rate causes changes in the distribution of grain size, exchanging a monomodal distribution for a multimodal one.
The effect of agitation speed on particle porosity has also been studied by several researchers (Ozkaya,
1993; Lewis and Johnson, 1981; Lee, 1999; Smallwood, 1986), who found that, if the particles grow packaged
in the absence of shear stress, low porosity will result. However, in the presence of shear forces, the primary
particles form a network that will produce particles
with high porosity.
In addition to the stirring speed, the conversion can
influence the evolution of the particle morphology.
Smallwood (1986) and Bao and Brooks (2003) studied
the development of porosity, specific surface area and pore diameter at different stages of conversion of the VCM suspension polymerization. According to the authors, the stability of the particles is established at approximately 20% conversion; however, the
distribution of particle size is established between 20 and 35%.
The vast majority of articles published on VCM suspension polymerization have focused on the influence of some variables on the particle formation
and distribution of particle size and the determination of the time of particle stabilization. However, no work
was found involving the influence of stirring speed of
the reaction mixture on the VCM conversion in the
early stages of polymerization.
In this work, a number of VCM suspension
the early stages. The average diameter of particles at
each stirring speed and distribution of particle size were results that contributed to the understanding of the problem and served as the basis for determining the most appropriate level of agitation for the
polymerization that was studied.
EXPERIMENTAL PROCEDURES
Materials
Braskem supplied the VCM, initiators and dispersing agents used in the experimental tests. The
initiators used were tert-butyl perpivalete (INI-1), bis-2-ethylhexyl peroxydicarbonate (INI-2) and alpha-cumyl peroxyneodecanoate (INI-3). The dispersing agents used are denoted DISP 1, 2 and 3 (hydrolyzed poly (vinyl acetate)) and their characteristics are
shown in Table 1.
Polymerization
Polymerization occurred in a 2.0 L batch stainless
steel reactor (Buchi AG, Switzerland) with heating
and cooling performed by circulating water through
the reactor jacket and temperature control. The reactor was loaded with demineralized water (DW), initiators and suspension agents. After the reactor was closed, vacuum was used to reduce the concentration of
oxygen. The VCM was charged in the reactor, and
the mixture was stirred at 200 rpm for 10 min at room temperature. The same amount of time to achieve
adequate pre-mixing was also used by other authors
like Zerfa and Brooks (1995). After that, the agitator
speed was set to specific values, and the reactor was
heated to the reaction temperature and remained constant until the end of the reaction. At the end of the reaction, the reactor was cooled to room temperature to stop the reaction. The unreacted monomer was
recovered, and the reaction product was filtered, dried
for 2.0 h in an oven at 80 ºC and weighed to determine the conversion. The stirrer used possessed three curved blades (diameter 60mm) similar to a Pfaudler agitator.
Tests
Table 2 presents a summary of the formulations
used throughout this work. Each stage represents a series of batches in which each reaction stopped at a given reaction time.
The formulations presented in Table 2 show that three initiators and three dispersing agents were used
in each reaction. Initiators influence the distribution of reaction heat, and their amount will depend on the type of reactor used. For the test system, three initiators
were used to facilitate heat distribution throughout the
reaction. They have different half-life times, working mainly at the beginning, middle and end of the polymerization. The use of the three initiators aimed to obtain more constant polymerization rates, consistent with the heat removal capacity of the reactor (Pinto
and Giudici, 2001).
The required characteristics of the polymer were
obtained with the use of the dispersing agent. The
primary dispersing agent (GH> 55) operates mainly
according to Particle Size Distribution (PSD) and Bulk
Density (BD). The secondary dispersing agent mainly affects the porosity and affects the BD. However, BD
is a function of the roundness of the grain, which will
Table 1. Properties of the dispersing agents used.
Dispersing Agents Hydrolysis Degree (mol%) Viscosity (cPs)*
1-Primary dispersing agent 1 (DISP 1) 71.0 5.0 a 5.8
2- Primary dispersing agent 2 (DISP 2) 79.5 45 a 51
3- Secondary dispersing agent (DISP 3) 40.0 4.5 a 5.7
*Aqueous solution 4% at 20ºC.
Table 2. Summary of formulations used in the tests.
Parameter Water VCM Initiators (phm) Dispersing agents (phm) Temp. Vacuum Agitator Speed
Unity (g) (g) INI-1 INI-2 INI-3 DISP1 DISP2 DISP3 ºC mmHg RPM
Phase I 800 400 0.0175 0.0350 0.0125 0.1700 0.0300 0.0300 60 -660 900
Phase II 800 400 0.0125 0.0275 0.0200 0.01400 0.0300 0.0300 60 -660 900
Phase III 800 400 0.0125 0.0275 0.0200 0.01400 0.0300 0.0300 60 -660 600
Phase III 800 400 0.0125 0.0275 0.0200 0.01400 0.0300 0.0300 60 -660 700
depend on the pericellular film, which is formed by the primary dispersing agent.
Phase I was considered as a reference test, using standard operating conditions of a particular resin and dispersing agents and initiators in the usual concentrations, which will give known characteristics to the particle. Phase I was conducted to obtain the variation of the reaction conversion with time while
identifying the changes in the developing particle from the porosity and bulk density.
Phase II is another set of reference tests, which
aimed to show the influence of the variation of the
initiators and dispersing agents on the conversion,
porosity and density of the resin. The adjustments were made in these variables to analyze the conversion at
the time of particle formation and compare the results with those obtained in Phase I.
Phase III is a set of tests aimed to evaluate the action
of the agitator speed at the start of polymerization on
the particle formation and conversion of the reaction. Characterization of samples
The average size and distribution of particle size
(PSD) have an effect on other resin properties such as the bulk density, powder flow characteristics and
general properties of the mixture and processing (Junior et al., 2006). A laser instrument (Mastersizer 2000, Malvern
Instruments Ltd.) was used to measure the average particle size (D50) of the PVC resin. The brand used
was a Scirocco unit that performs analysis of the
powder. The parameters used in the equipment are given in Table 3.
The structure of PVC particles was studied by scanning electron microscopy (SEM) using a HITACHI TM-1000. This technique showed the morphology of
PVC.
The porosity of the resin is a direct function of the polymerization conditions, among which the amount of primary and secondary dispersing agents stands out,
along with the agitation of the reaction mixture (Junior
et al., 2006). The porosity was measured by analyzing
Cold Plasticizer Absorption (CPA), according to the
ISO-4608 standard. In this analysis, 2.000 ± 0.001 g
of PVC resin was placed in a glass tube of 14 mm in diameter containing 0.100 ± 0.002 g of cotton wool at
the bottom, blocking a 0.8-mm orifice. The orifice in
the bottom of the glass tube absorbs 4 ml of plasticizer
dioctyl phthalate (DOP) at room temperature (not to
exceed 30 ºC) for 10 min. The unabsorbed DOP is
removed by centrifugation at 3000 rpm for 60 min.
Standard error was ±0.27pcr.
The bulk density (BD) of the PVC powder is
a measure of mass per volume of a sample in an
uncompressed state. The apparent density is important in the resin quality specification, and it has a direct relationship with productivity in the processing equipment. It is influenced by morphological
characteristics, including the size, distribution,
porosity, shape and surface roughness of the particles
(Junior et al., 2006). The analysis method used ASTM D1895A
as a reference, which considers loads of 110-120 ml of
PVC in a standard funnel and free flow of the resin into a 100-ml flask. The excess resin is removed from
the container surface with a metal rod to be weighed. Standard error was ± 0.005g/cm3.
RESULTS AND DISCUSSION
Tests conducted in Phases I and II were intended to
show the influence of the variation of the initiators and dispersing agents on the conversion reaction, porosity and density.
Variations of the conversions with the
polymerization reaction time, involving two different formulations that differed in dispersing agents and
initiator concentrations, are shown in Figure 1. The variations imposed on the Phase II trials made the
reactions faster and more efficient, reaching a final conversion approximately 10% higher than that in
Phase I. It can also be observed that, at the beginning
of the reaction, the conversions are very similar, so
variations in initiator concentrations and dispersing
agents were not as conclusive as the stability of the
particle. Tests were performed in duplicate and the experimental error was ±1.1 %.
Table 3. Parameters for Malvern analysis.
Parameters
Material PVC Sweep 5000
Refraction 1,55 Obscurant (min) 2
Absorption 0,01 Obscurant (max) 15
Repetitions 1 Auto start 1
Number of Lectures 3 F eed slot opening (mm) 7
Delay 0 vibration% 55
Reading time (s) 5 Pressure (bar) 2
The results presented above indicated the need to
expand the investigation through new tests to find the
time at which the particles were stable. The new tests were conducted in Phase II, seeking to achieve an interval time of less than 1 h.
The stabilization of the PVC particles was evaluated from the distribution of particle size for a maximum time of 45 min of reaction. Figure 4 shows that the distributions are more similar after 30 min. This
suggests that the stability of the particles was set at low conversions, as cited by Smallwood (1986), Bao and Brooks (2003). According to them, the stability of the particles is established at approximately 20%
conversion; however, the distribution of particle size is established between 20 and 35%.
Figure 1. Conversion comparison between Phases I and II.
The porosity behavior throughout the polymerization
for Phases I and II is shown in Figure 2. At earlier times,
there is relatively high porosity of approximately 95 phr
(parts per hundred resin or DOP grams / 100 grams
PVC). There was a significant reduction in the porosity
of the resins produced in Phases I and II during the
reaction, reaching the lowest value of approximately 25 phr, whereas the porosity is usually less than 30 phr for
commercial resins (Tester, 1982).
Figure 2. Porosity variation with the reaction time.
The behavior of the apparent density during the polymerization for Phases I and II is shown in Figure 3. The apparent density of the resin increased significantly, reaching the maximum value of approximately 0.35 g/cm³ at 210 min for Phase I and
240 min for Phase II.
The behavior of porosity and density for Phases I
and II is due to changes that occurred within the particle
as the polymerization progressed. The VCM, in the
liquid phase, will be converted into PVC particles, in
the solid phase, producing variations in porosity and density. This process is continuous and is stabilized
near the end of the reaction, where conversions of
Phases I and II achieved 60% and 75%, respectively.
Figure 3. Bulk density variation with the reaction time.
Figure 4. Distribution of particle size during the reaction.
According to Mariasi (1986) in the early stage of polymerization, there is formation of a pericellular
skin that protected the particle. The agglomerated
primary particles are maintained inside the pericellular skin. At this point it will be useful to clarify the
nomenclature used in this article. Droplets are VCM
droplets, cells are VCM droplets stabilized by the
the polymerization process. Grain was used in situations where the polymerization occurred until its final stage without interruptions. With approximately
2% conversion, the process of disintegration and coalescence of the dispersed VCM droplets is replaced
by a cell aggregation and disaggregation process
owing to the development of the pericellular skin on the particle surface. Reactions occur on the surfaces
of the aggregated cells and gradually the dynamic
equilibrium is shifted towards the aggregational
direction. At some conversion, the dynamic character of the disperse system gradually ceases, and a static
condition takes place. For Mariasi (1986), it occurs at 15% conversion. In our work, it occurs before.
Figure 4 shows the presence of a higher content of
fine and coarse particles up to about 30 minutes. There
was a large amount of particles retained at 20µm and at 250µm. The percentage retained at 250µm is believed to be a result of the agglomeration of the smaller particles. This process of breaking and coalescence appears to be stabilizing after about 30 minutes.
By increasing the conversion, the porosity tended to decrease and the bulk density tended to increase, as observed in Figures 2 and 3, respectively.
The formation of PVC particles can be seen in Figure 5, in which it is possible to observe the
formation of the pericellular skin from the early stages
to a complete interaction with the PVC particles. At
10 min, the film that covered the drop was visible. As
the reaction time increased the pericellular skin was incorporated into the solid material.
Tests conducted in Phase III aimed to evaluate the
effect of stirrer speed on the conversion and determine
the minimum stabilization time of the particles in the
early stages of polymerization.
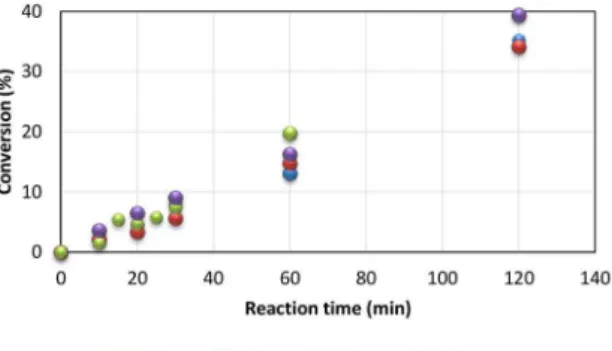
The influence of the agitator speed on the conversion of the polymer for reaction times ranging up to 120
min is shown in Figure 6.
not cause significant variations in the conversion of the species. Ozkaya et al. (1992) observed that, for VCM polymerization, it is necessary to define a minimum impeller speed, which will permit finishing all stages of polymerization successfully. They reported that, during pressure drop, VCM in the gas phase diffuses into the PVC particles being polymerized in suspension and, consequently, causes the pressure decrease. If the agitation speed is not sufficient, a layer of agglomerated
PVC is formed at the top of the reactor and a pressure drop is not observed.
Junior et al. (2006) reported that the agitation is
responsible for the stability of the suspension formed
and the control of the particle size of the obtained resin. Therefore, we measured the average particle diameter
(D50) to identify the stabilization time of the particles, and the results are shown in Figure 7. In this study,
D50 stabilized at 45 min with conversions below 15%, similar to the result of phase II.
Figure 6. Effect of the agitation on conversion in the initial stages of
polymerization
The results presented at the end of the first 2 h
of reaction indicated that there was a proportional relationship between the agitator speed and the conversion; when one is increased, the other increases. An example can be seen at 30 min of reaction: the conversion increased in this order of rotation: 700, 900, 600 and 1000 rpm; however, at 60 min of reaction, the conversion increased in this sequence: 600, 700, 1000 and 900 rpm. The results indicate that higher speeds (900 rpm to 1000) tended to the same conversion with increasing reaction time. This also occurred at lower speeds (600 and 700 rpm) and achieved lower conversions than the tests with higher speeds.
Figure 6 shows very similar conversions between
20 and 30 min of reaction for all studied speeds (20 min: 4.8% ± 1.3%; 30 min: 7.5% ± 1.4%). At higher instances, there was a change in behavior in which greater variations in conversion can be noted (60 min: 15.9 ± 2.8%; 120 min 36.5 ± 2.4%). At the end, the
agitator speed levels started to affect the conversion,
with higher values for 900 rpm and 1000 rpm. This
behavior can be explained by Pauwels’ (2004)
observations that the degree of agitation causes interference on the heat transfer process in the reaction medium and on the mass transfer process of VCM for PVC particles, causing variation in the reaction rate.
As the polymerization proceeds, the reaction medium becomes increasingly viscous, hindering the diffusion of VCM. In the initial stages of the polymerization,
there is little resistance to the transport of the monomer, so the variation in agitation of the reaction mixture did
Figure 7. Mean diameter variation of PVC particles during polymerization
at different agitation speeds
Figure 7 shows that, with 10 min of reaction, the average particle diameter increased with increasing
speed from 600 to 900 rpm. This probably occurred because, by increasing the agitation rate, the droplets suffer coalescence, increasing the droplet diameter.
However, the test with an agitator speed of 1000 rpm with 10 min of reaction had the lowest grain diameter,
probably because the shear stresses imposed by the system did not permit the formation of large droplets.
After 30 min of reaction, the particle diameters converged to stable particle diameters, with average sizes below 200 µm. According to Mariasi (1986), the tendency is that higher speeds will produce smaller
particles with lower average diameters at the end of the reaction.
A similar result is shown in Figure 4 by treating
the distribution of particle size throughout the reaction
established at approximately 30 min for all the speeds.
Some authors have reported a conversion in which
there is stability of the particles, such as Bao and Brooks (2002) and Mariasi (1986). They reported wide ranges (less than 20% and less than 15%, respectively). This study
found a narrower range; the value was between 6 and 8%. This means that the operating conditions for this
system can be modified at lower reaction times than the literature suggests, without impairing the quality of the final product.
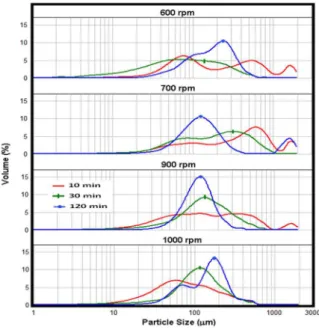
The particle size distribution, as a function of stirrer speed and reaction time, is shown in Figure 8.
Figure 8. Particle Size Distribution of tests measured by laser granulometry.
The particle size uniformity follows a trend with
increasing reaction time, regardless of the chosen agitator speed. At the beginning of the reaction, there are broader curves, indicating mixtures of particles
of different sizes. However, the distributions become
narrower at high reaction times, converging to less dispersed particle size distributions.
The influence of agitator speed on the distribution
of particle size shows that, at 600 and 1000 rpm, the formation of bimodal distributions occurs, even at 120 min, which did not occur at 700 and 900 rpm. Zefra and Brooks (1995) also noted this fact. This suggests that there is an optimal agitator speed for each
polymerization system (reactor stirrer and dispersing agent system). In this work, the agitator speed that generated greater particle stability was 900 rpm, and the particle size range decreased as the polymerization
proceeded.
CONCLUSION
PVC resins were prepared with different conversions
and agitator speed values. This work showed that a
change in the stirrer speed had no significant influence on the conversion in the early stages of polymerization, but may have an effect in the final stages. At different
stirrer speeds, the size of the particles in the formation was variable, but converged to a certain average
particle size from 6 to 8% conversion. The analysis
of the particle size distribution suggests that there is
a specific stirrer speed that is most appropriate for the system studied; in this study, it was 900 rpm, resulting
in a uniform distribution of particle size.
ACKNOWLEDGMENTS
The authors wish to thank Braskem for assisting
with tests in the Pilot Plant and analyses in the Control Quality Lab and Technology and Innovation Center
Lab.
SYMBOLS
BD - Bulk Density;
D50 - average particle size (µm); DISP - dispersing agent;
DOP - dioctyl phthalate plasticizer;
DW - demineralized water;
HD - Hydrolysis degree (mol%);
INI - initiators;
PSD - Particle Size Distribution;
PVC - poly (vinyl chloride);
PVC-S - suspension polymerization process of
PVC;
SEM - scanning electron microscopy; VCM - vinyl chloride monomer.
REFERENCES
Allsopp, M. W. In Manufacture and Processing of PVC: Burgess, R. H., Ed.; Applied Science Publisher Ltd.: London, (1982).
Bao Y; Brooks, B.W. Influences of some polymerization
conditions on particle properties of suspension
poly (vinyl choride) resin, J. Appl. Polym. Sci.,
85(7),1544-1552 (2002).
Bao Y; Brooks, B.W. Particle features of poly (vinyl chloride) resins prepared by a new heterogeneous polymerization process. J. Appl.Polym. Sci, 90(4)
Barclay, L. M. Formation and structure of PVC
particles, Macromolecular Materials and Engineering, 52(1) 1-20 (1976).
Clark, M. In Particulate Nature of PVC; Butters, G., Eds.; Applied Science Publ.: London (1982).
Darvishi, R., Esfahany, M.N., Bagheri, R. S-PVC Grain Morphology: A Review. Ind. Eng. Chem.
Res, 54(44) 10953-10963 (2015).
de Faria Jr, J.M., Monitoramento de variáveis morfológicas do PVC In-situ e em tempo real com o uso de uma sonda NIR e proposição de uma estratégia de controle. Tese de Doutorado, Universidade Rio de Janeiro, COPPE (2008).
Hofmann, E.; Kunmert, I., Über den Einfluss der
Ruehrgeschwindigkeit auf den Kornbildungsprozess
bei der Suspension polymerisation des Vinylchlorids. Plaste u. Kautschuk, 23(8), 567-570,
1976.
Johnson,G.R., Effects of agitation during VCM suspension polymerization. Journal of Vinyl Techonology, 2(3) 138-140 (1980)
Junior, R. A; Nunes, L; Ormanji, W. Tecnologia do PVC. Pro Editores (2006)
Lee, D. H., Correlation on Mean Particle Diameter of
PVC Resin in VCM Suspension Polymerization. J.
Chem. Eng. Jpn., 32(1) 97-103 (1999).
Lewis, M. H.; Johnson, G. R. Agitation scale-up
effects during VCM suspension polymerization, Journal of Vinyl and Additive Technology, 3(2)
102-106 (1981).
Machado, F., Lima, E. L., Pinto, J. C., Uma revisão dos processos de polimerização em suspensão, Polímeros: Ciência e Tecnologia, Vol. 17, nº 2, p. 166-179 (2007).
Mariasi, B. On the particle formation mechanism
of poly (vinyl chloride) PVC powder produced by suspension polymerization-development of external morphology of particles, Journal of Vinyl Technology. 8(1) 20-26 (1986).
Ozkaya N., Erbay, E. Bilgic, T, Savasci, O.T., Agitation scale-up model for the suspension polymerization of vinyl chloride, Macromolecular Materials and
Engineering, 211(1) 35-51 (1993).
Pauwels, K.F.D. New Aspects of the suspension
polymerization of vinyl chloride in relation to the low thermal stability of poly(vinyl chloride) Ph.D.thesis. University of Groningen The
Netherlands. (September 2004).
Pinto, J. M; Giudici, R. Optimization of a cocktail of
initiators for suspension polymerization of vinyl
chloride in batch reactors, Chemical Engineering Science, 56(3) 1021-1028 (2001).
Smallwood, P. V. The formation of grains of suspension
poly(vinyl chloride), Polymer 27(10) 1609-1618
(1986).
Stephenson, R. C.; Smallwood, P. V. In Encyclopedia of Polymer Science and Engineering; Wiley: New
York, 2nd ed., vol. 17 (1989).
Tester, B. W. In Manufacture and Processing of PVC; Burgess, R. H., Ed.; Applied Science Publisher Ltd.: London, (1982).
Zerfa, M.; Brooks, B. W. Prediction of vinyl chloride
drop sizes in stabilized liquid-liquid agitated dispersion, Chem. Eng. Sci., 51(12) 3223-3233 (1996).
Zerfa, M.; Brooks, B. W. Influence of condenser operation in vinyl chloride suspension polymerization reactors: an experimental study.