Failure behavior monitoring and evaluation of steel–confined
reinforced concrete columns by acoustic emission under quasi-static
loading
Abstract
The mechanical behavior and failure evolution of steel-confined and uncon-fined reinforced concrete RC columns are investigated under quasi-static loading through acoustic emission AE signal. The excellent hysteresis re-sponse, lighter damage characteristics and delayed catastrophe of steel– confined RC columns are verified. Characteristic AE parameters were ob-tained during the test process, AE monitoring results indicated that the pro-gressive deformation of the test specimens occurred in three stages repre-senting different damage conditions. Extended AE features, including dam-age severity, modified cumulative signal strength ratio, sentry function, and b-value are calculated to evaluate the damage growth, failure mechanism, and estimate the critical points. The synthesis analysis of multi-indicators mutual verify, overcome the disadvantages of using single-indicator evalua-tion, and successfully be used to determine the complex damage properties, identify damage statuses, and provide critical warning information for steel–confined RC columns.
Keywords
steel–confined RC column, acoustic emission, parametric analysis, damage evaluation, failure mechanism
1 INTRODUCTION
Civil engineering structures are usually subjected to various damages due to natural disaster, material deteri-oration and flaws in design, etc, which affect structural safety, applicability, and durability. Steel tubes have been widely used to protect against shear failure and improve the ductility and loading capacity of concrete structures because of their high strength and favorable workability Wu et al., 2006 . Casing tubes function as formwork and protective jackets show extensive applications in civil engineering for anti-earthquake purpose Han et al., 2009 . Compared with traditional RC columns, the new column possesses a highly complex and sheltered failure mecha-nism by combining steel tubes, concrete, and steel rebar. The wide use of steel-confined RC columns in infrastruc-tures and safety-critical strucinfrastruc-tures emphasize the necessary of developing applicable techniques for continuous structural health monitoring SHM and damage evaluation.
In traditional structural health monitoring SHM , it is difficult to know the exact damage location if sensors are not placed in the particular location where damages appear, damages may occur without warning. The use of monitoring strain gauges and piezoelectric ceramics is usual for civil structures. However, these utilizations directly embedded in concrete cause some initial defects, and do not provide satisfactory results due to the relative dimen-sions of sensors to concrete aggregates, bonding quality, and pouring condition.
Fangzhu Dua,b
Dongsheng Lia,b*
Baohua Shanc,d
Yanlei Wanga,b
a School of Civil Engineering, Dalian University of
Technology, Dalian 116024, China. E-mail: [email protected],
[email protected], [email protected]
b State Key Laboratory of Coastal and Offshore
Engineering, Dalian University of Technology, Dalian 116024, China;
c Key Lab of Structures Dynamic Behavior and
Control Harbin Institute of Technology , Minis-try of Education, Harbin 150090, China. E-mail: [email protected]
d School of Civil Engineering, Harbin Institute of
Technology, Harbin 150090, China.
*Corresponding author
http://dx.doi.org/10.1590/1679-78255170
The acoustic emission AE technique has been extensively studied in nondestructive testing NDT and is currently applied in civil engineering for SHM and damage evaluation. In traditional SHM and NDT methods, the generally accepted approach involves the use of gauge metrologies, in which the main challenges is related to sen-sors that are only sensitive to a local area. The extensively studied vibration-based methods can provide overall damage information, but lack sensitivity to small damages Baghiee et al., 2009 . AE is sensitive to small damages, and it not only can monitor the damage state of the sensor site, but also can monitoring certain areas where excited stress wave are readily accessible, without having to affect the integrity of structures Philippidis and Assima-kopoulou, 2008 . Given its unique superiorities, the AE technique has been a reliable routine inspection approach for civil structures, especially massive concrete, bridge girder, and cable structures where access are difficult. The present work aim at apply the AE technology to detect the damage state of steel-confined RC columns and offer new method for long-term SHM project for composite structures.
To the author’s best knowledge, previous studies mostly focused on the mechanical behavior, loading capacity, constitutive model, and seismic behavior of composite structures. For example, Han et al. 2009 experimentally verified the loading capacity and mechanical behavior of steel-tube RC columns subjected to cyclic bending. Teng et al. 2015 proposed a 3D finite element model to analyze the constitutive relationship and constraint mechanism of FRP/steel–confined RC columns. The feasibility and accuracy of the numerical method were verified by experi-mental observations. Shan et al. 2007 investigated the damage responses of concrete and RC filled steel tubes under transient impact. Cai et al. 2016 conducted experimental investigation on the seismic performance of GFRP–wrapped thin-walled steel tube confined RC columns. However, the cracking of the interior concrete has not been reported due to the invisibility of cracks covered by steel tubes.
About SHM, Song et al. 2006 presented the concept of intelligent RC structures that has multiple functions, including self-rehabilitation, self-vibration damping, and self-monitoring, by using shape memory alloys SMAs and piezo-ceramics. Cheng et al. 2017 proposed a low-cost capacitive transducer CT , which has the potential to provide accurate fracture assessment and prediction for RC structures. Khan et al. 2015 presented the hybrid NDT approach based on non-contact infrared thermography IRT , acoustic emission AE , and ultrasonic UT techniques for effective damage assessment of partially grouted concrete masonry walls. However, only few studies focused on health monitoring and evaluating for composite structures. Yao et al. 2001 detected mechanical be-havior of traditional RC columns and glass fiber strengthened RC columns in combination with the AE technique. Jain 2017 also reported the structural damage evaluation of fiber reinforced and FRP strengthened concrete ele-ments using piezoelectric based smart aggregates. Li et al. 2015 compared the AE behavior of steel confined RC columns with that of FRP-confined concrete-filled tubular columns, indicating that multi-parameter analysis is nec-essary for damage detection and crack investigation. Up to date, no report has been provided for NDT and damage evaluation in steel-confined RC structures under seismic loading.
AE is a class of phenomena whereby transient wave resulting from the sudden release of stored energy during material degradation such as plastic deformation, crack expansion, and local corrosion Sengupta et al., 2015 . Con-cerning AE physics, when materials are loaded or stressed, stored strain energy was therefore released in the form of transient wave, which can be detected on the surface of material by suitable sensors and converted into electrical signals, called AE signal. AE signal contains useful information on the internal condition, critical failure, and damage pattern of different materials Sagar et al., 2015 . Given its high sensitivity and accuracy, a major issue in the use of AE technique is to discriminate characteristic AE features due to different damage mechanisms and corroborate the relationship between the AE response and damage condition.
AE features, such as signal strength, reflect the release rate of energy and are related to damage severity. Ziehl and Ridge 2006 revealed that the cumulative signal strength CSS ratio is an important indication of the damage condition and established the CSS maximum value of 40% as the acceptance criterion in their experimental analysis. Intensity analysis is a method originally developed as indicators of structural deterioration and integrity, by calcu-lating two indices, namely, historic index HI and severity Sr , from signal strength. El-Batanouny et al. 2014 and Di Benedetti and Nanni 2014 used AE intensity analysis for damage evaluation of RC structure through in situ or reduce-scaled test in the laboratory. Li et al. 2012 calculated the two indices to assess the damage levels of corroded and uncorroded polyvinyl alcohol PVA fiber concrete.
applied sentry function to investigate the fracture progression of CFRP-strengthened RC cantilever beam under cyclic loading.
B-value analysis has been used to determine the frequency–magnitude distribution of earthquakes. A close analogy was observed between the earthquake sequence within the Earth's crust and the transit AE wave in solids, thus, the method has also been extended to AE data processing Carpinteri et al., 2011 . Farhidzadeh et al. 2013 calculated the b-value to investigate the progression of cracks in reinforced concrete shear walls. Sagar 2016 conducted a b-value analysis to evaluate the fracture process in RC beams and found that the damage parameter
D increased sharply to a high value as the value decreases. Stavrakas et al. 2016 introduced the improved b-value analysis for quantitative evaluation and pre-failure indicating of cement mortar Specimens
In this study, quasi-static loading tests were conducted on steel–confined and unconfined RC columns. Multi-parameter analysis of AE features was performed to achieve a reliable evaluation. Five analytical methods were applied to evaluate the structural integrity and analyze the damages mechanisms. The five methods are: 1 AE parametric analysis, which was used to examine the damage process; 2 modified CSS ratio, which provide critical warning information; 3 intensity analysis; 4 sentry function, which show energy conversion and dissipation, and 5 b-value analysis, which provide quantitative information on structural integrity and damage severity.
2 DATA PROCESSING METHODS
In traditional AE detection, characteristic AE features e.g., amplitude, energy, duration, rise time, counts and frequency are extracted to analyze the micro failure mechanisms of different materials. AE amplitude, duration, and counts depend on the magnitude of material degradation and contain information on the crack modes. The released energy embodies the growth of micro cracks, and the closure and friction of internal micro defects. AE energy evolution and dissipation in materials are important in damage assessment Meng et al., 2016 . In this study, the fundamental AE features are energy, amplitude, and signal strength. Datt et al. 2015 provided a thorough description of these AE features.
Damage severity Sr , shown in Equation 1 , weighs the average value for a certain number of hits generally 100 or 200 having the highest signal strength. A rapid increase in damage severity is typically associated with the occurrence of significant damages.
1
1 ( ) k Oi
i
Sr t S
k
1where Sr t is the severity at time t, SOi is the signal strength of the i-th hit, and k is an empirically derived constant
based on material type and varies with the number of hits.
CSS ratio evaluates the well-known Kaiser Effects Sagar et al., 2015 , and is positively related to the damage level. It is defined as the ratio of cumulative signal strength during reloading to that during the initial loading Equa-tion 2 Ziehl and Ridge, 2006 . However, the reloading stages are difficult to identify for the present loading scheme. Therefore, we proposed the modified CSS ratio Equation 3 to characterize the real-time stability of test columns.
CSS ratio CSS during reloading / CSS during initial loading 2
Modified CSS ratio CSS during unloading / CSS during loading 3
The sentry function based on the idea that during the loading process a material is able to store strain energy, and at the same time part of the stored energy is released due to the internal failures. The AE energy represents an important part of the released energy, and can be used to weight the energy storing capability. The proposed func-tion generally compare the natural logarithm of the ratio between the stored strain energy Es and the released
acoustic energy Ea , where x is the test driving variable usually displacement or strain , see in Equation 4
Sel-man et al., 2015 .
( ) ln ( ) / ( )
s af x
E x
E x
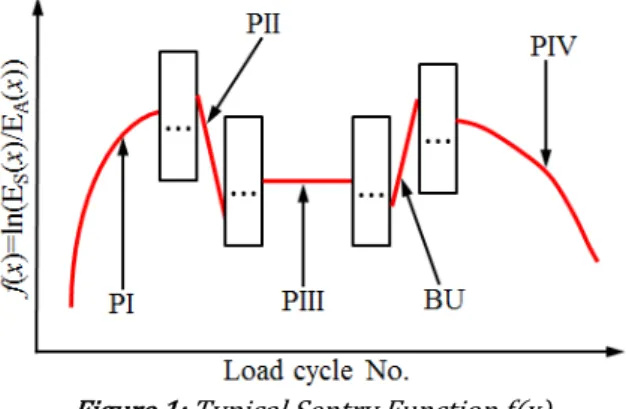
4corresponding to a progressive energy storing superimposed on an equal material damage progression. The de-creasing function PIV x indicates that the released energy tends to overcome the energy storing capability, this is a sign of major failure. And the button-up function, related to the instantaneous energy storing capability induced by strengthening events, such events can be caused by self-healing, fiber reinforcement, and hardening, and so on.
Figure 1: Typical Sentry Function f x .
The b-value used in seismology is determined based on the Gutenberg–Richter relationship, the Gutenberg– Richter equation for AE can be modified as follows Farhidzadeh et al., 2013 .:
10
log N a b - *(AdB/ 20) 5
where AdB represent the signal amplitude, N is the incremental frequency number of AE signals with amplitude
greater than AdB , a and b are empirical constant estimated through linear curve fitting, and b denotes the slope, is
called b-value.
Stiffness refers to the ability of a structure to resist deformations when stressed under external loading. Struc-tural stiffness degenerates due to concrete cracking and steel yielding; thus, stiffness is also a good indicator of the damage status. In this study, the equivalent stiffness of each deformation level is defined as the average ratio of positive and negative maximum load to the corresponding displacement.
3 DESCRIPTION OF THE EXPERIMENT 3.1 Specimen fabrication
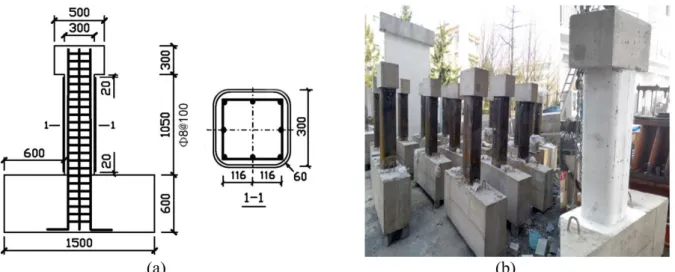
To provide convincing guidance for the practical application of AE-based damage monitoring and assessment, two set of large-scaled column–footing assemblages with cross section of 300 300 mm were fabricated. For each group, with three specimens, and one of the set were confined by steel tubes. Each tested specimen has a height of 1950 mm. The designed RC footing and rigid block are used for the convenient of anchoring and load application. Detailed construction information on the columns is shown in Figure 2, where the longitudinal and hoop reinforce-ment ratios are 1.71% and 0.68%, respectively. Four chamfers with a radius of 60 mm were created to facilitate steel retrofitting. The C40 commercial concrete was obtained from Dalian Longyi Building Materials Ltd. Detailed properties of the material are shown in Table 1. The design and manufacture of the specimens were based on the
Figure 2: Construction information of test specimens, a geometry detail dimension in mm , b sample diagram
Table 1: Detailed material properties
Material Yield Strength MPa Tensile Strength MPa Elastic Modulus GPa Thickness or Di-ameter mm tion %
Elonga-Steel tube 280 414 210 3 10.9
Rebar 420 590 205 16 17.5
Stirrup 400 525.4 206 8 18.3
Table 2: Detailed information on the test groups Test
Group Specimen Number TubeSteel Longitudinal Rebar Stirrups Concrete Axial Compression Ra-tio Shear Span Ratio
QSS0 3 – 6Φ16 Φ8@100 C40 0.3 4
QSS3 3 3 mm 6Φ16 Φ8@100 C40 0.3 4
3.2 Experimental facilities and loading scheme
Figure 3: Experiment facilities and data acquisition system
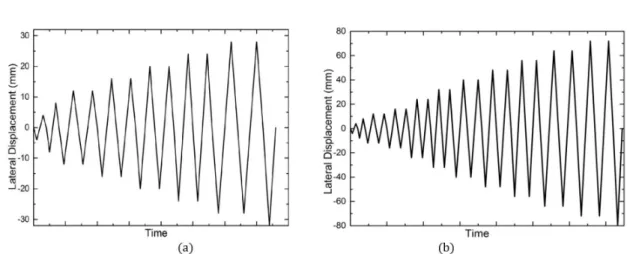
During the test, the bi-axial loading vertical and lateral was applied to the test specimens. The designed axial load amounted to 1013 kN calculated from Equation 6 was first applied, then the reciprocating lateral force symmetrically applied by displacement control, and maintained for unconfined and steel–confined RC columns, respectively, as shown in Figure 4. Single-cycle loading was conducted at 4 mm corresponding to the theoretical yielding displacement Dilger, 2011 and 8 mm. Then the loading step was set to be multiples of the yield displace-ment, and two cycles were conducted at each step. When the lateral loading decreased to about 60%–70% of the ultimate lateral loading, the test was terminated.
0 c
N
nf A
6Figure 4: Loading schemes, a unconfined RC columns QSS0 , b steel confined RC columns QSS3
3.3 AE system
Table 3: Salient DAQ features of the AE system Sensor
type frequency/kHz Peak response Threshold Sampling rate Sampling points PDT/μs HDT/μs HLT/μs
R-15a 150 45 dB 1 MSPS 1024 300 800 1000
4 BASIC RESULTS AND DISCUSSION 4.1 Hysteresis response
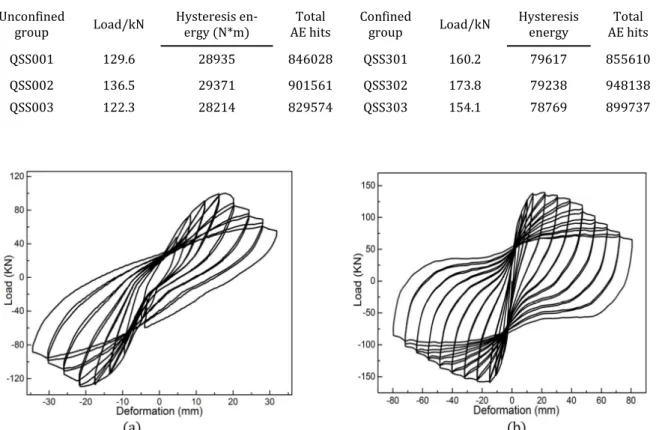
The hysteretic results and AE responses of all test specimens are recorded and shown in Table 4, given that no significant differences are observed among members of the same test group, we focus on the test results of speci-mens QSS001 and QSS301, which represent unconfined and confined RC columns, respectively. The hysteresis loops of the applied lateral load versus the corresponding free-end displacement are shown in Figure 5. Figure 6 provides a comparison of the stiffness degradation of specimens QSS001 and QSS301. The asymmetry of the load– displacement curve is attributed to the anisotropy of concrete and the slight movement of the steel reinforcement during the casting process. The damage patterns of test specimens are shown in Figures 7 and 8.
Table 4: Basic test results of each column–footing assemblage Unconfined
group Load/kN Hysteresis en-ergy N*m AE hits Total Confined group Load/kN Hysteresis energy AE hits Total
QSS001 129.6 28935 846028 QSS301 160.2 79617 855610
QSS002 136.5 29371 901561 QSS302 173.8 79238 948138
QSS003 122.3 28214 829574 QSS303 154.1 78769 899737
Figure 6: Comparison of stiffness degradation
The tests showed that the unconfined RC column QSS001 developed relatively stable hysteretic hoops Fig-ure 5 a . In the first two cycles, the lateral load linearly increased, and almost no residual deformation. In the third and fourth cycles 12 mm , the first horizontal crack appeared 150 mm from the bottom of the column, followed by the second horizontal crack 350 mm from the bottom. The lateral load increased gradually, and concrete cracking and steel yielding led to the stiffness degradation. When the control displacement reached 16 mm, the correspond-ing load reached its peak. A new horizontal crack occurred 600 mm from the footcorrespond-ing and extended toward the neutral axis, besides, cracks developed within the plastic hinge region, and the residual deformation was significant. With the sustained increment in the control displacement 20 mm , no rapid reduction in load carrying capacity was observed. However, the stiffness of the tested specimens exhibited a sustained decrease, accompanied by cracks tensile and shear that were developed near the plastic hinge. The concrete cover began to spall Figure 7 b . When the control displacement reached 24 mm, lateral loading entered into an obvious descending branch. The cracks within the plastic hinge further developed, and the concrete cover increasingly expanded and peeled. Subsequently, lateral displacement increased, and lateral loading capacity decreased continuously. Furthermore, the hysteresis loops became unsmooth, the stiffness seriously degenerated, shear cracks appeared on the RC footing, concrete within the plastic hinge and chamfered region crushed, and the steel bars became exposed Figure 7 c . These occurrences indicated that severe damages occurred in the column–footing assemblages. The test was ter-minated at a lateral displacement of 32 mm. These phenomena demonstrated that final failure of the unconfined RC columns was caused by tensile and shear damages on the column–footing joint.
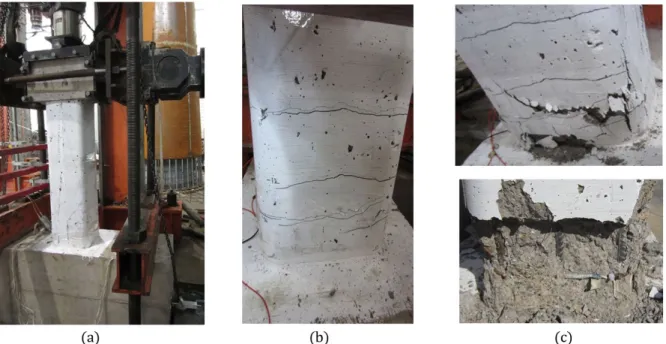
The damage patterns of the steel–confined RC columns QSS301 were different from those of the unconfined RC columns. As shown in Figures 5 b and 6, the steel–confined RC columns developed an improved ductile hyster-etic response, high initial stiffness, and slow degradation rate. Excellent energy absorption and dissipation were reached at a total lateral displacement of 80 mm smoother than QSS001 . During the first two cycles, the lateral load linearly increased, and no residual deformation was observed. With the sustained increment in lateral dis-placement, the lateral loads increased slowly, the steel tube and bars began to buckle, and the hysteresis loops became fusiform-like. The maximum lateral load of 160.2 kN approximately 23.7% higher than that for the uncon-fined column was noted at the control displacement of 24 mm. The residual deformation was significant, and stiff-ness degraded about 68.2%. Subsequently, lateral displacement increased, whereas stiffstiff-ness degradation and load-ing capacity decreased gradually. The hysteresis loops became abundant, and no concrete around the column–foot-ing joint peeled Figure 8 b . When the lateral displacement was 56 mm, the correspondcolumn–foot-ing loads decreased to about 83.2% of the ultimate loads. The hysteresis loops became increasingly saturated, the RC footing began to exhibit local cracks, and little concrete crushed within the plastic hinge. The test was sustained until the lateral displacement reached 80 mm 61.3% of the ultimate load , and the global stiffness degraded about 94.2%. After the stripping of the steel tubes, the swelled surface concrete was found around the column–footing joint, but no obvious horizontal cracks were noted. The concrete could be easily removed, and steel bars were exposed as ex-pected, see in Figure 8 c . Owing to the strong footing and steel constraints, most of the damage on specimen QSS301 was concentrated at the bottom of the column, especially within the plastic hinge region.
and initial stiffness of the steel–confined RC columns can be attributed to the fact that the steel tube restricted the expansion of the core concrete.
Figure 7: Damage pattern and failure mode of unconfined RC column QSS001, a test condition, b characteristic hori-zontal cracks, c close up view of local failure
Figure 8: Damage pattern and failure mode of steel confined RC column QSS003, a test condition, b maximum lateral displacement, c close up view of local failure
4.2 AE observation and analysis
specimen subjected the most severe damages at the peak load. In addition, the experimental failure mechanism of the test specimen was examined in each loading cycle for comparison with the AE response.
The damage evolution of the unconfined RC columns was divided into three stages, marked in Figure 9. In stage 1 first one or two cycles , AE amplitude maintained at less than 80 dB, and nearly no accumulation of AE energy. The crack intensity of the column was weak, only slight damages occurred. The specimen yielded in stage 2 before the ultimate load , and a large number of AE hits occurred in the vicinity of peak displacement. The cumulative AE energy increased steadily corresponding to the stable development of the initial cracks Figure 7 b . In stage 3, the lateral loads continuously decrease, and structural stiffness degraded rapidly. A large number of AE hits higher than 80 dB appeared around the peak load. AE energy accumulated at a high rate, indicated that the column– footing assemblages were damaged into an unstable condition crack connection and concrete crush , demon-strated by the severe damages and unsmooth hysteresis loops.
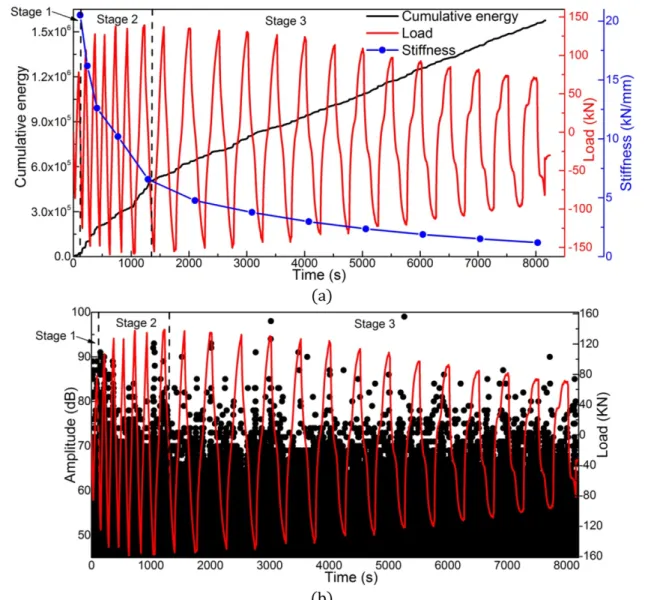
Compared with the unconfined columns, the steel–confined RC columns exhibited excellent ductility and load-ing capacity. And significant discrepancy in the AE response was observed in Figure 10. The total accumulated AE energy of specimen QSS301 was about 1.6E6 attojoules 10–18J , which is only one-fifth of that of specimen QSS001. The combination of minimal dissipated energy and AE hits Table 4 indicated that lighter damages occurred in the steel–confined RC columns, which was achieved by sacrificing a large proportion of stiffness. Similarly, the damage evolution of the steel confined columns also occurred in three stages, marked in Figure 10. In stage 1, almost no accumulation of AE energy. In stage 2, AE energy accumulated increasingly and AE activities became substantial, whereas the lateral loads increased gradually and the specimens yielded. During this stage, the core concrete was under three-dimensional compression, which resulted in high global stiffness and strength, so large amount of en-ergy was required to deform the steel–confined columns. In stage 3, AE enen-ergy accumulated constantly, and the lateral load decreased steadily in a wide deformation range. Stiffness degraded severely, but no vital damage oc-curred due to the excellent ductility and constraint effect of the steel tube.
The AE responses and observed damage patterns during the quasi-static tests implied that stages 1, 2, and 3 related to different stress levels and damage severities. Therefore, further investigation was conducted to quanti-tatively determine the damage severity of test columns in accordance with the proposed damage indicators.
Figure 10: Lateral load versus AE features for steel confined column QSS301, a cumulative AE energy–load–time curve, b AE amplitude–load–time curve
5 QUANTITATIVE EVALUATION OF TEST SPECIMENS BASED ON DAMAGE INDICATORS 5.1 Damage severity assessment based on signal strength
Table 5: Damage severity fluctuation for test specimen only the first 15 cycles for confined columns, unit in 107
Cycle 1 2 3 4 5 6 7 8 9 10 11 12 13 14 15
QSS001 0.05 0.03 0.04 0.06 0.08 0.09 0.12 0.14 0.19 0.22 0.39 0.60 1.09 1.45 2.30
QSS002 0.03 0.02 0.04 0.05 0.07 0.09 0.10 0.13 0.16 0.20 0.37 0.54 0.86 1.31 1.76
QSS003 0.03 0.05 0.06 0.07 0.08 0.10 0.13 0.15 0.18 0.21 0.34 0.49 0.81 1.35 1.87
QSS301 0.02 0.04 0.07 0.08 0.09 0.10 0.13 0.14 0.17 0.20 0.21 0.22 0.25 0.26 0.28
QSS302 0.03 0.04 0.07 0.09 0.10 0.11 0.14 0.16 1.19 0.21 0.22 0.24 0.26 0.27 0.29
QSS303 0.02 0.03 0.05 0.07 0.09 0.10 0.12 0.14 0.16 0.18 0.20 0.22 0.23 0.24 0.26
Figure 11: Lateral load versus damage severity Sr and stiffness degradation for the unconfined column QSS001
Figure 12: Lateral load versus damage severity Sr and stiffness degradation for the steel-confined column QSS301
Table 6: Fluctuation of the modified CSS ratio for test specimen only the first 15 cycles for confined columns
Cycle 1 2 3 4 5 6 7 8 9 10 11 12 13 14 15
QSS001 0.08 0.04 0.09 0.05 0.17 0.26 0.75 0.59 0.91 0.76 1.50 1.24 1.30 0.96 0.91
QSS002 0.09 0.07 0.14 0.11 0.22 0.29 0.67 0.61 0.89 1.43 1.31 1.18 0.93 0.82 0.76
QSS003 0.06 0.05 0.08 0.12 0.15 0.24 0.60 0.66 1.34 1.15 1.27 1.03 0.98 0.87 0.92
QSS301 0.22 0.13 0.37 0.26 0.39 0.60 0.68 0.79 1.19 0.86 0.95 0.88 1.57 0.50 0.71
QSS302 0.17 0.09 0.28 0.22 0.40 0.65 0.77 0.89 1.26 0.94 1.42 1.13 1.02 0.76 0.63
QSS303 0.14 0.08 0.31 0.19 0.43 0.67 0.80 1.05 1.33 0.92 1.26 0.95 0.87 0.64 0.79
Figure 13: Lateral load versus the modified CSS ratio for the unconfined column QSS001
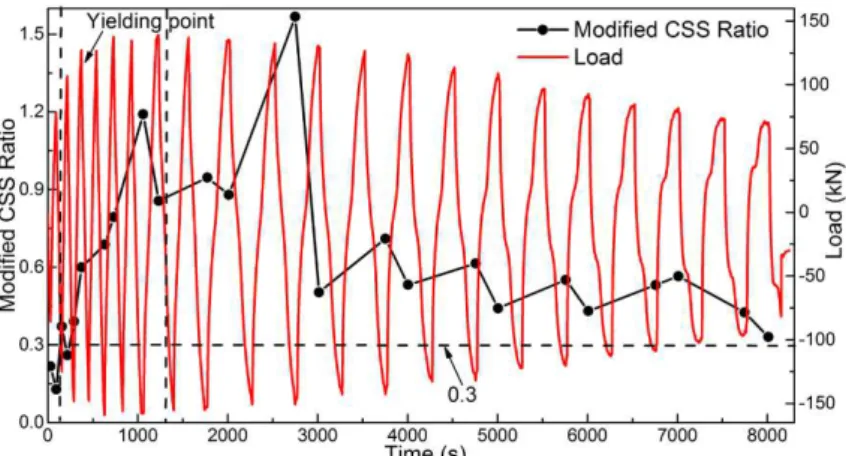
Figure 14: Lateral load versus the modified CSS ratio for the steel-confined column QSS301
Compared with the situation for the unconfined columns, a difference was observed after the peak value of the modified CSS ratio for the steel confined columns. The calculated modified CSS ratio decreased to a low value less than 0.7 corresponding to the evaluated third stage. This result could be due to the progressive damage develop-ment caused by restrained concrete expansion and crack initiation for the steel–confined RC columns. Besides, the modified CSS ratio increased to above 0.3 during the yielding stage, and could be a good warning indicator for structural yielding.
5.2 Failure evaluation through sentry function and b-value analysis
Figure 15: Lateral load versus sentry function variation for unconfined column QSS001
Figure 16: Lateral load versus sentry function variation for steel confined column QSS301
Considering Figure 15, the increasing trend PI presented at Stage 1, in this phase, the unconfined columns constantly absorb energy, and the dissipated energy increased slowly, nearly no accumulation of AE energy. The sudden drop PII and constant PIII corresponding to Stage 2, this stage specifies the ability of material to store energy reaches its limit, and large amount of energy dissipated due to damage progression. The sudden drop oc-curred at nearly the maximum load because of the stored mechanical energy was suddenly released producing high energy AE waves, indicated that important damage occurred to the columns. Whereas, no significant drop of lateral load due to the reinforcement of steel bars. The decreasing of sentry function PIV corresponding to Stage 3, high amount of AE activities occurred and the dissipated energy surpass the energy storage ability. Main part of the decrease is caused by continuously development of macro cracks, cracks connection, and fractures in concrete body. During the failure process, the stored energy released under static loading conditions is mostly converts to surface energy, causing concrete cracking and coalescence. Variation of stored energy reflects the energy transition, which drives the structure instability and damage growth.
As seen in Figure 16, the sentry function of steel–confined RC columns exhibit a constantly increasing trend PI , representing the prolonged energy storing phase. During the first two stages, the function value increased in a higher rate, because of most energy was absorbed. Only slight damages occurred that caused little energy dissi-pation. With the increasing of the control displacement, the ability of material to store energy reached its limit, and the dissipated energy significantly increased due to damage progression, characterized by the notable increasing of AE energy. Hence, the slope of the function decreased in Stage 3. However, the increasing function sustained until the test is terminated, implied that the steel tube restricted the development of concrete expansion and initial de-fects, the energy storing is always dominated during the whole test. No major failure occurred to the confined col-umns. It is granted that if the test was continued, other function shapes including sudden drop PII , constant PIII , and decreasing PIV will certainly appear.
reciprocating loading process, and fluctuated in a large range 0.6–1.8 . The descending trend to each deformation level was apparent. In stages 1 and 2, the b-value was sparse and maintained at above 1.0. This condition indicated the stable development of any existing damages. In stage 3, the b-value became dense and significantly decreased to less than 1.0 when the controlled displacement reached a new level. The main reason was that the most severe damage occurred at peak displacement. The final failure of the unconfined RC columns was corresponding to a lower b-value of 0.6.
For the steel-confined RC column, the b-value also changed up and down during the whole loading process, but fluctuated in a smaller range 0.9–1.7 . The descending trend of the b-value was unobvious, especially during the first two stages, due to the strong constraint of the steel tube and stable development of concrete damages. However, low b-values less than 1.0 were finally observed in the last few cycles, implying that the columns entered an initial failure state.
Figure 17: Lateral load versus b-value variation for unconfined column QSS001
Figure 18: Lateral load versus b-value variation for steel confined column QSS301
In summary, sentry function focused on the damage evolution and energy transition of the test columns, b-value analysis concerned in the quantitative evaluation of damage severity, and the modified CSS ratio showed to be a good indicator of initial yielding and damage activity. Therefore, the combination of sentry function, modified CSS ratio and b-value analysis become a viable alternative means to quantitatively evaluate the failure evolution, determine damage severity, and provide early warning information for composite structures.
6 CONCLUSIONS
history. Post-processing of the monitoring results provided experimental evidence on the validity of AE technology as an in-situ assessment tool for composite structures. The following major conclusions are obtained.
(1) Damage patterns and hysteresis response of steel confined RC columns are quite different from that of the unconfined RC columns. The steel-confined RC columns exhibit excellent energy consumption, higher stiffness, and lighter damage characteristics, demonstrate the practicality of the proposed structure frame.
(2) Typical AE features, such as amplitude, cumulative energy, and damage severity, effectively reflect the hysteresis loading process and stiffness degeneration. The failure process of steel confined RC columns is evaluated into three stages, play an important role in the prevention and control of dynamic disasters.
(3) Critical failure results in the increasing of AE energy accumulation and damage severity, and the b-values decreased to lower than 1.0. Furthermore, the newly proposed modified CSS ratio increased to above 0.3 during the yielding stage and could be a good indicator of initial yielding and early warning for catastrophe.
(4) Sentry function is proved to be a reliable method in steel confined RC columns, that can be used in observe their energy transition and damage mechanisms. Integrated analysis of multiple parameters effectively characterized the damage properties, and successfully identified the critical points for steel confined RC columns.
Notably, these conclusions were reached with limited experimental data, and a combination of experimental and practical studies is still required. The high sensitivity and easy application of the AE technique when well-es-tablished condition-assessment algorithms are applied make the technique a viable candidate for SHM and prog-nosis of in-service structures.
ACKNOWLEDGMENTS
The authors are grateful for the financial support from the National Key Research and Development Program of China Project No. 2017YFC0703410 , and National Natural Science Foundation of China NSFC under Grant Nos. 51478079, 51778104.
References
Baghiee, N., Esfahani, M.R., Moslem, K., 2009 . Studies on damage and FRP strengthening of reinforced concrete beams by vibration monitoring. Engineering Structures 31 4 : 875-893.
Cai, Z., Wang, D., Smith, S.T., Wang, Z., 2016 . Experimental investigation on the seismic performance of GFRP-wrapped thin-walled steel tube confined RC columns. Engineering Structures 110: 269-280.
Carpinteri, A., Lacidogna, G., Manuello, A., 2011 . The b-Value Analysis for the Stability Investigation of the Ancient Athena Temple in Syracuse. Strain 471: E243-E253.
Cesari, F., Dal Re, V., Minak, G., Zucchelli, A., 2007 . Damage and residual strength of laminated carbon–epoxy com-posite circular plates loaded at the centre. Comcom-posites Part A: Applied Science and Manufacturing 38 4 : 1163-1173.
Cheng, Y., Gao, F., Hanif, A., Lu, Z., Li, Z., 2017 . Development of a Capacitive Sensor for Concrete Structure Health Monitoring. Construction and Building Materials 149C: 659-668.
Datt, P., Kapil, J.C., Kumar, A., 2015 . Acoustic emission characteristics and b-value estimate in relation to waveform analysis for damage response of snow. Cold Regions Science and Technology 119: 170-182.
Di Benedetti, M., Nanni, A., 2014 . Acoustic Emission Intensity Analysis for In Situ Evaluation of Reinforced Con-crete Slabs. Journal of materials in civil engineering 26 1 : 6-13.
Dilger, W.H., 2011 . Reinforced concrete: mechanics and design. Canadian Journal of Civil Engineering, 27 6 .
ElBatanouny, M. K., Ziehl, P. H., Larosche, A., Mangual, J., Matta, F., Nanni, A., 2014 . Acoustic emission monitoring for assessment of prestressed concrete beams. Construction and building materials 58: 46-53.
Han, L.H., Liao, F.Y., Tao, Z., Hong, Z., 2009 . Performance of concrete filled steel tube reinforced concrete columns subjected to cyclic bending. Journal of Constructional Steel Research 65 8 : 1607-1616.
Jain, S., 2017 . Structural Health Monitoring of Fiber Reinforced and FRP Strengthened Concrete Elements under Axial Compression using Piezoelectric based Smart Aggregates, Ph.D. Thesis in Indian Indian Institute of Technol-ogy Hyderabad.
Khan, F., Rajaram, S., Vanniamparambil, P. A., Bolhassani, M., Hamid, A., Kontsos, A., Bartoli, I., 2015 . Multi-sensing NDT for damage assessment of concrete masonry walls. Structural Control & Health Monitoring 22 3 : 449-462.
Li, D., Chen, Z., Feng, Q., 2015 . Damage analysis of CFRP-confined circular concrete-filled steel tubular columns by acoustic emission techniques. Smart Materials and Structures 24 8 .
Li, D., Hai, C., Jinping, O., 2012 . Fracture behavior and damage evaluation of polyvinyl alcohol fiber concrete using acoustic emission technique. Materials and Design 40: 205-211.
Loutas, T.H., Kostopoulos, V., Ramirez-Jimenez, C., Pharaoh, M., 2006 . Damage evolution in center-holed glass/pol-yester composites under quasi-static loading using time/frequency analysis of acoustic emission monitored wave-forms. Composites Science and Technology 66 10 : 1366-1375.
Meng, Q., Zhang, M., Han, L., Pu, H., Nie, T., 2016 . Effects of Acoustic Emission and Energy Evolution of Rock Spec-imens Under the Uniaxial Cyclic Loading and Unloading Compression. Rock Mechanics and Rock Engineering 49 10 : 1-14.
Mostafavi, S., Fotouhi, M., Motasemi, A., Ahmadi, M., Sindi, C.T., 2012 . Acoustic Emission Methodology to Evaluate the Fracture Toughness in Heat Treated AISI D2 Tool Steel. Journal of Materials Engineering and Performance 21 10 : 2106-2116.
Philippidis, T.P., Assimakopoulou, T.T., 2008 . Using acoustic emission to assess shear strength degradation in FRP composites due to constant and variable amplitude fatigue loading. Composites Science and Technology 68 3 : 840-847.
Sagar, R.V., 2016 . A parallel between earthquake sequences and acoustic emissions released during fracture pro-cess in reinforced concrete structures under flexural loading. Construction and Building Materials 114: 772-793.
Sagar, R.V., Prasad, B.K., Singh, R.K., 2015 . Kaiser effect observation in reinforced concrete structures and its use for damage assessment. Archives of Civil and Mechanical Engineering 15 2 : 548-557.
Selman, E., Ghiami, A., Alver, N., 2015 . Study of fracture evolution in FRP-strengthened reinforced concrete beam under cyclic load by acoustic emission technique: An integrated mechanical-acoustic energy approach. Construc-tion and Building Materials 95: 832-841.
Sengupta, S., Datta, A. K., Topdar, P., Sengupta, S., Datta, A. K.,Topdar, P., 2015 . Structural damage localisation by acoustic emission technique: A state of the art review. Latin American Journal of Solids and Structures 12 8 : 1565-1582.
Shan, J. H., Chen, R., Zhang, W. X., Xiao, Y. Yi, W. J., Lu, F. Y., 2007 . Behavior of concrete filled tubes and confined concrete filled tubes under high speed impact. Advances in Structural Engineering 10 2 : 209-218.
Stavrakas, I., Triantis, D., Kourkoulis, S.K., Pasiou, E.D., Dakanali, I., 2016 . Acoustic Emission Analysis of Cement Mortar Specimens During Three Point Bending Tests. Latin American Journal of Solids and Structures 13 12 : 2283-2297.
Teng, J.G., Xiao, Q.G., Yu, T., Lam, L., 2015 . Three-dimensional finite element analysis of reinforced concrete col-umns with FRP and/or steel confinement. Engineering Structures 97: 15-28.
Wu, Y.F., Liu, T., Oehlers, D.J., 2006 . Fundamental principles that govern retrofitting of reinforced concrete col-umns by steel and FRP jacketing. Advances in Structural Engineering 9 4 : 507-533.
Yao, J., Li, X., Li, Z., 2001 . Experimental study of a circular concrete column reinforced with a composite tube. Composites Science and Technology 61 13 : 1881-1887.