Damage evaluation and failure mechanism analysis of steel tube
confined reinforced-concrete columns by acoustic
emission technology
Abstract
As a new kind of composite structures and its advantages, the using of steel tube confined reinforced concrete (STCRC) columns have received increas-ing attention in civil engineerincreas-ing. Acoustic emission (AE) technique is ap-plied to monitor the damage process of STCRC columns during an uniaxial compression test. The aim of this study is to investigate the damage evalua-tion and failure mechanisms of the STCRC columns from the perspective of microscopic damage. Typical AE parameters are extracted to quantify dif-ferent damage condition and identify the critical point. Peak-frequency analysis classify the damage signal into groups, representing different AE generation mechanisms. Extended AE features, such as the RA value and the average frequency are calculated to discriminate the cracking modes of core concrete. The probability based Gaussian mixture model (GMM) are proposed for unsupervised damage pattern recognition. All presented AE results are good in accordance with the observed experimental outcomes. The AE technology enabled evaluating the damage condition, identifying critical point, disclosing the failure mechanism, and classifying damage modes for steel confined RC columns effectively.
Keywords
steel tube confined RC column, acoustic emission, damage evaluation and classification, failure mechanism, critical warning
1 INTRODUCTION
Steel/concrete composite structure has been widely applied in high-rise buildings, long-span bridges and underground structures. Therein, concrete-filled steel tube (CFST) columns is one of the preferred components of these large-scale projects because of high bearing capacity, good seismic performance and excellent ductility (Sa-kino et al., 2004; Schnabl and Planinc, 2017). However, some researchers (Ding et al., 2011) reported that the confinement effect does not occur during the elastic stage when Poisson’s ratio of steel is higher than that of core
concrete. The premature buckling of steel tubes under biaxial stress will further decrease the ductility of CFST columns. Furthermore, the connection between the CFST columns and RC beam is quite complicated, which then lead to great difficulty in design and construction. In order to overcome these problems, some scholars (Riyad and Rafael, 1998; Liu et al., 2009) have put forward the improved structure form called steel tube confined reinforced concrete (STCRC) columns. The most prominent feature of STCRC column is that the outside steel tube was cut off at both ends. Therefore, the axial load is directly applied on the core concrete, while the steel tube is mainly used for lateral restraint so that core concrete could be confined more effectively. Zhou et al. (2008) and Wang et. al (2017) thoroughly investigated the mechanical and performance of the STCRC columns, and illustrated that the steel tube in STCRC column shows a better confinement effect and seismic behaviour than that of CFST column. Different from the traditional RC structure, the STCRC column possesses a highly complex and sheltered failure mechanism by combining steel tubes, concrete, and steel rebar, and the damage process of the wrapped core con-crete can not be observed directly. Thus, developing a continuous monitoring and non-destructive evaluation method to assess the damage deterioration in STCRC structure is in great demand.
Fangzhu Dua,b Shengshan Pana* Dongsheng Lia,b
a School of Civil Engineering, Dalian University of
Technology, Dalian 116024, China. E-mail: [email protected], [email protected], [email protected]
b State Key Laboratory of Coastal and Offshore
Engineering, Dalian University of Techno-logy,Dalian 116024, China.
*Corresponding author
http://dx.doi.org/10.1590/1679-78255339
technology
Structural health monitoring (SHM) started from 1980s, and developed greatly in civil engineering in recent years. SHM can detect, locate, and quantify structural damages based on measurement and analysis of data from sensors, that help us know the safety and amenity of structures, has emerged as a promising technology for in-stantaneous assessment of damages and deterioration in structures (Yang et al., 2008; Liu et al., 2012; Döhler et
al., 2014). Acoustic emission (AE) is a non-destructive testing (NDT) technique and can provide reliable and real-time information on the condition of the structure, has been extensively explored in civil engineering for SHM and damage evaluation. This technique utilizes the detection of transient elastic waves caused by plastic deformation or cracks propagation during the increasing load or material deterioration. Piezoelectric AE transducers can de-tect the micro-vibration on the surface of material and convert it into a usable electric signal, called AE signal (Sengupta et al., 2015). AE signal contains useful information on the material damages, the location, mechanism, and severity of the AE source can be assessed by analysis of the resultant waveform. AE is sensitive to small dam-ages, and it not only can monitor the damage state of the sensor site, but also can monitoring certain areas where excited stress wave are readily accessible, without having to affect the integrity of structures (Philippidis and Assimakopoulou, 2008). Given its unique superiorities, numerous researchers have shown that the AE monitoring technique could be applied to damage evaluation for civil engineering structures, such as concrete structures (Farhidzadeh et al., 2013a), composite structures (Ma and Li, 2017), and huge bridges(Nair and Cai, 2010), and so on.
To the author’s best knowledge, previous studies mostly focused on the mechanical behaviour, seismic
be-haviour, and constitutive model for steel tube confined RC structure, but the cognition of its health monitoring and damage mechanism has not been comprehensively illustrated. Du et al. (2018) reported the AE monitoring and evaluating for the steel confined RC columns under seismic loading, however, the interior failure mechanisms and fracture modes was not touched. This study concentrate on the continuous AE monitoring and evaluation for STCRC columns during axial compression test. Typical AE parameters are extracted for damage tracing and condi-tion assessment, several promising methods are applied to further analyze the cracking mechanism and classifica-tion. Pursuant to the Japanese code JCMS-III B5706 (2003), the relationship between RA value (rise time/amplitude) and average frequency (counts/ duration) can be used for the crack classification in concrete structures. For most case of materials from initial load to destruction, tensile cracks are developed at the initial stage of loading, while shear cracks gradually dominate later (Aggelis, 2011; Ohno and Ohtsu, 2010). Therefore, the classification of cracks can contribute to the determination of failure pattern and critical warning. However, a quantified criterion on the proportion of these two parameters (RA and AF) has not been confirmed yet. Consid-ering the fact that the obtained AE signals are affected by many factors, such as the type of AE sources, the reso-nate frequency of sensors, and the propagation path from the AE source to sensor, et al. Recently, a popular prob-abilistic method called Gaussian mixture model (GMM) has been proposed for concrete crack classification (Farhidzadeh et al., 2015; Farhidzadeh et al., 2013b). The GMM algorithm overcome some deficiencies of conven-tional crack classification method, and the component densities of GMM can model an underlying set of hidden classes (Farhidzadeh et al., 2013b; Wang et al., 2018).
The present research aim at employ the prevailing AE technique to monitor the damage process of the steel tube confined RC columns under compressive loading, so as to reveal its damage evolution and failure mecha-nisms from the perspective of micro scope. 1) Typical AE parameters, such as energy and rise time, are extracted for damage evolution analysis. 2) The integrated analysis of loading process, cumulative energy, and peak fre-quency are conducted to reveal failure mechanisms and provide critical warning. 3) The correlation analysis of RA value and average frequency are incorporated with the peculiar Gaussian mixture model (GMM), to discrimi-nate the shear and tensile cracks from the probabilistic view.
2 EXPERIMENTAL PROCEDURE
2.1 Specimen preparation
technology
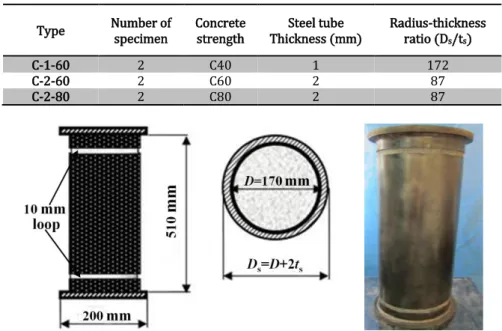
Table 1: Basic Information of Test Specimen.
Type Number of specimen
Concrete strength
Steel tube Thickness (mm)
Radius-thickness ratio (Ds/ts)
C-1-60 2 C40 1 172
C-2-60 2 C60 2 87
C-2-80 2 C80 2 87
Figure 1: Schematic diagram of test specimens. Figure 2: Photo of test specimen.
2.2 Material properties
The customized steel tube used in the experiment was Steel Q235 with the thickness of 1 mm or 2 mm. The mechanical properties of the steel tube were obtained from a standard tensile test of prepared coupons, according to Chinese Code for Metallic materials—Tensile testing at ambient temperature (GB/T228-2002). Detailed steel properties are shown in Table 2. This experiment employed two types of commercial concrete, the nominal C60 and C80, manufactured by Dalian JINHE Concrete Mixing Plant. The standard cube specimens were cured and tested in accordance with Chinese Code for Test and Evaluation of Concrete Strength (GB50107-2010). The tested average concrete compressive strength of C60 and C80 was 68.7 MPa and 81.1 MPa, respectively. The adopted longitudinal rebar was 6Φ12 and its reinforcement ratio was 2.98%. The allocation of stirrup was Φ6@100 and the corresponding volume ratio was 1.13%.
Table 2: Mechanical properties of steel tube.
Thickness (mm)
E-modulus
(GPa) yield strength (MPa)
Tensile strength (MPa)
1 210 188 330
2 204 192 345
2.3 Experimental setup
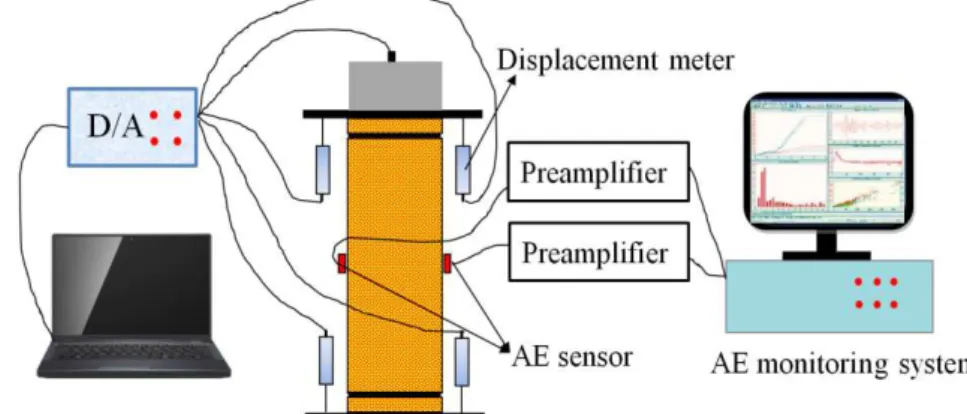
The specimens were tested on a 10000 kN hydraulic testing machine made by Beijing Fluid Control System (FCS) Corp. Two displacement meters were set on the loading station to monitor the axial displacement, strain gages were attached to the middle surface of the tube to measure the axial and circular strain, and a calibrated load cell was used to record the axial pressure. The loading protocol was applied by displacement control, main-tained at a loading rate of 0.5 mm/min.
A two-channel MISTRAS 2001 data acquisition system from the American Physical Acoustics Corporation
technology
Figure 3: Experimental schematic and AE system.
3 ANALYTICAL METHODOLOGY
3.1 RA Value and Average Frequency (AF)
The Japanese Construction and Material Standard(JCMS-III B5706, 2003) proposed a technique to monitor the crack propagation in concrete structures based on two AE parameters, namely RA value and average frequen-cy (AF). RA value is defined as the ratio of rise time to amplitude, while AF is defined as the AE counts divided by the duration of the signal. The formula of these two parameters are presented in the following equations:
RA = Rise time/Amplitude (1)
AF = Counts/Duration (2)
According to previous researches (Aggelis, 2011), the type of concrete fracture can be classified as a shear failure or a tensile failure. When an AE signal has low average frequency and high RA value, it is classified as shear type crack. By contrast, a signal with high average frequency and low RA value, is classified as tensile crack, as demonstrated in Figure 4. Generally speaking, tensile cracks should be related to the progressive development of new cracks, while shear cracks can be associated with the sliding and mutual-connection of existing cracks. The crack mode can be classified by separating the flexural and shear sources based on the predefined diagonal line in Figure 4.
Figure 4: Classification of crack types.
3.2 Gaussian mixture model
technology
1
( ) ( , )
k
j j j j j
p xλ α N x µ C
=
=
∑
; j=1,,k (3)
where áj represents the mixture weights. The mixture weights must satisfy the following constraint,
1
1; 1,
,
k j
j−
α
=
j
=
k
∑
(4)
and Nj (x∣ģj,Cj) represents the D-dimensional unimodal Gaussian (Normal) distribution, corresponding density function is given by the following equation,
( )
(
)
(
)
1 1/ 2
/ 2
1 1
( , ) exp
2 2
T
j j j D j j j
j
N x C x C x
C
µ µ µ
π − = − − − (5)
where ģj is a D×1 mean vector, and Cj is a D×D covariance matrix. The GMM is parameterized by the mean
vectors, covariance matrices, and mixture weights of each Gaussian distribution. These parameters can be grouped as,
( j, j,Cj) λ= α µ
; j=1,,k (6)
Generally, the expectation–maximization (EM) algorithm can be used to estimate the parameters λ of the
GMM (Roberts and Furui, 2000; Tagare et al., 2010). The EM algorithm is an iterative learning that maximizes the likelihood function generated by each GMM. In this study, GMM algorithm is proposed to classify a two-dimensional AE feature vector X= (RA, AF) into two clusters. Elements belong to one cluster is associated to ten-sile cracks, while elements belong to another cluster should be attributed to shear cracks.
4 DAMAGE EVALUATION BASED ON TYPICAL AE PARAMETERS
4.1 Damage evaluation and basic AE response
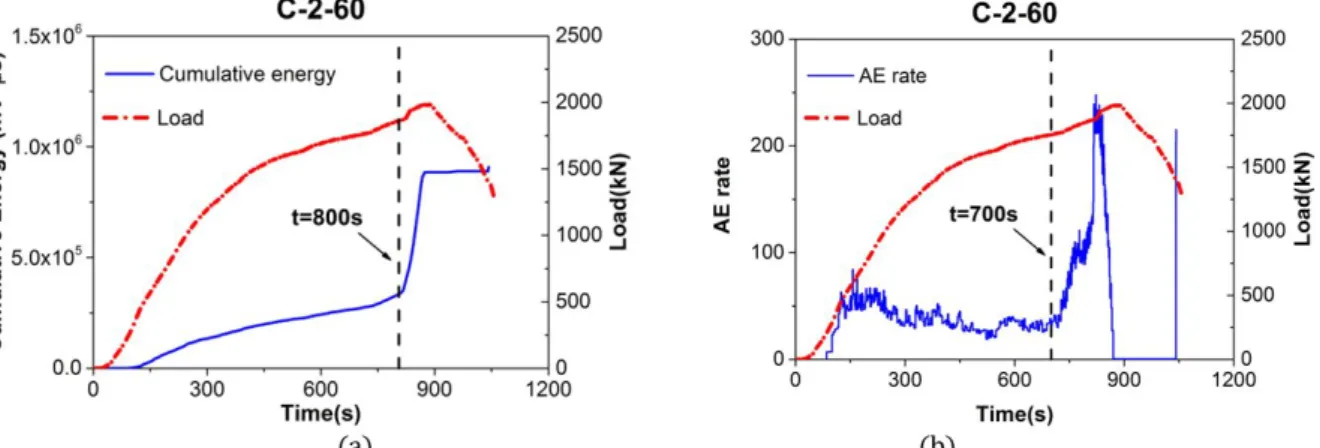
The compression test results and AE responses of all specimens are shown in Table 3, Figure 5, Figure 6, and Figure 7 provide the correlation between typical AE parameters and loading history for group C-1-60, C-2-60, and C-2-80, respectively. The red curve represents the axial load, while the blue curve represents the variation of cu-mulative AE energy or AE rate. The results showed that all the specimens presented the similar variation trend of AE activity. Figure 8 provides the ultimate damage pattern of each test group.
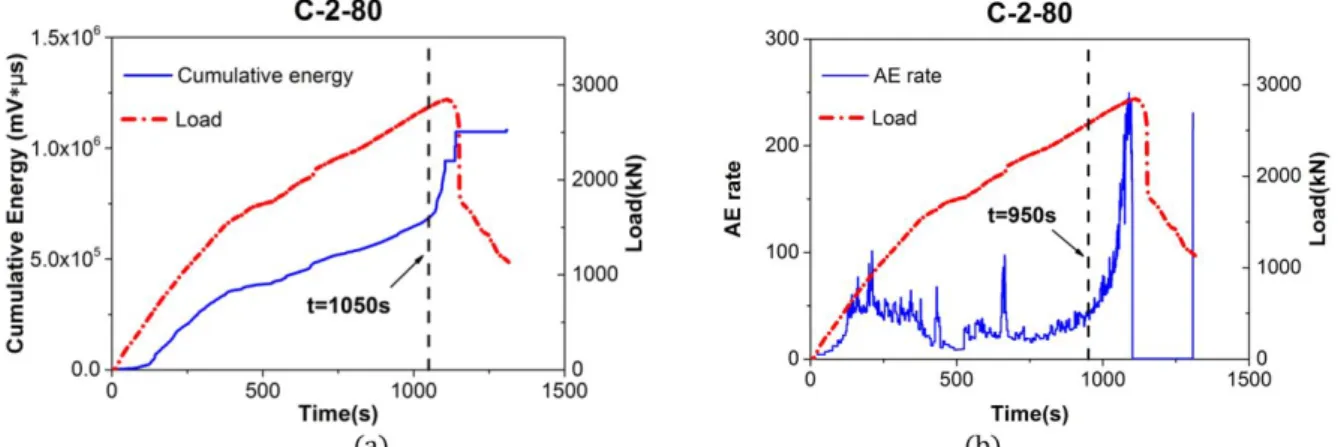
AE energy, derived from the time integral of the square of the instantaneous signal voltage V(t) over the sig-nal duration, can be related to the intensity of cracks, and the accumulation of AE energy can reflect damage se-verity. Figures 5(a), 6(a) and 7(a) provide the variation of cumulative AE energy and loading history during the whole damage process. With the increase of axial load, the curve of cumulative AE energy increase continuously and the damage get further intensified. There are always a noticeable knee point of slope change in cumulative energy curve, at nearly 600 s, 800 s, and 1050 s for the three test group. The cumulative AE energy increased slowly from the initial loading period and a sharp rise occurred near the ultimate load. The slowly accumulation of AE energy implies the progressive development of structural damages, while the sharp increase of AE energy means the occurrence of some major damages, and the columns are in a unstable state.
By comparison, Figures 5(b), 6(b) and 7(b) present the variation tendency of AE rate. AE rate refers to the number of AE signals collected in unit time, which can be used to measure the activity AE phenomenon. In this work, each AE rate value was calculated by every 200 AE events. During the initial stage, the stub column was in a stable state, correspondingly, the value of AE rate maintained at lower than 50 per unit. When the axial load ap-proach 80% of the ultimate load, the distinct knee point can be observed. Subsequently, the calculated AE rate continuously increase up to about 250 per unit, which means the columns are unstable and seriously damaged.
technology
It is worth noting, with the increasing of the steel tube thickness (C-1-60 and C-2-60) and concrete strength (C-2-60 and C-2-80), the loading capacity and ductility correspondingly increased, the damage pattern and AE response also show some differences. Table 3 shows that the average strength of 2-60 is about 1.25 times of C-1-60 (with different steel tube thickness), by increasing concrete strength, the average strength of C-2-80 is about 1.45 times of C-2-60. Besides, the occurrence of knee point is delayed with the increasing of steel thickness and concrete strength (marked in Figures 5, 6 and 7), show higher deformability.
Figures 8 provides that the ultimate state of all specimens show sign of shear failure, the damage severity of group C-1-60 is higher than C-2-60 (with 2 mm steel tube), implies that the increment of steel thickness can miti-gate the degree of shear failure, and the same for increase concrete strength. Whilst, the ultimate cumulative en-ergy of the three test group show clearly increase (Table 3), that means the increment of steel tube thickness or concrete strength enhanced the STCRC columns, thus more energy are needed to deform the columns, though lighter damages occurred.
Table 3: Basic test results of each STCRC column.
Specimen Number Ultimate load (kN)
Cumulative hits
Cumulative ener-gy (mV*ìs)
Maximum AE rate
C-1-60 1 1591 43133 966600 255
2 1507 38133 823542 246
C-2-60 1 1981 40979 908203 247
2 1876 45752 968203 241
C-2-80 1 2763 41120 1183474 239
2 2848 43365 1083474 260
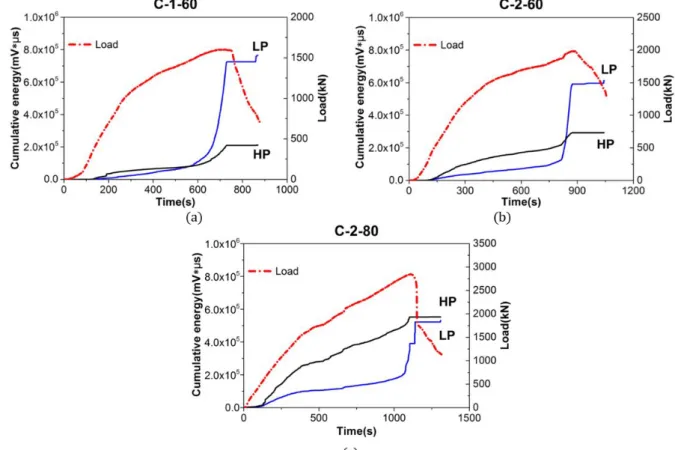
Figure 5: Loading versus AE features for test group C-1-60, (a) cumulative AE energy versus loading history, (b) AE rate versus loading history.
technology
Figure 7: Loading versus AE features for test group C-2-80, (a) cumulative AE energy versus loading history, (b) AE rate versus loading history.
Figure 8: Final failure modes of specimens, (a) C-1-60, (b) C-2-60, (c) C-2-80.
4.2 Frequency based identification for damage mechanisms
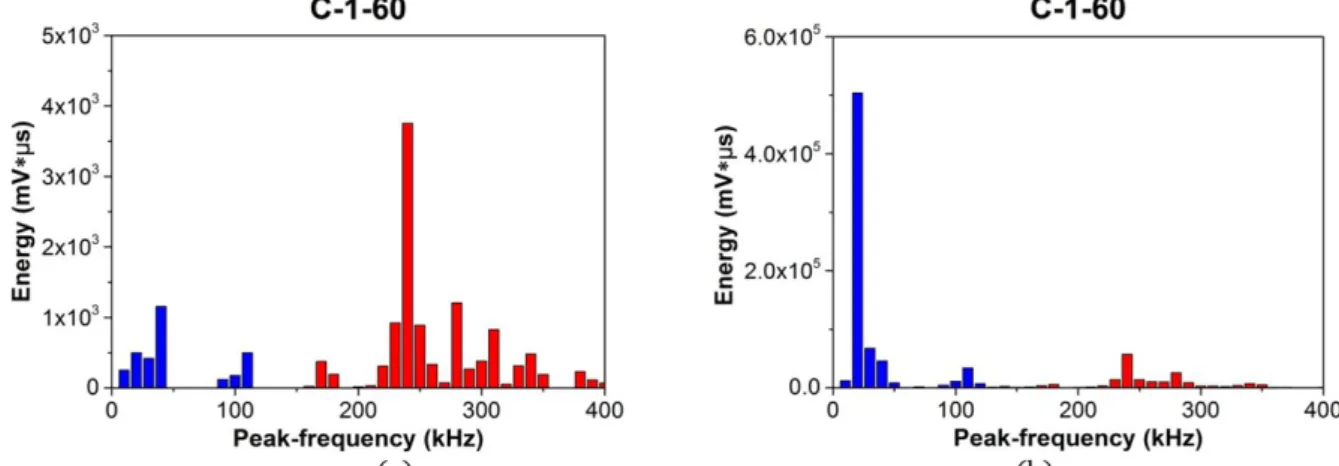
Further investigation is conducted to identify the failure mechanisms of STCRC columns based on frequency distribution. In terms of the STCRC columns, the main damage modes are concrete cracking, steel/concrete inter-face damage, and steel deformation. Generally, peak-frequency can serve as a good AE indicator to discriminate different damage sources. According to previous literatures (Zhang et al., 2015; Zitto et al., 2015), concrete crack-ing usually lead to AE events with low frequency (less than 100 kHz), while damages related to steel material would contribute to AE events with a higher frequency. Figure 9, Figure 10, and Figure 11 present the distribution between AE energy and peak-frequency for each test group at different loading stages.
technology
Figure 9: Distribution between AE energy and peak-frequency for group C-1-60, (a) 30% ultimate load, (b) 100% ulti-mate load.
Figure 10: Distribution between AE energy and peak-frequency for group C-2-60, (a) 30% ultimate load, (b) 100% ul-timate load.
Figure 11: Distribution between AE energy and peak-frequency for group C-2-80, (a) 30% ultimate load, (b) 100% ul-timate load.
technology
Figure 12: Loading history versus cumulative energy of two frequency bands, (a) Group C-1-60, (b) Group C-2-60, (c) Group C-2-80.
5 CRACK CLASSIFICATION BASED ON GMM ALGORITHM
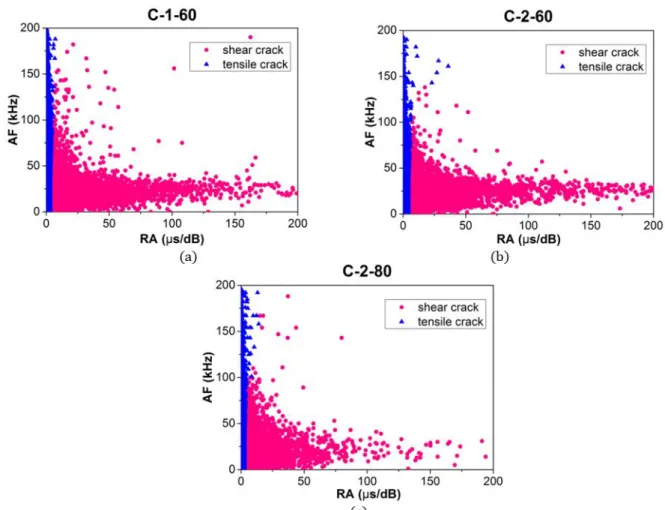
In above section, the damage mechanisms of STCRC columns are preliminarily identified through the correla-tion analysis between cumulative energy and peak frequency. Further investigacorrela-tion on failure mechanisms are perform by RA−AF and GMM method from the perspective of the fracture modes. Tensile cracks lead to AE signals with higher average frequency and lower RA values, on the contrary, shear cracks generate signals with higher RA value and low frequency (Aggelis, 2011). Therefore, the fracture modes of STCRC columns can be determined by the RA and AF values of the AE signals. Considering that the method is fit for crack classification of concrete dam-ages (Ohno and Ohtsu, 2010), thus only the AE events in low-frequency band (0-150kHz) are used for RA−AF crack classification.
technology
Figure 13: Crack classification results by using GMM algorithm, (a) Group C-1-60, (b) Group C-2-60, (c) Group C-2-80.
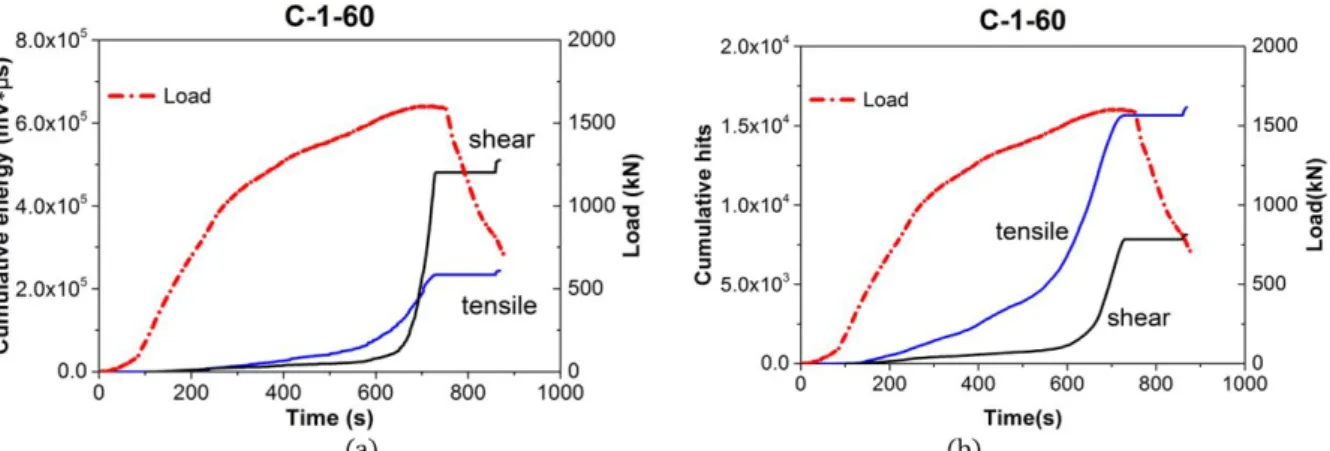
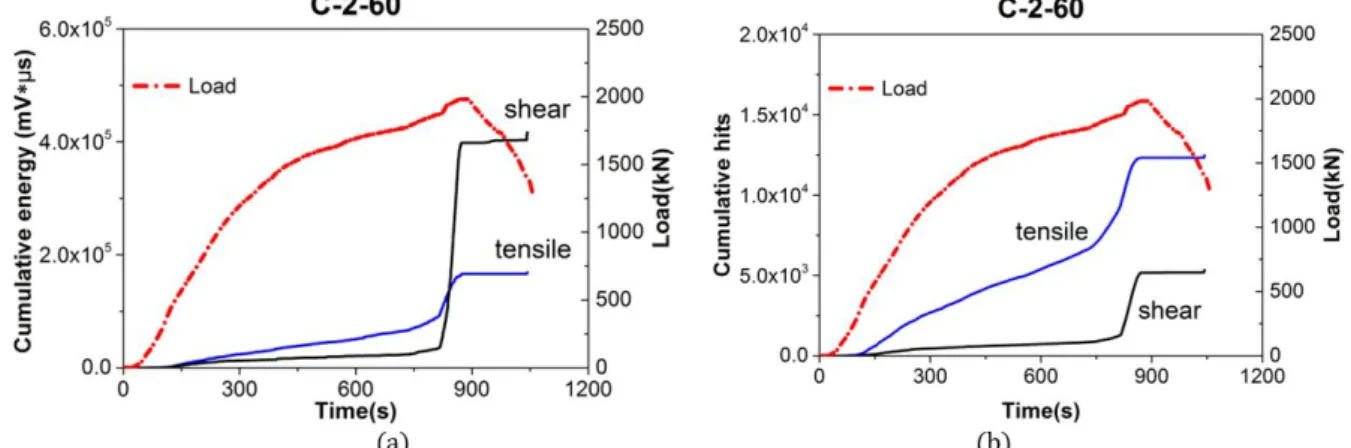
Figure14 shows the crack development of representative test group C-2-60 under different loading condi-tions. The number of shear cracks increase gradually through the loading process and become much more signifi-cant when reached the ultimate load. Figure 15, Figure 16, and Figure 17 present the fluctuation of cumulative AE energy and signal number for each class during the whole loading process. The number of shear cluster is always less than that of tensile cluster, and a significant increase of two clusters is observed before final catastrophe. Prior to the peak load, the cumulative energy of the shear cluster increased significantly, and far exceed that of tensile cluster. This result indicates that the major source of energy is the shear cracks when the final destruction occurred.
technology
Figure 14: Concrete cracks evolution during different loading condition for C-2-60, (a) 30% ultimate load (b) 50% ulti-mate load, (c) 80% ultiulti-mate load, (d) 100% ultiulti-mate load.
technology
Figure 16: AE progression of two crack clusters for C-2-60, (a) concrete cracking evolution versus cumulative AE energy, (b) concrete cracking evolution versus cumulative AE hits.
Figure 17: AE progression of two crack clusters for C-2-80, (a) concrete cracking evolution versus cumulative AE energy, (b) concrete cracking evolution versus cumulative AE hits.
6 CONCLUSIONS
AE technique is successfully applied to monitor the damage progression of the proposed STCRC columns un-der uniaxial compressive loading. The satisfactory monitoring and evaluating results provided preferably experi-mental evidence on the validity of AE technology as viable candidate tool for SHM and NDE for composite struc-tures. Conclusions are drawn as follow:
The damage evolution of STCRC columns are investigated based on the variation of typical AE features, the proposed cumulative energy and AE rate provide quantitative information for damage severity, and the distinct knee point provide critical warning information before catastrophe.
The peak-frequency has proved to be a promising parameter to discriminate different damage modes, and the correlation analysis of AE energy and peak-frequency successfully disclosing the damage mechanisms for STCRC columns.
The concrete cracking modes are further analyzed based on RA value and average frequency, concrete cracks are automatically classified through the GMM algorithm from the perspective of uncertainty. Shear cracks cause less AE activity, however, contribute more to the final failure of STCRC columns.
ACKNOWLEDGMENTS
technology
References
Aggelis, D.G., (2011). Classification of cracking mode in concrete by acoustic emission parameters. Mechanics Research Communications 38(3): 153-157.
Ding, F.X., Yu, Z.W., Bai, Y., Gong, Y.Z., (2011). Elasto-plastic analysis of circular concrete-filled steel tube stub col-umns. Journal of Constructional Steel Research 67(10): 1567-1577.
Döhler, M., Hille, F., Mevel, L., Rücker, W., (2014). Structural health monitoring with statistical methods during
progressive damage test of S101 Bridge. Engineering Structures 69(9): 183-193.
Du F., Li D., Shan B., Wang Y., (2018) Failure behavior monitoring and evaluation of steel-confined reinforced con-crete columns by acoustic emission under quasi-static loading. Latin American Journal of Solids and Structures 15(11): e132.
Farhidzadeh, A., Dehghan-Niri, E., Salamone, S., Luna, B., Whittaker, A., (2013a). Monitoring Crack Propagation in Reinforced Concrete Shear Walls by Acoustic Emission. Journal of Structural Engineering 139(12): 116-134.
Farhidzadeh, A., Epackachi, S., Salamone, S., Whittaker, A.S., (2015). Bayesian decision and mixture models for AE monitoring of steel-concrete composite shear walls. Smart Materials and Structures 24(11): 115028.
Farhidzadeh, A., Salamone, S., Singla, P., (2013b). A probabilistic approach for damage identification and crack mode classification in reinforced concrete structures. Journal of Intelligent Material Systems and Structures 24(14): 1722-1735.
JCMS-III B5706 (2003). Monitoring method for active cracks in concrete by acoustic emission. Federation of Con-struction Materials Industries.
Liu, J., Zhang, S., Zhang, X., Guo, L., (2009). Behavior and strength of circular tube confined reinforced-concrete (CTRC) columns. Journal of Constructional Steel Research 65(7): 1447-1458.
Liu, X., Zhou, C., Jiang, Z., (2012). Damage localization in plate-like structure using built-in PZT sensor network. Smart Structures and Systems 9(1): 21-33.
Ma, G., Li, H., (2017). Acoustic emission monitoring and damage assessment of FRP-strengthened reinforced con-crete columns under cyclic loading. Construction and Building Materials 144: 86-98.
Nair, A., Cai, C.S., (2010). Acoustic emission monitoring of bridges: Review and case studies. Engineering Struc-tures 32(6): 1704-1714.
Ohno, K., Ohtsu, M., (2010). Crack classification in concrete based on acoustic emission. Construction and Building Materials 24(12): 2339-2346.
Philippidis, T.P., Assimakopoulou, T.T., (2008). Using acoustic emission to assess shear strength degradation in FRP composites due to constant and variable amplitude fatigue loading. Composites Science and Technology 68(3-4): 840-847.
Riyad, S.A., Rafael, M., (1998). Seismic resistance of steel confined reinforced concrete (SCRC) columns. Structural Design of Tall Buildings 7(3): 251-260.
technology
Sakino, K., Nakahara, H., Morino, S., Nishiyama, A., (2004). Behavior of centrally loaded concrete-filled steel-tube short columns. Jouranl of Structural Engineering 130(2): 180-188.
Schnabl, S., Planinc, I., (2017). Buckling of Slender Concrete-Filled Steel Tubes with Compliant Interfaces. Latin American Journal of Solids and Structures 14(10): 1837-1852.
Sengupta, S., Datta, A.K., Topdar, P., (2015). Structural damage localisation by acoustic emission technique: A state of the art review. Latin American Journal of Solids and Structures 12(8): 1565-1582.
Tagare, H.D., Barthel, A., Sigworth, F.J., (2010). An adaptive Expectation-Maximization algorithm with GPU imple-mentation for electron cryomicroscopy. Journal of Structural Biology 171(3): 256-265.
Wang, Q., Ma, S., Yue, D., (2018). Identification of damage in composite structures using Gaussian mixture model-processed Lamb waves. Smart Materials and Structures, 27(4): 045007.
Wang, Y., Wang, W., Zhou, X., Liu, J., (2017). Experimental study on seismic behavior of steel tube confined rein-forced concrete columns subjected to combined compression-bending-torsion. Journal of Building Structures 38(S1): 185-189.
Yang, C., Wu, Z., Zhang, Y., (2008). Structural health monitoring of an existing PC box girder bridge with distribut-ed HCFRP sensors in a destructive test. Smart Materials and Structures 17(3): 035032.
Zhang, P., Sang, Y., Zhao, Z., Xu, Y., (2015). Application of Acoustic Emission Technique in Q345E Steel Tensile Damage Detection. Journal of Gansu Sciences 27(2): 83-87.
Zhou, X., Zhang, S., Liu, J., (2008). Seismic behavior of steel tube confined reinforced concrete (RC) beam-columns. Journal of Building Structures 29(5): 75-84.