Brazilian Microwave and Optoelectronics Society-SBMO received 28 Sept 2018; for review 6 Nov 2018; accepted 20 Nov 2018
Brazilian Society of Electromagnetism-SBMag © 2018 SBMO/SBMag ISSN 2179-1074 Abstract— This work presents the operation of a spontaneous
Raman scattering-based distributed fiber-optic temperature sensor using a commercial OTDR and a standard EDFA optical amplification in a simple and economic scheme. We present both theoretical and experimental results regarding the sensor’s sensitivity and performance in seven different configurations, using OTDR pulses of 100 ns to 4000 ns for two detection regions, in the beginning and ending sections of a 27 km standard single-mode fiber sensor link. The results reveal the trade-off between sensor sensitivity, resolution and range, regarding the use of different OTDR pulsewidths.
Index Terms—Raman Scattering, Optical Fiber, OTDR, temperature sensor, optical sensor.
I. INTRODUCTION
Fiber-optic sensors have been studied for more than 40 years now. Since the beginning, various optical sensors have been proposed to monitor a wide variety of physical parameters [1]-[3]. In distributed fiber-optic sensors, the profile of a physical parameter can be gauged throughout the fiber. The features of distributed intrinsic sensors make them suitable for a plethora of applications that require monitoring a certain parameter continuously or in a large number of sections [2].
Raman-based distributed fiber-optic temperature sensors (R-DTS) have been proposed for a number of applications, such as temperature monitoring in high-voltage power lines, prevention and detection of fires in oil wells, aeronautical and space applications, among others [2], [3]. Optical fiber dielectric material also enables the use of R-DTSs in hostile environments, such as explosive or corrosive atmospheres, nuclear plants, and environments with high electromagnetic interference. Furthermore, these sensors may be used to monitor temperatures in a difficult-to-reach remote location (dozens of kilometers away) [1].
In general, temperature detection based on Raman scattering is in turn based on optical time-domain reflectometry (OTDR), and the distribution of temperature is obtained by measuring the intensity of the backscattered Stokes and anti-Stokes signals originating from the Raman scattering. However, the low intensity of the backscattered anti-Stokes emission poses some limitations on sensitivity and reach. For this reason, amplification modules are inserted into the project of these
Impact of Pulse Width on the Sensitivity and
Range of a Raman-based Distributed
Fiber-optic Temperature Sensor
Marianne S. P. e Silva1, Henrique P. Alves1, Jehan F. do Nascimento2, Joaquim F. Martins-Filho1
1Department of Electronics and Systems, Federal University of Pernambuco. Recife, Brazil [email protected], [email protected]
Brazilian Microwave and Optoelectronics Society-SBMO received 28 Sept 2018; for review 6 Nov 2018; accepted 20 Nov 2018
Brazilian Society of Electromagnetism-SBMag © 2018 SBMO/SBMag ISSN 2179-1074
sensors systems [4], [5].
In the last decades, many studies were published on techniques and measurement protocols, as a means to foster R-DTS systems, by improving parameters such as operating range, sensitivity, spatial resolution, costs, etc. [6]-[9]. Viable and economic R-DTSs, operating at distances of 40 km, have already been analyzed and tested [10]. One example of high-performance temperature sensor is the R-DTS scheme based on coded OTDR along with the discrete Raman amplification discussed in [10]. Using pulses of 100 ns, this system demonstrated the increase of the distance range by about 25 km when compared to the use of conventional OTDR, whose range is of approximately 15 km at a resolution of 5 K in temperature [10]. An R-DTS using a commercial optical time-domain reflectometer (OTDR) and a gain-controlled Erbium-doped fiber amplifier (EDFA) was proposed in [11]. This work illustrated the viability of implementation and the potential of good-performance R-DTSs using commercially available OTDRs. These works explored the use of low-noise signal codification and amplification techniques in order to improve the sensitivity and performance of R-DTSs, but there are no reports in the literature that evaluate the impact of OTDR pulse width in the sensitivity, range, and in the general performance of the sensor.
In this work, we present results from a R-DTS implemented using a commercial OTDR and a standard EDFA amplifier so that we can evaluate the implications of different pulse widths in the measurement of temperatures at short and long distances in the optical fiber.
II. EXPERIMENTAL SETUP
Fig. 1 illustrates the experimental setup employed to implement the Raman-based distributed temperature sensor using commercial OTDR and standard EDFA.
In the system of Fig. 1, the OTDR, operating at 1550 nm, emits periodic light pulses with predefined temporal width. Such pulses are amplified by an EDFA and injected into the sensor link by means of an optical circulator. The OTDR used is an Anritsu (Model MT9083C2), with maximum
Brazilian Microwave and Optoelectronics Society-SBMO received 28 Sept 2018; for review 6 Nov 2018; accepted 20 Nov 2018
Brazilian Society of Electromagnetism-SBMag © 2018 SBMO/SBMag ISSN 2179-1074
optical power of 0.15 W, 3 ns pulses at 20 μs and dynamic range of 45 dB @ 20 μs and 25 dB @ 100 ns. The EDFA was implemented with 10 m of Erbium-doped fiber (type M3 1480/125), and a pumping laser at 980 nm. In addition, we configured the EDFA to produce 18 dBm of output power when the pumping power is 36.5 mW. The amplified OTDR pulses, when propagated throughout the sensing optical fiber, stimulate the occurrence of Spontaneous Raman Scattering. A spool of standard single-mode fiber, 1.45 km in length, was inserted into the entry point of the system in order to avoid the dead zone of the OTDR. Two 3-port optical circulators (CIRC 1, CIRC 2) compose the feedforward and feedback circuit. The circulators block signals reflected between them, and they direct the backscattered signals back to the OTDR. The backscattered signals are, in turn, filtered by an optical bandpass filter (1400-1480 nm), which is used to separate the anti-Stokes band and to avoid the interference of the amplified spontaneous emission (ASE) in the detected signal. The OTDR curves of the detected signals were stored for processing. The optical fiber sensor link was composed by three spools of standard single-mode fiber (Fiber-1, Fiber-2 and Fiber-3) with lengths of 24.6398 km, 0.6269 km and 1.8897 km, and attenuation coefficients at 1550 nm of ~ 0.19 dB/km. The Fiber-2 spool (0.6269 km) was inserted in a muffle furnace of controlled temperature (FURNACE). The values of Fiber-1 and Fiber-3 lengths varied throughout the measurements and they are kept at room temperature. The operation of the sensor was experimentally evaluated within the temperature range of 30 ºC to 100 ºC.
The combination of a commercial OTDR and a standard EDFA, in the proposed scheme, was considered to be advantageous, since both consist in compact systems, and the EDFA is a lower cost and lower power consumption solution, compared to other types of amplifiers. Besides, the utilization of a commercial OTDR in the R-DTS presents practical advantages, as it allows for the configuration of the emitting/detecting system for a variety of parameters and the analysis of the sensor’s important aspects, namely sensitivity and range, as a function of these parameters. Based on this, the R-DTS of Fig. 1 was tested for OTDR pulses of different widths with the aim of enabling a sensor sensitivity analysis for different heated regions along the fiber. To accomplish such goal, we made use of pulses with temporal widths ranging from 100 ns to 4000 ns. Table I shows the information on the temporal width of OTDR pulses used in some R-DTS systems reported in the literature. We observe that the results found in the literature are for pulse widths ranging from 10 to 100 ns.
TABLE I.TEMPORAL PULSE WIDTH (ΔT) IN R-DTS SYSTEMS EMPLOYED BY SOME AUTHORS
Reference Δt (ns)
Dakin et al., (1985) [12] 15 Hartog et al.,(1985) [13] 40 Park et al., (2006) [14] 100 Blognini et al., (2007) [10] 100 Signorini et al., (2010) [15] 10
Brazilian Microwave and Optoelectronics Society-SBMO received 28 Sept 2018; for review 6 Nov 2018; accepted 20 Nov 2018
Brazilian Society of Electromagnetism-SBMag © 2018 SBMO/SBMag ISSN 2179-1074
III. THEORETICAL MODEL FOR DISTRIBUTED TEMPERATURE SENSOR
This section reviews a theoretical model for a Raman-based distributed fiber-optic temperature sensor [18]. The Bose-Einstein distributions for the Stokes (S) and anti-Stokes (AS) modes are given by the equations
1 1 S E kT e (1) and 1 E kT AS E kT e e
, (2)
where k is Boltzmann’s constant, T is the temperature throughout the optical fiber, ΔE=hΔυ is the difference between the energy levels of the initial and final states [19], typically 50 meV for SiO2
[18], h is Planck’s constant and Δυ is the frequency shift of the Stokes and anti-Stokes modes. From equations (1) and (2), the dependence of both modes on the temperature is noteworthy [19].
The backscattered optical powers associated with the Stokes and anti-Stokes modes are described by
( 0 )
0
( ) P PS z
S S S
P z P ze (3)
and
( 0 )
0
( ) P PAS z
AS AS AS
P z P ze , (4)
where P0 is the pumping power, ρS and ρAS are the Bose-Einstein distributions for the Stokes and
anti-Stokes modes, respectively, ΓS and ΓAS are the capture coefficients of the Stokes and anti-Stokes
modes, respectively, αP0 is the attenuation coefficient of the optical fiber in the pumping wavelength,
αPS and αPAS are the attenuation coefficients of the Stokes and anti-Stokes propagation modes,
respectively [19], z is the variable associated with the distance along the optical fiber. Δz=cΔt/n is the spatial resolution, which depends of the pulse width Δt, the speed of light c and the refractive index of the nucleus of the fiber n [19]. Table II presents the values of the parameters involved in the model.
Based on the set of equations presented (1)-(4), we implemented, in Matlab©, the model for the
Brazilian Microwave and Optoelectronics Society-SBMO received 28 Sept 2018; for review 6 Nov 2018; accepted 20 Nov 2018
Brazilian Society of Electromagnetism-SBMag © 2018 SBMO/SBMag ISSN 2179-1074
TABLE II.PARAMETERS VALUES FOR THEORETICAL MODEL [19].
Parameter Value Unit
αP0 0.2 dB/km
αPS 0.25 dB/km
αPAS 0.22 dB/km
ΓS 3.04x10⁻¹⁰ m-1
ΓAS 4x10⁻¹⁰ m-1
P0 150 mW
c 3x10⁸ m/s
Δt 100 ns
n 1.4443 -
IV. RESULTS
The temperature values were obtained based on measurements of OTDR traces from the sensor link using a commercial OTDR along with an EDFA for six different conditions, which combine the width of the emitted pulses and the analyzed region under heating. The backscattered anti-Stokes signals were measure in two different temperature situations: in the first one, all fiber spools were kept at room temperature; in the second situation, the Fiber-2 spool underwent controlled heating at different temperatures (up to 100 °C) by means of a muffle furnace (see Fig. 1). The heating temperature was monitored by a thermostat in the interior of the muffle furnace heating chamber. The OTDR equipment provides light intensity curves of the backscattered anti-Stokes signals as a function of the distance in fiber, for different temperatures.
The temperature profile of the distributed detection system could be obtained solely from the anti-Stokes traces by means of the calibration of the system with a known temperature, a reference measurement and data processing. Using the previously configured OTDR, we obtained intensity curves with 7.5 min of measurement averages in the OTDR equipment, which amounts to up to 419 traces, the density of 25001 data points for different temperature values adjusted in the furnace, always ranging from 30 °C to 100 °C.
Brazilian Microwave and Optoelectronics Society-SBMO received 28 Sept 2018; for review 6 Nov 2018; accepted 20 Nov 2018
Brazilian Society of Electromagnetism-SBMag © 2018 SBMO/SBMag ISSN 2179-1074
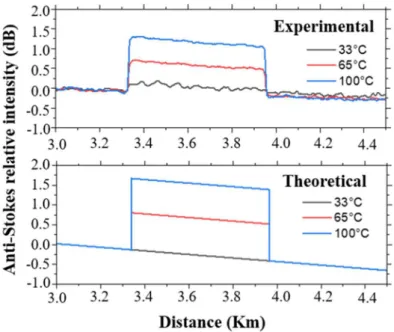
Fig. 3 shows the intensity curves for the backscattered Raman anti-Stokes signal as a function of the distance, measured experimentally and obtained by means of the theoretical model, in the same conditions as those of Fig. 2 (a), for heating temperatures of 33 °C, 65 ºC and 100 °C. These results show that, in the heating region, the intensity of the theoretically obtained signals differ only slightly from those obtained experimentally. This small difference in intensity is due to the limitations of the theoretical model, as it does not take into account additional signal losses and noise, neither the amplification of the signal carried out in the experimental step. For this reason, the theoretical curves undergo an adjustment of 1.37 dB. In spite of this, the theoretical and experimental results present a considerable degree of equivalence.
The spatial distribution of temperature (the temperature along the fiber) was determined by means of system calibration lines, i.e., lines from which the temperature value can be determined from the intensity of the measured signal. These lines are determined by the linear fitting of the points obtained experimentally. In this process, the fitting of the points obtained experimentally with calibration curves gives the accuracy of the measurement, which was above 98% for OTDR pulses of 100 ns and 4000 ns.
Brazilian Microwave and Optoelectronics Society-SBMO received 28 Sept 2018; for review 6 Nov 2018; accepted 20 Nov 2018
Brazilian Society of Electromagnetism-SBMag © 2018 SBMO/SBMag ISSN 2179-1074
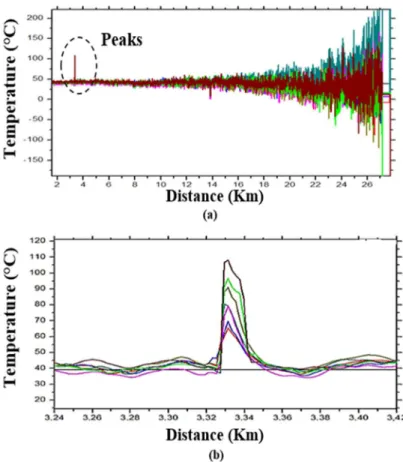
The spatial distribution of temperatures for the results of Fig. 2 are illustrated in Fig. 4. Fig. 4 (a) and (b) show the temperature curves as a function of the distance for pulses of 100 ns for different temperatures. In this case, it is possible to detect temperature fluctuations in the heated fiber spool
(Fibra-2) at the mark 3.4 km with a resolution of 5 °C and average precision of 2 °C.
Fig. 3. Intensity curves of the backscattered Raman anti-Stokes signal for 627 m of optical fiber heated at the mark of 3,4 km of the sensor link, obtained experimentally and from the theoretical modeling.
Brazilian Microwave and Optoelectronics Society-SBMO received 28 Sept 2018; for review 6 Nov 2018; accepted 20 Nov 2018
Brazilian Society of Electromagnetism-SBMag © 2018 SBMO/SBMag ISSN 2179-1074
Fig 4. (a) also allows the conclusion that the range of the sensor is limited by the distance of approximately 15 km, in this case. For longer distances, the curves are too noisy and less practical for the identification of small variations in temperature. The effect of the increase in pulse width can be visualized in Fig. 4 (c) and (d). It is evident from Fig. 4 (c) that the temperature distribution obtained using pulses of 4000 ns results in an increase in the distance of measurement by about 12 km in comparison to the same system operating at the pulse width of 100 ns. When 4000 ns pulses were employed, we obtained a temperature resolution of 5 °C and average precision of 5 °C. This means that, even though the temperature measurement was more accurate when using pulses of 100 ns, the operation of the sensor for such pulse width renders unviable the detection of temperature in the final kilometers of the sensor link. On the other hand, remote regions can be monitored by making use of 4000 ns pulses.
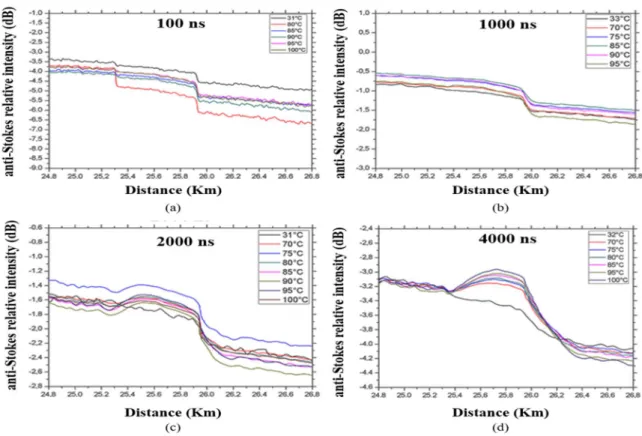
We also evaluated the sensitivity of the sensor in a heating region located near the end of the sensor link, at about 26 km mark. For such, the position of the Fiber-2 spool composing the sensor link was altered so that we could maintain the same length of the fiber under temperature variations. In this scenario, Fiber-2 was allocated at the 25.4 km mark. Maintaining the same measurement protocol, the intensity of the backscattered Raman anti-Stokes signals was measured for four different pulse width values: 100, 1000, 2000 and 4000 ns. The experimental results of the intensity curves for the anti-Stokes signal throughout the length of the optical link for pulses of width between 100 and 4000 ns are presented in Fig. 5.
Brazilian Microwave and Optoelectronics Society-SBMO received 28 Sept 2018; for review 6 Nov 2018; accepted 20 Nov 2018
Brazilian Society of Electromagnetism-SBMag © 2018 SBMO/SBMag ISSN 2179-1074
Fig. 5 (a) shows that it was not possible to identify consistent variations in the anti-Stokes signal intensity in relation to the heating of Fiber-2 at the position of 25.4 km, as the sensor has an extremely low sensitivity for this configuration (~ 10-5 dB/°C). A similar result was obtained when pulses of
1000 ns were used, as shown in Fig. 5 (b), inhibiting the measurement of different temperatures. The increase in the intensity of the anti-Stokes signal was detectable when OTDR pulses of 2000 ns were emitted, as Fig. 5 (c) illustrates. Although changes in the form of the OTDR curves could be identified for the anti-Stokes signal, the increase in the intensity of the signal as a function of the temperature was insufficient to adequately distinguish variations of 70 °C in temperature. The OTDR curves for the backscattered anti-Stokes signal measured for pulses of 4000 ns are presented in Fig. 5 (d). In this case, the obtained curves for temperature variations ranging from 32 °C to 95 °C could be resolved with steps of 10 °C in temperature.
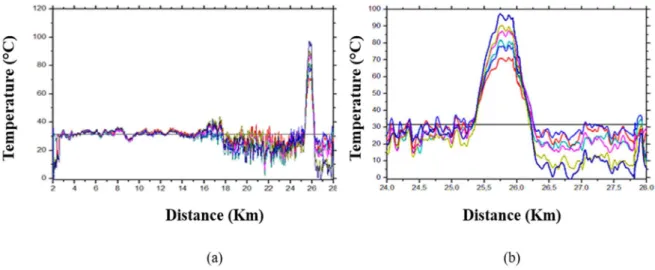
The spatial distributions of the measured temperatures, for the Fiber-2 spool placed at the 25.4 km mark, using 4000 ns OTDR pulses, are presented in Fig. 6. This result demonstrates the operation of the sensor towards the end section of the sensor link with temperature resolution of 10 °C and sensitivity of 0.0075 dB/°C @ 4000 ns. The effect caused by the increase in pulse can also be observed in the extension of the measurement range. Fig. 6 (a) shows the range improvement of 12 km, when compared to the results obtained using OTDR pulses of 100 ns (Fig. 4 a), enabling, for example, the detection of temperature variation at the distance of 26 km.
The sensor has also been evaluated for temperature variations in a fiber of reduced length. In this scenario, 2 m of SMF fiber were inserted into the controlled-heat chamber (FURNACE), at the position of the Fiber-2, and subjected to temperature variations ranging from 34 °C to 100 °C. At the Fiber-1 and Fiber-3 positions, the spools with 1.88 km and 24.4 km of optical fiber, respectively, were maintained. Fig. 7 shows the OTDR curves of relative intensity of the backscattered Raman anti- Stokes signal as a function of the distance in the sensor link for 100 ns pulses, maintaining the
Brazilian Microwave and Optoelectronics Society-SBMO received 28 Sept 2018; for review 6 Nov 2018; accepted 20 Nov 2018
Brazilian Society of Electromagnetism-SBMag © 2018 SBMO/SBMag ISSN 2179-1074
FIBER-2 spool, now 2 meters long, at the position of 3.4 km under varying temperatures. The curves depicted in Fig. 7 evidence that it is possible to identify intensity variations in the optical signal caused by temperature fluctuations at such small fiber length. Under these circumstances, 10 °C variations were identified in the heated fiber, with an average increase of 0.17 dB in the intensity of the measured anti-Stokes signal. This result evaluates the limitations of the sensor’s spatial resolution, and presents an analysis of its performance under such conditions, since the performance is analyzed near the OTDR spatial resolution, which is of 1 m.
The measured spatial distribution of temperatures, for the 2m fiber spool placed at the 3.4 km mark in the sensor link, with 100 ns OTDR pulses, are presented in Fig. 8. These results show the operation of the sensor with temperature resolution of 10°C and sensitivity of 0.0092 dB/°C @ 100 ns. Even though the sensor sensitivity has been reduced as a result of the shorter length of fiber under heat, in comparison with the same system with longer spatial heat region (see Fig. 4-(a)), the results indicate that sensor range did not change, remaining at approximately 15 km.
The parameters of the calibration lines provide quantitative information on sensor sensitivity for the tested configurations (combinations of OTDR pulse width and detection region). The analysis of these parameters allows for the conclusion that sensor sensitivity is higher when the OTDR operates with narrower pulse widths, in order to detect temperature variations in the first kilometers of the optical sensor link, and with better temperature resolution. On the other hand, when there are temperature fluctuations towards the end sections of the sensor link, the use of wider OTDR pulses result in higher
Brazilian Microwave and Optoelectronics Society-SBMO received 28 Sept 2018; for review 6 Nov 2018; accepted 20 Nov 2018
Brazilian Society of Electromagnetism-SBMag © 2018 SBMO/SBMag ISSN 2179-1074
sensitivity in the monitored region and smaller temperature resolution. The increase in sensitivity towards the final kilometers of the sensor link translates into an increase in sensor operating range.
Fig. 9 shows the intensity of the anti-Stokes signal obtained by means of the theoretical model and the experimental setup, as a function of the heating temperature of Fiber-2 at the distance of 3.75 km employing OTDR pulses of 100 ns. The points obtained via theoretical model illustrate the possibility of measurement with the sensor at higher temperatures (above 100 °C) and lower temperatures (below 0 °C) than in the experiments produced here. In this case, sensor sensitivity is of 0.02685 dB/°C, a value not far from that obtained experimentally (0.0169 dB/°C). Again, the discrepancy between these values are due to the simplicity of the theoretical model. Observe that, at the temperature range measured experimentally (33 – 100 °C), both the experimental and theoretical points feature linear behavior, which makes it possible to carry out an appropriate calibration of the system by a linear fitting. This would not be possible for a higher temperature range, as the theoretical points show. With that being said, the theoretical model is of interest, since it allows for an evaluation of the sensor under various perspectives and larger operating range. A summary of these results is shown on Table III.
Brazilian Microwave and Optoelectronics Society-SBMO received 28 Sept 2018; for review 6 Nov 2018; accepted 20 Nov 2018
Brazilian Society of Electromagnetism-SBMag © 2018 SBMO/SBMag ISSN 2179-1074
TABLE III.RESULTS SUMMARY
Fiber-2 Position Fiber-2 length Pulse width Sensitivity Temperature
Resolution Accuracy
[km] [m] [ns] [dB/°C] [°C] [%]
3.4 627 100 0.0169 5 99.8
3.4 627 100 0.02685* - -
3.4 627 4000 0.0134 5 98.4
25.4 627 4000 0.0075 10 99.4
25.4 627 2000 0.0002 - 4.0
25.4 627 1000 0.0001 - 3.3
25.4 627 100 0.00001 - 12.0
3.4 2 100 0.0092 10 93.3
*theoretical
V. CONCLUSIONS
We presented the operation of a spontaneous Raman backscattering-based distributed fiber-optic temperature sensor (R-DTS) with a commercial OTDR and a standard EDFA, along with a theoretical model for the same sensor. We offered an innovative analysis of the sensor’s sensitivity for seven different configurations, which combine 100 ns to 4000 ns OTDR pulses and different heating regions in a 27 km optical fiber link. The experimental results showed that sensor sensitivity depends on OTDR pulse width for different detection regions. In practice, the R-DTS may operate with two
-20 0 20 40 60 80 100 120 140 160 180 200 220 -2 -1 0 1 2 3 4 Experimental Theoretical R el at iv e In te ns ity An ti-St oke s (d B) Temperature (°C)
Brazilian Microwave and Optoelectronics Society-SBMO received 28 Sept 2018; for review 6 Nov 2018; accepted 20 Nov 2018
Brazilian Society of Electromagnetism-SBMag © 2018 SBMO/SBMag ISSN 2179-1074
pulse width values, using 100 ns pulses to detect temperature variations at the starting sections of the link, and 4000 ns pulses to monitor temperature towards the end portion of the link, with temperature resolutions of 5 °C and 10 °C, respectively.
ACKNOWLEDGMENT
The authors thank CNPq, CAPES, FACEPE and the PPGEE of UFPE for the financial support.
REFERENCES
[1] G. Bolognini, and A. Hartog, “Raman-Based Fiber Sensors: Trends and Applications.” Optical Fiber Technology,
Elsevier, v. 19, n. 6, pp. 678–688, 2013.
[2] E. Udd and W. B. Spillman-Jr, Fiber Optic Sensors: An Introduction for Engineers and Scientists. John Wiley & Sons, 2011.
[3] P. Jonghan, et al., ‘‘Raman-based distributed temperature sensor with simplex coding and link optimization.’’ IEEE Photonics Technology Letters, v.18, n.17, pp. 1879-1881, 2006.
[4] J. Haus, Optical Sensors: Basics and Applications. Wiley Online Library, John Wiley & Sons, 2010.
[5] F. Bassan et al, “Raman-Based Distributed Temperature Sensor Using Simplex Code and Gain Controlled Edfa”. in: International Society for Optics and Photonics. 24th International Conference on Optical Fiber Sensors, v. 9634, pp. 96346, 2015.
[6] G. Bolognini, J. Park, P. Kim, D. Lee, F. Di Pasquale, and N. Park, “Performance Enhancement of Raman-Based Distributed Temperature Sensors Using Simplex Codes”. In: IEEE. Optical Fiber Communication Conference, 2006
and the 2006 National Fiber Optic Engineers Conference. OFC 2006, pp. 3, 2006.
[7] M. Soto et al. “Distributed Temperature Sensor System Based on Raman Scattering Using Correlation-Codes.”
Electronics Letters, IET, v. 43, n. 16, pp. 862–864, 2007.
[8] F. Baronti et al., “Snr Enhancement of Raman-Based Long-Range Distributed Temperature Sensors Using Cyclic Simplex Codes.” Electronics letters, IET, v. 46, n. 17, pp. 1221–1223, 2010.
[9] M. Tanner, S. Dyer, B. Baek, R. Hadfield, and S. Woo Nam, “High-Resolution Single-Mode Fiber-Optic Distributed Raman Sensor for Absolute Temperature Measurement Using Superconducting Nanowire Single-Photon Detectors.”
Applied Physics Letters, AIP, v. 99, n. 20, pp. 201110, 2011.
[10]G. Bolognini, J. Park, M. Soto, N. Park, and F. Di Pasquale, “Analysis of Distributed Temperature Sensing Based on Raman Scattering Using Otdr Coding and Discrete Raman Amplification.” Measurement Science and Technology, IOP
Publishing, v. 18, n. 10, pp. 3211, 2007.
[11]F. Bassan, F. Salgado, F. Fruett, and J. Rosolem, “Distributed Temperature Sensing System Using a Commercial OTDR and a Standard EDFA With Controlled Gain”. in: International Society For Optics And Photonics. Fiber Optic
Sensors and Applications XIII. v. 9852, pp. 98520S, 2016.
[12]J. Dakin, D. Pratt, G. Bibby, and J. Rose, “Distributed Antistokes Ratio Thermometry”. in: Optical Society of America.
Optical Fiber Sensors. a. p. PDS3, 1985.
[13]A. Hartog, A. Leach, and M, Gold, “Distributed Temperature Sensing in Solid-Core Fibre”. Electronics letters, IET, v. 21, n. 23, pp. 1061–1062, 1985.
[14] J. Park, G. Bolognini, D. Lee, P. Kim, P. Cho, F. Di Pasquale, and N. Park, “Raman-Based Distributed Temperature Sensor with Simplex Coding and Link Optimization”. IEEE photonics technology letters, IEEE, v. 18, n. 17, pp. 1879– 1881, 2006.
[15]A. Signorini et al., “40 km long-range Raman-based distributed temperature sensor with meter-scale spatial resolution.”
In: Optical Fiber Communication (OFC), Collocated National Fiber Optic Engineers Conference, 2010 Conference on
(OFC/NFOEC). IEEE, pp. 1-3, 2010.
[16]D. Hwang, D. Yoon, I. Kwon, D. Seo, and Y. Chung, “Novel Auto-Correction Method in a Fiber-Optic Distributed-Temperature Sensor Using Reflected Anti-Stokes Raman Scattering.” Optics express, v. 18, n. 10, pp. 9747-9754, 2010. [17]M. Soto et al., “Raman-based distributed temperature sensor with 1 m spatial resolution over 26 km SMF using
low-repetition-rate cyclic pulse coding.” Optics letters, v. 36, n. 13, pp. 2557-2559, 2011.
[18]I. S. M. Shatarah, R. Olbrycht and B. Wiecek. Modeling of Spontaneous Raman Scattering in silica light guides for Distributed Temperature Sensing. In: 14th Quantitative InfraRed Thermography Conference. Berlin, Germany, 2018. [19]M. A. Farahani and T. Gogolla. ‘‘Spontaneous Raman scattering in optical fibers with modulated probe light for