André Eduardo Carneiro Dias
Versatile route to approach nanoscale
protein multiplexing
Andr é Eduar do Carneir o Dias V ersatile route to approach nanoscale protein multiple
Universidade do Minho
André Eduardo Carneiro Dias
Dissertação de Mestrado
Mestrado em Biofísica e Bionanossistemas
Versatile route to approach nanoscale
protein multiplexing
Universidade do Minho
Escola de Ciências
Trabalho realizado sob a orientação da
Doutora Karen L. Martinez
e do
Acknowledgements
First of all, I would like to thank my parents, without whom I would never have the chance to embark on this adventure that has been my master degree and my stay in Denmark.
I would like to thank my supervisor, Dr. Karen L. Martinez from the University of Copenhagen for giving me the chance to work in her research group and for all the pieces of advice that have contributed for the completion of this thesis.
For all the help and scientific knowledge provided during this research project, I would like to thank Eduardo Della Pia. Thanks for the patience, all the pieces of advice, all the time spent teaching me and, most of all, for being a great friend.
To everyone in the research group for the good moments spent together and for all the support given me, thank you. It was a great pleasure knowing and working with all of you.
I would also like to thank my co-supervisor, Dr. Paulo Coutinho, for his availability whenever I needed.
To all my friends, thank you for helping me stay true to myself and for all the relaxation moments.
Finally, I would like to thank the International Relations Office for granting me the Erasmus scholarship that allowed me to do the research work leading to this thesis in the Nano-Science Center of the University of Copenhagen.
Abstract
On the last decade protein arrays have earned a highlight place in drug discovery or to study protein-protein interaction. The miniaturization of such systems and the ability to study interactions with several proteins at the same time has been proven invaluable in these fields.
More recently, with the inclusion of protein arrays in microfluidic devices, these platforms have also been used in biosensing or bioanalytics. However, despite the fundamental breakthroughs that have been made in the development of such devices, there still is a need to develop new strategies which allow the reduction of the amount of protein used, the reduction of the area on which the proteins are immobilized and the immobilization of multiple proteins using soft conditions.
This thesis reports two different approaches to immobilize proteins: by coordination of polyhistidine-tag to Ni-NTA motifs on the surface of polystyrene microparticles and by directing proteins onto the surface of a conductive polymer, polypirrole, by applying an electric field.
H6-EGFP and SNAP-Flag-His10 were expressed in E. coli and purified using
immobilized metal affinity chromatography and size exclusion chromatography.
The binding of H6-EGFP onto polystyrene microparticles covered with Ni-NTA
motifs is analyzed by fluorescence spectroscopy and fluorescence microscopy. It is also shown how immobilization of functionalized particles can be used for the creation of inexpensive protein microarrays.
The second approach described shows how the sequential electrogeneration of polypyrrole films can be used to immobilize different proteins on distinct electrodes of a single array. It is also shown how the use of an electric field may enhance the adsorption of the proteins onto the polypyrrole film.
Sumário
Na última década, arrays de proteínas ganharam um lugar de destaque na descoberta de fármacos ou no estudo de interações proteína-proteína. A miniaturização destes sistemas e a capacidade de estudar interações com várias proteínas ao mesmo tempo provou ser importantíssimo nestas áreas.
Mais recentemente, com a aplicação de arrays de proteínas em dispositivos microfluidicos, estas plataformas também foram usadas como biosensores ou em bioanalitica. No entanto, e apesar dos avanços fundamentais no desenvolvimento de tais dispositivos, ainda existe a necessidade de desenvolver novas estratégias que permitam reduzir a quantidade de proteína usada, reduzir a área sobre a qual as proteínas são imobilizadas e a imobilização de várias proteínas usando condições suaves.
Esta tese relata duas estratégias de imobilização de proteínas diferentes: por coordenação de sequências de poli-histidina com motivos Ni-NTA na superfície de microparticulas de poliestireno e por direcionamento de proteínas para a superfície de um polímero condutor, polipirrole, por aplicação de um campo eléctrico.
H6-EGFP e SNAP-Flag-His10 foram expressas em E. Coli e purificadas por
cromatografia de afinidade com metal imobilizado e cromatografia por exclusão de tamanho.
A adsorção de H6-EGFP à superfície de micropartículas de poliestireno cobertas
com motivos Ni-NTA é analisada por spectroscopia de fluorescência e por microscopia de fluorescência. Também se mostra como a immobilização de partículas funcionalizadas pode ser usada para a creação de microarrays de proteínas economicamente acessiveis.
A segunda estratégia descrita mostra a como electrogeração sequencial de filmes de polipirrole pode ser usada para immobilizar diferentes proteínas em eletrodos distintos dum único array. É também mostrado como o uso de um campo eléctrico pode aumentar a adsorção de proteínas à superfície do filme de polipirrole.
Table of contents
Chapter 1. Introduction ... page 1 1.1. Protein arrays ... page 3 1.2. Fabrication methods. ... page 4 1.3. Surface modification ... page 5 1.4. Outline ... page 7
Chapter 2. Molecular Biology ... page 9 2.1. Introduction ... page 11 2.1.1. Aim of the project ... page 11 2.1.2. Enhanced Green Fluorescent Protein ... page 11 2.1.3. SNAP-tag ... page 13 2.2. Material and Methods ... page 14 2.2.1. H6-EGFP expression ... page 14
2.2.2. H6-EGFP purification ... page 14
2.2.3. SFH10 expression ... page 15
2.2.4. SFH10 purification ... page 15
2.2.5. Labelling of the SNAP-Tag ... page 16 2.2.6. Cleavage of the His-tag ... page 16 2.2.7. BCA assays ... page 17 2.2.8. SDS-PAGE gels ... page 17 2.2.9. Fluorescence spectra ... page 17 2.3. Results and Discussion ... page 19 2.3.1. Expression and purification of H6-EGFP ... page 19
2.3.2. Expression, purification and labelling of SFH10 ... page 22
2.3.3. Cleavage of the his-tag from SFH10 ... page 24
Chapter 3. Analysis of protein binding on polystyrene microparticles ... page 29 3.1. Introduction ... page 31 3.1.1. Aim of the project ... page 31 3.1.2. Polystyrene microspheres ... page 31 3.1.3. Nitriloacetate complexes ... page 32 3.2. Materials and methods ... page 34 3.2.1. Functionalization of polystyrene microparticles in solution ... page 34 3.2.2. Immobilization of polystyrene microparticles on a glass surface page 34 3.2.3. Absorbance spectra ... page 35 3.2.4. Fluorescence spectra ... page 35 3.2.5. Fluorescence microscopy ... page 35 3.3. Results and discussion ... page 36 3.3.1. Analysis of polystyrene microscopy by fluorescence spectroscopy ... page 36 3.3.2. Analysis of polystyrene microparticles by fluorescence microscopy ... page 39 3.3.3. Immobilization of functionalized polystyrene microparticles on a glass surface ... page 44 3.4. Conclusion ... page 46
Chapter 4. Directed protein immobilization: approaching nanoscale protein multiplexing ... page 47
4.1. Introduction ... page 49 4.1.1. Aim of the project ... page 49 4.1.2. Conducting polymers ... page 49 4.1.3. Ion migration within an electric field ... page 50
4.2.4. Functionalization of the electrodes ... page 53 4.2.5. Fluorescence Microscopy ... page 53 4.3. Results and discussion ... page 54 4.4. Conclusion ... page 62 Chapter 5. Summary and Perspectives ... page 63 References ... page 67 Annexes ... page 73
Abbreviations
AFM ... atomic force microscope BG ... O6-benzylguanine
DNA ... deoxyribonucleic acid DOL ... degree of labeling DPN ... dip-pen nanolithography EDTA ... ethylenediaminetetraacetate
EGFP ... enhanced green fluorescent protein FPLC ... fast performance liquid chromatography GFP ... green fluorescent protein
H6-EGFP ... EGFP containing an hexahistidine tag on its N-Terminus
hAGT ... Human O6-alkylguanine-DNA alkyltransferase IMAC ... immobilized metal affinity chromatography IPTG ... Isopropyl β-D-1-thiogalactopyranoside Ni-NTA ... nickel nitriloacetate
NiNTA-PPsMPs ... polystyrene microparticles covered with Ni-NTA. NTA ... nitriloacetate
ODx ... absorbance at ―x‖ nm
PBS ... phosphate buffer saline
PMSF ... phenylmethanesulfonylfluoride PPy ... polypyrrole
SEC ... size exclusion chromatography SFH10 ... SNAP-Flag-His10
SPR ... Surface Plasmon Resonance
SFH10-647 ... SFH10 labeled with SNAP-Surface® 647
______________ Chapter 1.
This master thesis deals with the immobilization of proteins on surfaces. Proteins are major biological components, being involved in many regulatory processes. While many approaches have been used to study these molecules, current techniques for protein immobilization are time consuming and require a lot of effort and material. It is important to develop new approaches to solve these problems.
Micro-/nanotechnology have provided an alternative. By immobilizing proteins on surfaces, we can more easily detect any changes occurring on the protein[1-2]. Especially when miniaturizing the surface area covered by proteins, any changes to the existing protein layer may translate in a big change in the system’s properties.
Here, I describe two different approaches that can be used to immobilize proteins on surfaces. The first one revolves around the use of a histidine-tag (his-tag) to immobilize proteins on polystyrene microspheres and the analysis of this system.
The second approach reports the sequential generation and functionalization of a polymer film, a polypyrrole (PPy) film, to immobilize different proteins on different micro-/nanoelectrodes of a single array. Additionally, it is also reported the use of an electric field to enhance protein adsorption on the polymer film.
1.1. Protein arrays
In the last few years, protein microarrays have had a deep impact on protein assays. These setups have allowed a high throughput parallel screening of biomarkers, protein-protein and protein-drug interactions, being used primarily in areas as drug discovery or diagnostics[1, 3-6].
Nonetheless the dissemination of protein arrays has not been as expressive as deoxyribonucleic acid (DNA) arrays. Unlike DNA, proteins are very sensitive and chemical treatment of the surface often results in protein denaturation[1,7]. In fact, the complexity of the fabrication of protein arrays has hindered their introduction in the marketplace.
More recently, biotechnological fields as bioanalytics, biocatalysis or biosensors have acted as a driving force for the development of protein biochips. Most protein microarrays use fluorescence detection due to the availability of fluorophores as well as the wide range of properties assessable, however label-free techniques, such as surface plasmon resonance or bioelectroanalytical techniques, have been rising as an alternative[1,8,9].
Miniaturization has also played an important role on the development of protein biochips. The transition from microarrays to nanoarrays allows the reduction of
number of measurements that can be performed with on a single chip and, thus, the statistical significance of the parameters determined[1,2]. Moreover, in principle, at such small features, the binding of a single molecule to the surface is translated into a large variation of the surface’s properties, improving the sensitivity of the assay and its detection limit.
Many techniques have been developed to allow highly controllable nanopatterning of proteins, however very few reports have shown multiple proteins patterned on nanoarrays so far. One other stepback of protein arrays in contrast with DNA arrays is the background signal[2,7]. DNA has a net negative charge, due the phosphate bridges linking the constitutive nucleotide, and its interaction with surfaces is promoted primarily by electrostatic interactions of these groups. By coating the surface with a negatively charged layer, it is possible to prevent the adsorption of DNA due to the electrostatic repulsion between the two. Proteins have both positive and negatively charged domains, hydrophobic and hydrophilic pockets and, as their interaction with surfaces is controlled by different forces, more complex strategies are required to decrease the background signal.
1.2. Fabrication methods
Most fabrication methods have been thoroughly described in many excellent reviews[2,10,11]. The aim of this chapter is to give a short overview of the characteristics of different fabrication methods while providing some insight in the most prominent techniques.
Most reports of protein micro-/nanoarrays use techniques such as microcontact printing, soft lithography or UV lithography. These techniques allow to pattern surfaces with nanometer sized features in a fast and highly reproducible manner through the use of a mask[2,7,11]. Electron beam lithography also has a prominent place in nanofabrication as it allows a resolution as low as 2 nm when patterning inorganic resists[12]. Nonetheless, the fabrication method is very slow, being used mostly in order to produce masks to be applied on other techniques. A major setback of these techniques is that the whole surface must be covered with solution, allowing proteins to be immobilized on all the patterned regions.
meaning that the sequential immobilization of large proteins or patterning of large areas may take a lot of time. To circumvent the low throughput of the technique, cantilever arrays have been used in order to pattern proteins in a highly parallel manner. Despite DPN showing great promise in the patterning of small molecules, there are other factors which must be considered when patterning proteins. First, the protein ―ink‖ used to functionalize the surface usually contains a carrier or a surfactant. This surfactant is used to prevent protein adsorption to the AFM tip and to increase the transfer speed of the molecule to the surface, however it might also result in reducing the adsorption to the surface. Also, if successive immobilization steps are performed, the conditions required may lead to the loss of conformation and, thus, to a loss of function.
1.3. Surface modification
The chemical and physical properties of the surface influence specific and non-specific binding of the proteins to the surface. It is, therefore, of vital importance to tune these properties in order to optimize the performance of a protein array.
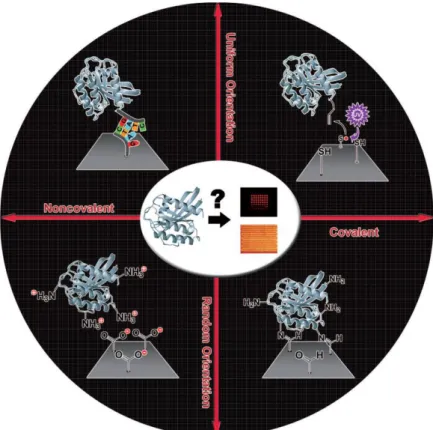
Protein adsorption can be classified according to the covalent character of the bond and the proteins orientation (figure 1)[7].
Figure 1. Schematic representation of the classification of protein adsorption strategies.
As mentioned above, proteins interact with a surface by ionic bonds, Van Der Waals forces and electrostatic, hydrophobic or polar interactions. Which intermolecular force dominates the interaction depends on the protein and surface involved. Random physisorption still represents one of the most common immobilization strategies, especially when functionalizing 3D surfaces (micro/nanoparticles, nanotubes, nanowires, etc). Amine- or carboxyl-modified surfaces are usually used with this strategy[7]. The resulting protein layer is usually heterogeneous and randomly oriented.
Another strategy relying on non-covalent bonds is by using a polymer layer trapping the protein inside its matrix. Hydrogels on gold constitute the most common polymer surface used as they are usually used in Biacore or other similar technologies using surface plasmon resonance (SPR) measurements[16,17].
Gold surfaces can also be functionalized with thiol- or amine-containing molecules by simply exploiting the high affinity of these residues for the gold surfaces. However when in direct contact with the gold, proteins tend to lose their conformation and, therefore, their function[7]. To circumvent this problem, SAMs can be used as an intermediate layer, distancing the protein from the gold surface and even providing the surface with different characteristics.
Amine and carboxyl reactive groups can be used to form covalent bonds. Depending on the coupling reagents these groups target different functional groups[7,18]. As we can usually find amine or carboxyl groups over the proteins’ surface, the resulting protein layer tends to have a random orientation.
By immobilizing proteins with a certain orientation, in principle, we can facilitate interactions with other molecules. Current methods to immobilize proteins with a specific orientation were originally designed for fusion protein purification and adapted to protein arrays. By using a tag on fusion proteins to attach to the surface, one can create a uniformly oriented protein layer[7,19].
Oligonucleotide tagged proteins use the DNA base pairing to specifically bind to the complementary oligonucleotides immobilized on the surface. This strategy shows a high stability and uses the established DNA arrays fabrication methods[7]. One other alternative commonly used is the biotin-tag. Biotin can specifically bind to avidin, streptavidin or neutravidin. Even though this interaction does not result from a covalent bond, the high affinity between both molecules makes this bond nearly irreversible[7,20].
So far, only strategies to bind proteins to a surface have been mentioned. However, it is also important to prevent the unwanted protein immobilization as this may result in high background signal. This can be achieved by selecting the surface used. Naturally occurring surfaces as elastin, agarose, cellulose or polysaccharides or, more commonly, synthetic polymers as polyethyleneglycol heve been shown to prevent protein adsorption to their surface. Alternatively bovine serum albumin (BSA) or milk can be used to block the surface preventing further adsorption from other molecules. The use of surfactants as Tween 20 or sodium dodecyl sulfate (SDS) may also suppress non-specific protein adsorption [7].
1.4. Outline
The work described in this thesis was performed in Karen L. Martinez’s group, at the Bionano and Nanomedicine laboratory of the University of Copenhagen. During my stay in the group, I had the opportunity to work in an international and multidisciplinary environment which, ultimately, has led to the development of this thesis.
Throughout this thesis many different concepts are introduced and they are organized in such a way that allows the reader to understand the scientific importance of the work described.
This short introduction chapter aims at giving a brief overview of the scientific landscape common to the different approaches described in the remaining chapters.
The second chapter of this thesis includes all the experiments within the molecular biology field. The chapter reports the expression and purification of two different proteins that would be used at later stages (chapters 3 and 4). This chapter also reports the characterization of the samples using spectroscopic techniques.
In chapter 3, the immobilization of his-tagged proteins on the surface of polystyrene microspheres (or microparticles) is reported. The particles were analyzed by fluorescence spectroscopy and later by fluorescence microscopy.
The fourth chapter reports the generation of a polypyrrole film on a micro-/nanoelectrode array as a platform to immobilize protein. It is shown how, by sequentially generating different films, one can immobilize different proteins on the same array. This chapter also investigates how the use of electric fields are a promising strategy to enhance protein adsorption. Such a strategy can be used to optimize conditions so it is possible to reduce the amount of protein required.
The final chapter summarizes the results and conclusions obtained in this thesis. Additionally, a perspective on future possibilities and future work required is also
___ Chapter 2.
2.1. Introduction
2.1.1. Aim of the project
The first part of the project involved the expression and purification of model proteins to be used in later experiments (described in chapters 2 and 3). The proteins were selected to satisfy specific criteria related on how they would be used. The proteins are soluble in aqueous solution in order to simplify their handling, they possess fluorescent properties to allow an easy detection by fluorescence spectroscopy or fluorescence microscopy and, as a Ni-NTA motif was used in some of the experiments, the proteins also contain a His-tag either on the N-terminus or the C-terminus.
The first protein selected was an enhanced green fluorescent protein (EGFP) containing an hexahistidine-tag on its N-terminus (H6-EGFP)(the aminoacid sequence
for the protein can be found in annex). This protein respects the previously described properties and some of its other characteristics make it an ideal tool to use as a model protein. The most important of these is the fact that fluorescence emission is dependent on the interaction between the chromophore in its center and the correctly folded EGFP scaffold. Upon fluorescence microscopy analysis, this property allows us to easily assess whether or not the protein retains its structure.
The second model protein selected was the SNAP-Flag-His10 (SFH10). This model
protein is formed by three different tags which have independent properties: the SNAP-tag (in the N-terminus), the Flag-SNAP-tag and a decahistidine-SNAP-tag (in the C-terminus). Even though, by itself, this protein is not fluorescent, it can be easily labelled using the SNAP-tag and its versatility allows it to be used in several different ways[22]. First of all, the SNAP-tag substrate can be selected according to the requirements of the systems. The Flag-tag can be used to bind to an antibody and the His-tag allows the protein to easily bind to Ni-NTA motifs.
2.1.2. Enhanced Green Fluorescent Protein
Green Fluorescent Protein (GFP) from the jellyfifsh Aequorea victoria was first discovered by Osamu Shimonura[23,24]. This 26.9 kDa protein emits green fluorescence upon excitation with blue or ultraviolet light, property that has attracted a lot of attention to its use as a biomarker since it was first expressed in living cells[25,26] and its fluorescent properties have been improved[27,28].
While the wild type GFP (wtGFP) shows low emission upon excitation with blue light (figure 2), the work developed by Tsien et al[28], followed by Cormack et al[29] has led to the creation of a double mutant protein carrying the mutation Ser65→Thr and Phe64→Leu, the EGFP. Comparing to the wtGFP, this mutant is more stable and shows a 5-fold increase upon excitation with blue light.
Figure 2. Excitation and emission spectra of wtGFP (- - -) and the Ser65→Thr mutant (—). Adapted from Tsien et al.
EGFP is an 11-stranded-β-barrel encapsulating a helix which runs up the central axis and upon which the chromophore is inserted[30],. The chromophore (a p-hydroxybenzylideneimidazidone) is, thus, protected from the solvent and rigidified to turn fluorescent (in case the protein is denatured the chromophore shows no fluorescence).
Looking at the absorbance spectrum, the protein shows 3 major absorbance peaks in the UV-vis region: two peaks at 400 nm and 488 nm related with the protonated and deprotonated forms of the chromophore and one peak at 280 nm corresponding to the absorption of the aromatic aminoacids. A further decomposition of the visible region of the spectrum by fitting to Gaussians functions has shown three peaks at 400 nm , 470 nm and 490 nm. The last two correspond to two transitions to different excited states of
2.1.3. SNAP-Tag
While fluorescent proteins can be used to study dynamic processes, protein-protein interactions and even conformational changes, their application is limited by the array of proteins available. Recently, there has been a request for a more versatile approach. An alternative is the selective labeling of fusion proteins.
Human O6-alkylguanine-DNA alkyltransferase (hAGT) has the function of repairing O6-alkylated guanines by transferring this alkyl group to a cysteine residue in its aminoacid chain (figure 3, A). O6-benzylguanine (BG) can also react with hAGT, property which enables its use as an inhibitor for this protein[22,31]. Johnson et al[31] have also shown that BG derivatives can be reacted with hAGT using the same mechanism(figure 3, B). Further optimization of the protein has led to an increase of the hAGT activity and disruption of its interaction with DNA[33]. Furthermore, using this mutant hAGT, Johnson et al[33] have also shown some of its potential as a biomarker.
Figure 3. (A) DNA repair mechanism by hAGT. (B) Labeling mechanism of a X-hAGT fusion
protein using a BG derivate. Adapted from [31].
A mutant hAGT is commercialized by New England BioLabs® Inc. named as SNAP-tag, which can be used to label SNAP-tag fusion proteins. The company also provides a set of BG derivatives, such as SNAP-Vista® Green, a BG labeled with fluorescein, or SNAP-Surface® 647, based on Dynomics Dye DY-647. Alternatively, BG derivates can also be reacted with any molecule of interest in order to provide the BG derivate with the intended properties.
2.2. Materials and methods
2.2.1. H
6-EGFP expression
Expression of H6-EGFP (Addgene) was carried out using E. coli, BL21 (DE3). The
bacteria cells transformed with pUCBB-eGFP were inoculated in 20 mL Luria-Bertani (LB) medium containing 100 µg mL-1 ampicillin and kept at 37 ºC and 250 rpm, overnight. A new culture was then prepared with absorbance at 600 nm (OD600) of 0.1
(OD600 was measured using an Eppendorf® BioPhotometer) and grown at 37 ºC and
250 rpm. Protein expression was induced by adding Isopropyl β-D-1-thiogalactopyranoside (IPTG) up to a final concentration of 0.1 mM at absorbance at 600 nm (OD600) of 0.8. After inducing expression, the cells were grown at 37ºC and 250
rpm for 2 hours.At this point, the bacteria cells were harvested by centrifuging at 2 000 g for 30 min using Eppendorf® centrifuge 5810 R. The pellet was kept frozen at -20ᵒC until further use.
In order to lyse the cells, they were ressuspended in phosphate buffer saline (PBS) (0.138 M NaCl, 0.0027 M KCl, pH 7.4) (Sigma). Then, phenylmethanesulfonylfluoride (PMSF) and Lysozyme were added to a final concentration of 1 mM and 1 mg mL-1, respectively. The cells were then incubated for 30 min, on ice and in the dark and anti-protease cocktail (Thermo Scientific) was added to the solution. The lysate was sonicated for 2 min (10 s bursts with 10 s cooling between). The soluble fraction was then recovered by centrifuging at 14 000g, 4 ºC for 45 min (Eppendorf® centrifuge 5810 R).
2.2.2. H
6-EGFP purification
H6-EGFP was purified from the supernatant by immobilized metal affinity
chromatography (IMAC). For this, a HisTrap column (GE Healthcare) was used on a fast performance liquid chromatography (FPLC) system (Äkta purifier, Amersham Biosciences). The protein was inserted into the column and unwanted proteins were washed away using binding buffer (20 mM sodium phosphate, 500 mM NaCl, 20 mM imidazole, pH=7.4). The remaining protein was eluted with elution buffer (20 mM
Biosciences) and using PBS as medium. The optimized purification protocol (used on the second time I expressed the protein) uses a SEC to purify the protein immediately after purification through IMAC with PBS as medium.
2.2.3. SFH
10expression
To express SFH10, previously cloned E. coli BL21 was streaked out on a LB agar
plate and kept overnight at 37 ºC. It was then inoculated in 15 mL LB containing 150 µg mL-1 ampicillin and incubated overnight, at 37 ºC, 240 rpm.
A new culture was then prepared with starting OD600 of 0.1 in 1.5 L LB containing
150 µg mL-1 ampicillin, 5 µM ZnCl2 and kept at 37 ºC. Upon measuring an OD600 of 0.8,
expression was induced by adding IPTG up to a final concentration of 0.5 mM and the culture was incubated at 30 ºC, 240 rpm for 4 h.
The cells were harvested by centrifuging at 2 000 g for 30 min (Eppendorf® centrifuge 5810 R). They were then stored at -20 ºC until required.
To lyse the cells, they were ressuspended in 50 mM sodium phosphate, 500mM NaCl, 20 mM imidazole, pH 7.4 and PMSF and lysozyme were added to a final concentration of 1mM and 1 mg mL-1, respectively.The mixture was kept on ice for 30 min and anti-protease cocktail (Thermo Scientific) was added.
The lysate was sonicated for 2 min (10 s bursts with 10 s cooling between) and centrifuged at 14 000g for 45 min.at 4ºC (Eppendorf® centrifuge 5810 R) in order to pellet the cellular debris. The supernatant was recovered and kept at -20ºC overnight.
2.2.4. SFH
10purification
SFH10 was purified from the supernatant of the lysate by gradient IMAC. For this,
the protein was inserted into the HisTrap column using the FPLC system (Äkta purifier, Amersham Biosciences) and, immediately after, the gradient was started using only sodium phosphate buffer (20 mM sodium phosphate, 500 mM NaCl, pH 7.4) and increasing the concentration of elution buffer .
After purification through IMAC, the a HiTrap column (GE Healthcare) on the FPLC system was used to exchange the buffer to PBS. For this, the sample was inserted into the column and eluted by using PBS as medium.
2.2.5. Labelling of the SNAP-Tag
The SNAP-Tag from SFH10 was labeled by mixing SFH10 and SNAP-Tag substrate
(either SNAP-Vista® Green or SNAP-Surface® 647, from New England BioLabs, previously dissolved in DMSO) with a 1:2 ratio (fusion protein : substrate) in 50 mM Tris-HCl, 100 mM NaCl, 0.1% Tween 20, 5 mM DTT, pH 7.5. The mixture was kept in the dark, at room temperature, for 60 min. The excess SNAP-Tag substrate was removed using a Bio-Spin® P-30 gel column. Before using the column, it was washed four times with PBS in order to exchange the stock buffer. After removal of the unbound SNAP-Tag substrate, the sample was frozen at -20 ºC until required.
The degree of labeling (DOL) corresponds to the ratio between the amount of fluorophore and fusion protein. This parameter was assessed according to:
where OD647 and OD280 are the absorbance of the labeled proteins at 647 nm and 280
nm, respectively. is the molar extinction coefficient of SFH10 at 280 nm (22585 M-1
cm-1). and are the molar extinction coefficient of SNAP-Surface® 647 at
280 nm and 647 nm, respectively. Absorbance measurements were recorded in a 96-well UV-transparent microplate (Corning) using a Synergy H4 microplate reader (BioTek Instruments).
For SDS-PAGE analysis, the samples were labeled with SNAP-Vista® Green and run on a SDS-PAGE gel immediately after the labeling reaction. To detect the labeled protein in the SDS-PAGE gels a Dark Reader DR89X Transilluminator (Clare Chemical Research) was used before staining.
2.2.6. Cleavage of the His-tag
The His-tag was cleaved from SFH10 by using EKMax™ from Life Technologies™.
Pilot reactions were set up by mixing different concentrations of EKMax™ with 20 µg SFH10 in 50 mM Tris-HCl, 1 mM CaCl2, 0.1% Tween 20 (EKMax™ Reaction Buffer)
To isolate the different components, a SEC was performed using a Superdex 75 (GE Healthcare) column on a FPLC system. PBS was used as a medium and only the fractions correspondent to the protein of interest were kept. After separation, DTT was added to 1 mM to stabilize the protein.
2.2.7. BCA assays
To determine protein concentration, bicinchoninic acid (BCA) assays were performed using a Thermo Scientific Pierce BCA Protein Assay Kit according to the manufacturer’s protocol.
Different concentrations of BSA as well as the samples were allowed to react with the provided reagents in a 96-well UV-transparent microplate (Corning) for 30 min at 37 ºC. Absorbance at 562 nm was read on a Synergy H4 microplate reader (BioTek Instruments).
2.2.8. SDS-PAGE gels
For sodium dodecyl sulfate - polyacrylamide gel electrophoresis (SDS-PAGE) analysis NuPAGE® Bis-Tris precast gels from Life Technologies™ were used.
The samples were prepared by mixing protein sample on a ratio of 6.5:10 (volume of protein : final volume), 4x NuPAGE® LDS Sample Buffer with a ratio 1:4 (NuPAGE® LDS Sample Buffer : final volume), 0.1 M DTT. The samples were then heated at 70ºC for at least 15 min and loaded onto the gel.
The gels were run at 150 V for 50 min using NuPAGE® MES SDS Running Buffer as medium. Afterwards, the gels were stained with SimplyBlue™ SafeStain (Life Technologies™) using the manufacturer’s microwave procedure. They were imaged and analyzed using ImageJ.
2.2.9. Fluorescence spectra
Excitation and emission spectra of H6-EGFP samples were measured on a Spex
FluoroMax-4 spectrofluorometer (HORIBA, Jobin Yvon).
For the emission spectra, samples were excited at 400 nm (slit 3 nm) and emission spectra were monitored between 500 nm and 700 nm (slit 3 nm), with integration time of 0.5 s nm-1 and with an increment of 1 nm. As for the excitation spectra, emission was monitored at 530 nm (slit 3nm) and excitation spectra were monitored between 260
and 510 nm (slit 3 nm), with integration time of 0.5 s nm-1 and with an increment of 1 nm.
2.3. Results and Discussion
2.3.1. Expression and purification of H
6-EGFP
After lysing the bacteria cells and recovering the soluble fraction, the protein needs to be purified. As H6-EGFP contains a His-tag, it can be easily purified by IMAC. By
washing the column with buffer containing 20 mM imidazole, any protein without any affinity for the Ni-NTA motifs is washed away and ideally the only protein remaining would be H6-EGFP. Then, it is possible to elute the protein by washing the column 500
mM imidazole (figure 4). 0 10 20 0 1000 2000 3000 Ab sorbanc e / a.u. Volume / mL Abs280 Fractions collected
Figure 4. Chromatogram of the H6-EGFP elution using IMAC (left) and images of the collected fractions (right).
The first time I used this protocol, absorbance was monitored only at 280 nm. This wavelength is where aromatic aminoacids absorb light at, so it is usually used to detect any protein. In the case of H6-EGFP, however, besides monitoring only this
wavelength, it should also be monitored absorbance at 488 nm, as this corresponds to the absorbance peak of the protein.
As the only information available from the chromatogram corresponds to the total protein concentration, it is expectable for the H6-EGFP to correspond to the elution
peak at 10 mL. This assumption was complemented by a visual control. As the protein emits green light, only the fractions which have a green color contain the protein (figure 4, right).
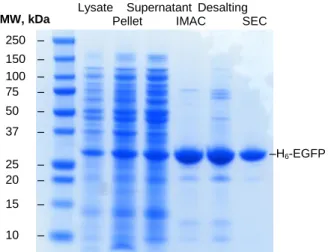
SDS-PAGE (figure 5) and ImageJ analysis at this point shows protein purity of 68.7 %. The presence of two extra bands after the desalting step can be explained by an upconcentration of the sample during this stage.
Figure 5. SDS-Page gel of the different stages of the first H6-EGFP purification (indicated on the top of the gel).
Due to the impurities present in solution, the protein sample was further purified by SEC. During this stage absorbance was monitored at 280 nm and 488 nm (figure 6), corresponding the aborption peak of aromatic aminoacids and EGFP, respectively. Furthermore as the protein is approximately 28 kDa, it is expected to elute at 15 mL.
0 10 20 30 0 500 1000 Ab sorbanc e / a.u. Volume / mL Abs280 Abs488 Fractions collected MW, kDa 250 – 150 – 100 – 75 – 50 – 37 – 25 – 20 – 15 – 10 –
Lysate Supernatant Desalting
Pellet IMAC SEC
The sample was further characterized by fluorescence spectroscopy. Both the excitation and emission spectrum recorded (figure 8) match those found in the literature (figure 2) indicating the protein retains its functionality upon expression and purification 300 400 500 600 700 0,0 0,2 0,4 0,6 0,8 1,0 Normai lz ed i ntens ity Wavelength / nm Excitation Spectrum Emission Spectrum
Figure 7. Excitation (λem=530 nm) and emission spectra (λex=400 nm) of the protein sample after purification through IMAC and desalting.
The concentration of H6-EGFP was determined by BCA assay indicating a yield of
1110 µg mL-1 (≈ 38 µM).
After optimizing the purification protocol, the protein was expressed and purified a second time. The conditions used were the same as before, but there was no need to desalt the sample following the IMAC as the buffer exchange can also be done during the SEC (chromatograms shown in annex). As expected, the SDS-PAGE analysis from the second batch of protein (figure 8) shows that the contents of the purified protein sample are similar to the contents from the first batch. Total protein concentration as determined by BCA assay is 1625 µg mL-1 (≈ 56 µM)
Figure 8. SDS-Page gel of the H6-EGFP sample throughout the different steps taken on the
2nd purification.
2.3.2. Expression, Purification and labelling of
SFH
10Expression of SFH10 on E. coli BL21 had previously been optimized in the lab,
thus, the same conditions were used. Nonetheless, the IMAC purification protocol available had not been optimized for use in a FPLC yet. Preliminary experiments showed the presence of unwanted proteins with a high affinity for Ni-NTA. In order to isolate the proteins according to their affinity for these sites a gradient IMAC was performed. By monitoring absorbance at 280 nm (figure 9), three elution peaks are visible. An elution peak starting at 0 % elution buffer (0 mM imidazole), a second elution peak starting at ~38 % elution buffer (~190 mM imidazole) and a third peak starting at ~50 % elution buffer (250 mM imidazole).
The different fractions were labeled with SNAP-Vista® Green and characterized by SDS-PAGE (figure 10). By labeling the SNAP-Tag prior to SDS-PAGE analysis, it is possible to easily identify SNAP-fusion proteins upon excitation with blue light (figure 10, right), showing SFH10 is present only in the third elution peak.
MW, kDa 250 – 150 – 100 – 75 – 50 – 37 – 25 – 20 – 15 – 10 –
Lysate Supernatant SEC
Pellet IMAC
0 10 20 30 40 50 60 0 500 1000 1500 2000 2500 3000 3500 4000 Abs280 % Elution Buffer Fractions collected Ab sorbac e / a.u. Volume / mL 0 20 40 60 80 100 % e lu tio n b u ff e r
Figure 9. Chromatogram of the purification of SFH10 using a gradient IMAC. %elution buffer corresponds to fraction of elution buffer used. At 0 % elution buffer there is no imidazole in the system while 100 % elution buffer corresponds to 500 mM imidazole.
Figure 10. (Left) SDS-Page gel of samples from the different peaks in the gradient IMAC
(figure 12). The samples were reacted with SNAP-Vista® Green prior to being run on the gel.
(Right) Image of the same gel before staining and excited with blue light.
SDS-PAGE analysis of the protein sample throughout the purification procedure (figure 11) shows that all impurities have been removed from solution.
The concentration of SFH10 was determined by BCA assay indicating a yield of 2671
µg mL-1 (≈ 118 µM) MW, kDa 150 – 100 – 75 – 50 – 37 – 25 – 20 – 15 – 10 –
1st peak 3rd peak 1st peak 3rd peak
2nd peak 2nd peak
Figure 11. (Left) SDS-Page gel of SFH10 samples throughout the purification (figure 12).
The samples were reacted with SNAP-Vista® Green prior to being run on the gel. (Right)
Image of the same gel before staining and excited with blue light.
Before using the protein in further experiments, the SNAP-tag was labeled with SNAP-Surface® 647. To characterize the labeling efficiency, the DOL was determined. Briefly, this parameter is the quotient of the concentration of fluorophore versus the concentration of protein. These elements were determined by measuring the absorbance of the labeled protein at 280 nm and 647 nm indicating a DOL of 64.58%
(protein concentration = 15.5 µM). The DOL is dependent on two major factors. First, it is
inversely correlated to the protein purity. As protein concentration is determined by the absorbance at 280 nm, non-reactive proteins will also account for the determined DOL. Second, the DOL is directly correlated to the enzymatic activity of the SNAP-Tag fusion protein as a higher DOL means the SNAP-tag fusion protein was able to process more substrate during the reaction time. The DOL is specific for a set reaction as the substrate, temperature, pH, among other factors have an influence on the enzymatic activity.
2.3.3. Cleavage of the his-tag from SFH
10The his-tag was also cleaved in order to assess its influence on the protein adsorption to a PPy film (experiment described in chapter 4). It is not known whether or not the his-tag influences DOL of the protein/cleaved protein, so in order to ensure this
MW, kDa 250 – 150 – 100 – 75 – 50 – 37 – 25 – 20 – 15 – 10 – – SFH10
Lysate Supernatant Desalting Lysate Supernatant Desalting
from fusion proteins. Nonetheless, the construct of SFH10 allows this cleavage site to
remove not the Flag-tag but the His-tag on its C-terminus.
As an insufficient amount of enzyme does not fully cleave the protein and an excessive amount might show unspecific cleavage, the first step in the process was to optimize the ratio protein: enzyme to be used. This was done by reacting SFH10 with
EKMax™, followed by labeling with SNAP-Vista® Green and finally analyzing on a
SDS-Page gel (Figure 12).
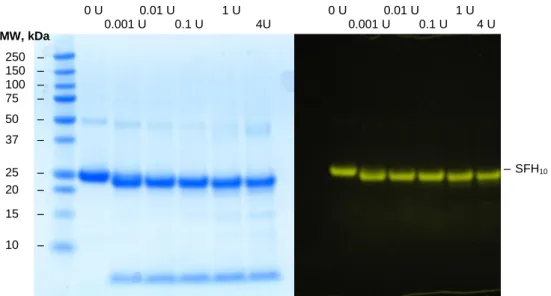
As one would expect we see a small shift to smaller sizes when EKMax™ has been added to the solution due to the cleavage of the His-tag. The gel also shows that the optimal concentration is 20 µg SFH10 per 0.1 U EKMax™, as ImageJ analysis of
the protein band is clearer than for other concentrations. Upon addition of EKMax™ a low molecular weight protein band is visible corresponding to the cleaved his-tag.
Figure 12. (Left) SDS Page of SFH10 cleaved with different amounts of EKMax™. The
protein was labeled with SNAP-Vista® Green prior to being run on the gel. (Right) Same
SDS-Page gel before staining and excited with blue light.
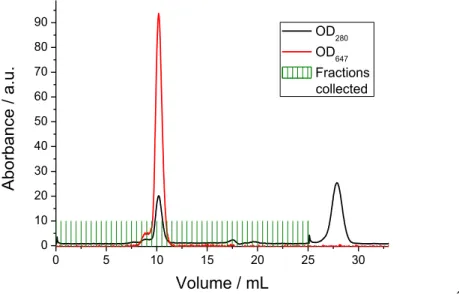
SFH10-647 was reacted with EKMax™ using the 20:0.1 ratio. A SEC was used to
isolate the different components of the mixture. During this step, absorbance at 647 nm was monitored to detect the cleaved SFH10-647 (figure 13) showing this protein is
eluted at 10 mL. This elution volume corresponds to particles with 50 kDa, double the size of the protein of interest. This indicates the protein is organized into dimers. A second elution peak at 27 mL is visible when monitoring absorbance at 280 nm. This elution peak matches the low molecular weight protein band visible on the SDS-PAGE gels (figure 12), thus corresponding to the cleaved his tag.
Protein concentration of the sample was assessed by measuring the absorbance
MW, kDa 250 – 150 – 100 – 75 – 50 – 37 – 25 – 20 – 15 – 10 – – SFH10 0 U 0.01 U 1 U 0 U 0.01 U 1 U 0.001 U 0.1 U 4U 0.001 U 0.1 U 4 U
correlated to the concentration of fluorophore in solution using Lambert-Beer law, which in turn can be related to the protein concentration using the DOL measured for the non-cleaved protein (64.58 %).
0 5 10 15 20 25 30 0 10 20 30 40 50 60 70 80 90 Ab orbanc e / a.u. Volume / mL OD280 OD647 Fractions collected ´
Figure 13. Chromatogram of the separation of the different components of the mixture after
2.4. Conclusion
This chapter reported the expression and purification of H6-EGFP, followed by the
characterization of the sample. The protein was purified in two steps: first by IMAC, relying on the affinity of the Ni-NTA motifs on the column for the His-tag, and then by SEC, separating the protein of interest from impurities with very different sizes.
The second part reported in this chapter describes the expression and purification of SFH10. This fusion protein is morphologically different from EGFP and it can be
labeled with a BG derivative containing a fluorophore. Due to some of the impurities in solution showing affinity to the Ni-NTA motifs, SFH10 was purified by gradient IMAC.
After purification of SFH10, the protein was labeled with SNAP-Surface® 647. The
labeled protein was characterized by SDS-Page gel and by determining the DOL. This parameter provides information on the amount of fluorophore in relation to the amount of protein.
The final part of the chapter reports the cleavage of the His-tag from SFH10-647.
SFH10 was labeled prior to the cleavage to ensure the DOL would be the same in the
____ Chapter 3.
Analysis of protein binding to
polystyrene microparticles
3.1. Introduction
3.1.1. Aim of the project
In this chapter, the use of polystyrene microspheres to immobilize his-tagged proteins to solid support is reported and two different techniques used to analyze this interaction. While microparticles are an interesting tool allowing an easy immobilization of proteins in solution using simple procedures it is important to comprehend the system, its advantages and its limits. With this in mind, functionalized particles were analyzed using fluorescence spectroscopy and fluorescence microscopy while comparing both approaches.
3.1.2. Polystyrene microspheres
While 2D surfaces have been more extensively applied as biosensors, microparticles provide a platform which is easier to transpose current techniques to. Microparticles can be analyzed in solution using techniques such as dynamic light scattering or flow cytometry, or immobilized on a surface so they can be studied using fluorescence microscopy[1]. By functionalizing the particles separately with different proteins this platform also offers the possibility of multiplexing, making microparticles arrays a economic and easily prepared platform to study protein-protein interactions or protein-drug interactions[1,35]. Furthermore, by varying the particles’ size or doping agents (incorporated dyes), it is easy to track particles individually through several functionalization steps.
Proteins can be immobilized on the particles’ surface by physisorption. Nonetheless, as previously stated (refer to chapter 1), proteins adsorbed this way have a random orientation, usually resulting in a decreased biological activity. By coating the particles with target molecules, this problem can be circumvent [1,7]. Polystyrene microparticles with different coatings are commercially available. These particles are usually used for protein purification, to remove certain molecules from solution or simply as size standards to calibrate equipment. However the possibility of protein multiplexing makes microparticles a promising platform to apply to bioanalytics[36]. In fact, some companies have started developing bead arrays (most of which in solution) to DNA screening.
3.1.3. Nitriloacetate complexes
Transition metal complexes have been used as chemosensors or to study metallo enzyme function and supramolecular self-assembly. Transition metals act as a Lewis acid and can interact with a variety of Lewis basic functional groups. This interaction goes beyond a simple electrostatic interaction. The transition metal shows intrinsic selectivity towards the nature of the donor. This selectivity is justified by the hard soft acid base (HSAB) principle stating that hard acids favor the interaction with hard bases, while soft acids prefer soft bases[21,37,38].
Especially when immobilizing metals on a surface, it is important to make the right choice of ligand to use. While a single coordinative bond may provide sufficient binding strength to form a stable complex, it does not provide enough stability to retain the metal cation. The selected immobilized ligand should be polydentate to exclude competing ligands, possibly the solvent. The choice of what metal ion to use also has an impact on the system as different metals also result in different affinities. (Table1)
Table 2. Binding constants of different metal ion toward NTA measured at 20ºC. Adapted
from [21].
NTA complexes have been used as a chelate for several metal ions. Although the most common application is in IMAC to purify His-tagged proteins, NTA complexes have also been applied to protein immobilization on micro- or nanoarrays[21].
NTA is a tetradentate ligand being able to establish four coordination bonds to the metal ion. When bound to Nickel (II), favoring an octahedral geometry, there are two
capturing the metal ion from the NTA complex and releasing the bound protein at the same time[34,36].
3.2. Materials and methods
3.2.1. Functionalization
of
polystyrene
microparticles in solution
To prepare the calibration curve of the absorbance versus the concentration of polystyrene microparticles coated with Ni-NTA (NiNTA-PPsMPs)(Kisker Biotech) , the particles were diluted in PBs directly from the stock.
NiNTA-PPsMPs were functionalized by taking 100 µL NiNTA-PPsMPs from stock, diluting to 1 mL with PBS and washing twice with PBS. After the washing steps, NiNTA-PPsMPs concentration was determined using OD600 and 0.2 mg
NiNTA-PPsMPs were incubated with different concentrations of H6-EGFP in PBS for 2 hours,
in the dark, at room temperature. The samples were then washed twice with PBS. The controls were prepared by incubating NiNTA-PPsMPs with H6-EGFP in PBS
supplemented with 100 mM imidazole.
3.2.2. Immobilization of Polystyrene Microparticles
on a glass surface
To prepare the functionalized glass surface, a glass slide (VWR) was first washed with MQ water, Ethanol and Acetone and dried under N2.flow. Then, it was Ni Plasma
etched for 180s, covered with 100 µg mL-1 poly-L-lysine bromide for 2 min and rinsed with deionized water for 10 s.
NiNTA-PPsMPs were first diluted in deionized water and then immobilized onto the glass surface by covering the surface with the particles for 30 min at room temperature. Non-immobilized particles were removed by rinsing the glass slide with a stream of deionized water for 10 s. NiNTA-PPsMPs were functionalized by covering the glass slide with H6-EGFP in PBS, in the dark, at room temperature, for 30 min. Excess of
H6-EGFP was removed by rinsing for 10 s with deionized water.
Elution of the bound protein with imidazole or EDTA was accomplished by immersing the particles in PBS containing either 500 mM imidazole or 500 mM EDTA for 30 min, in the dark, at room temperature and then rinsing with MQ water for 10 s.
3.2.3. Absorbance spectra
Absorbance spectra were recorded using a Cary 50 Bio UV-Vis spectrophotometer. The absorbance spectra were monitored from 250 nm to 700 nm with 1 nm increment using PBS as blank.
3.2.4. Fluorescence spectra
Excitation and emission spectra of H6-EGFP samples were measured on a
Fluorolog Spectrofluorimeter (HORIBA, Jobin Yvon). Samples were excited at 488 nm (slit 3 nm) and emission spectra were monitored between 500 nm and 700 nm (slit 3 nm), with integration time of 0.5 s nm-1 and with an increment of 1 nm.
3.2.5. Fluorescence microscopy
Immobilized microparticles were imaged using a Leica DM5500 B microscope equipped with a Leica EL600, mercury metal halide lamp bulb.. Fluorescence images were taken with a Leica GFP filter (to monitor H6-EGFP) and a Chrome Cy5 filter (to
monitor SFH10-647). The samples were imaged in PBS after functionalization and after
elution.
The images were analyzed with ImageJ. For the analysis of the particles, a mask was created around each particle using the brightfield (DIC) image, which was transposed to the GFP filter image. This allows the analysis of each particle individually.
The fluorescence intensity (intensity) of the particles was analyzed in relation to the background, as follows:
Where IF,particles is the mean fluorescence intensity of the particles and IF, background is
3.3. Results and Discussion
3.3.1. Analysis of polystyrene microparticles by
fluorescence spectroscopy
Usually, when the adsorption of a molecule occurs via a chemical reaction, a monolayer is formed. The formation of a monolayer on surface can be described by
where S is the free binding sites on the surface, P is adsorbate and SP is is the complex formed between the surface and the adsorbate[39,40]. Writing the equilibrium equation for this reaction
where K is the equilibrium constant. In the case of the adsorption of H6-EGFP to
NiNTA-PPsMPs, the amount of bound protein is directly proportional to the surface area available, which in turn, is proportional to the concentration of particles in solution. When working with low concentrations of particles, fluctuations on the concentration of particles translate in a variation of the amount of bound protein. The loss of particles during the washing steps or simply non-specific binding to the walls of the containers also influence the surface area available.
Preliminary experiments showed that absorbance is directly proportional to the concentration of polystyrene microparticles in solution. Thus, to monitor the concentration of NiNTA-PPsMPs, absorbance spectra of different concentrations of NiNTA-PPsMPs were recorded (figure 14). To ensure the presence of H6-EGFP does
not contribute to absorbance of the samples of NiNTA-PPsMPs functionalized with the protein, it was decided to monitor OD600 to determine the concentration of
NiNTA-PPsMPs (figure 15). The results show OD600 is directly proportional to the
300 400 500 600 700 800 0,0 0,2 0,4 0,6 0,8 1,0 1,2 1,4 1,6 1,8 Ab sorbanc e Wavelength / nm 1.0 mg mL-1 0,63 mg mL-1 0,40 mg mL-1 0,25 mg mL-1 0,15 mg mL-1 0,10 mg mL-1 0,063 mg mL-1 0,040 mg mL-1 0,025 mg mL-1 0,015 mg mL-1 0,010 mg mL-1
Figure 14. Absorbance spectra of different concentrations of NiNTA-PPsMPs.
0,01 0,1 1 0,01 0,1 1 OD 600 Concentration / mg mL-1 Equation y = a + b*x Adj. R-Squ 0,99913
Value Standard Err
or
Intercept -0,0026 0,00381
Slope 1,76615 0,13844
Figure 15. Calibration curve of the absorbance versus the concentration of NiNTA-PPsMPs.
The error bars correspond to the standard deviation from 3 independent samples.
In order to demonstrate the concentration of NiNTAPPsMPs has no influence over the emission of the sample at 510 nm (when exciting at 488 nm), emission spectra of different concentrations of NiNTA-PPsMPs (from 0.01 mg mL-1 to 0.063 mg mL-1) were measured (figure 16). These samples showed the same fluorescence intensity measured in the absence of NiNTA-PPsMPs (PBS).
500 550 600 650 700 0 2000 4000 6000 8000 10000 12000 F luores cenc e i ntens ity / a. u. Wavelength / nm 0,010 mg mL-1 0,015 mg mL-1 0,025 mg mL-1 0,040 mg mL-1 0,063 mg mL-1 PBS
Figure 16. Emission spectra (λex=488 nm) of different concentrations of NiNTA-PPsMPs suspended in PBS.
Using the emission signal at 510 m (exciting at 488 nm), the binding curve of H6-EGFP onto NiNTA-PPsMPs was determined (figure 17). Analyzing the mean signal,
there is an increase of bound protein with the concentration of H6-EGFP. As the
amount of bound protein does not reach a plateau as expected for the formation of monolayers following Langmuir isotherm[39,40], the samples have not been saturated yet. The samples also show a high standard deviation of the emission signal for independent samples, indicating this system lacks sensitivity.
1E-10 1E-9 1E-8 1E-7 1E-6 -2x10⁶ -1x10⁶ 0 1x10⁶ 2x10⁶ 3x10⁶ 4x10⁶ 5x10⁶ 6x10⁶ 7x10⁶ 8x10⁶ 9x10⁶ F luores cenc e Inten si ty x [Ni NT A-PP sMP s] / / mL mg -1 [H6-EGFP] / M without imidazole with imidazole
Figure 17. Binding curve of H6-EGFP onto the surface of NiNTA-PPsMPs. H6-EGFP was -1
3-fold lower amount of H6-EGFP on the NiNTA-PPsMPs. Imidazole competes with
H6-EGFP for the binding sites to the Ni-NTA motifs and in the presence of 100 mM
imidazole, the equilibrium favors the formation of the complex with imidazole, thus blocking the protein from interacting with the Ni-NTA motifs.
3.3.2. Immobilization
and functionalization
of
polystyrene microparticles on a glass surface
A different way to measure the binding of H6-EGFP is by fluorescence microscopy.
Fluorescence microscopy requires the particles to be immobilized on a surface. The glass surfaces were functionalized with PLL prior to the immobilization of NiNTA-PPsMPs. This peptide is positively charged, thus interacting with the negative charge of the NiNTA-PPsMPs and allowing them to remain bound to the surface (figure 18).
Different dilutions of NiNTA-PPsMPs in deionized water (from 50 mg mL-1 to 0.05 mg mL-1) were deposited on the surface to assess the optimal concentration to use. It is important to tune the concentration of particles on the surface in order not to hinder the analysis. The density of immobilized particles must be high enough to allow a significant number of particles to be analyzed and, at the same time, it must be low enough so the particles can be easily analyzed individually. The results (figure 18) show that 0.5 mg mL-1 is the optimal concentration. While lower dilutions show too many particles on the surface and higher dilutions show too few immobilized particles, 0.5 mg mL-1 NiNTA-PPsMPs show the right amount of particles on the surface. Therefore it was decided to use a concentration of 0.5 mg mL-1 NiNTA-PPsMPs on further experiments.
b)
c)
Figure 18. (a) Different concentrations of NiNTA-PPsMPs immobilized on the glass slide. (c)
Density of particles on the glass slide for different NiNTA-PPsMPs concentrations. Error bars correspond to the standard deviation of the density of particles on the glass surface.
After functionalizing the surface with NiNTA-PPsMPs, the slides were incubated with different concentrations of H6- EGFP (1 nM, 10 nM, 100 nM or 1000 nM).
Fluorescence images recorded in the GFP filter images show that the amount of bound protein is positively correlated to the amount of protein added (figure 19). For the samples functionalized with 1 nM H6-EGFP no intensity was detected. Similarly to the
0 2 4 6 8 10 50 mg/mL 5 mg/mL 0.5 mg/mL 0.05 mg/mL pa rt ic le s / 100 µm ² a) 50 mg/mL 5 mg/mL 0.5 mg/mL 0.05 mg/mL
1 10 100 1000 0 5 10 15 20 25 30 Intens ity / a.u. [H6-EGFP] / nM
Figure 19. Fluorescence intensity of different concententrations NiNTA-PPsMPs in relation
to the fluorescence intensity of background as measured by fluorescence microscopy.
The specific binding of H6-EGFP to the Ni-NTA motifs was determined by
incubating the glass slide functionalized with H6-EGFP with EDTA (figure 20) or
imidazole (figure 21). Fluorescence micrographs recorded in the GFP channel show that upon addition of 500 mM EDTA the intensity of the samples functionalized with 100 nM or 1000 nM H6-EGFP is halved(figure 22), while for the sample functionalized
with 10 nM H6-EGFP no decrease was detected. Upon addition of imidazole, the
intensity of the samples functionalized with 100 nM and 1000 nM H6-EGFP increases,
while the intensity for the samples functionalized with 1 nM or 10 nM show no variation (figure 22). Despite the increase of the intensity verified for the samples functionalized with 100 nM or 1000 nM H6-EGFP upon elution with imidazole, the line scans of the
images of these samples before and after elution show a decrease of the fluorescence intensity of the NiNTA-PPsMPs upon incubation with imidazole. However, these images show a higher decrease of the fluorescence intensity of the background in comparison to the decrease of the fluorescence intensity of the NiNTA-PPsMPs, thus resulting in a higher intensity upon incubation with imidazole.
Figure 20. (a) Fluorescent microscopy images (GFP filter) of immobilized NiNTA-PPsMPs
functionalized with different concentrations of H6-EGFP prior to elution with EDTA. The red
line corresponds to the area the line scans were taken from. (b) Line scans of the images shown on a). (c) Fluorescent microscopy images (GFP filter) of immobilized NiNTA-PPsMPs
functionalized with different concentrations of H6-EGFP after elution with 500 mM EDTA.
The red line corresponds to the area where the line scans were taken from. (d) Line scans of the images shown on c).
0 10 20 30 40 50 60 70 0 5 10 15 Fl u o res cen ce In ten si ty / a. u . µm 0 5 10 15 µm 0 5 µm 10 15 0 5 µm 10 15 0 10 20 30 40 50 60 70 0 5 10 15 Fl u o res cen ce In ten si ty / a. u . µm 0 5 µm 10 15 0 5 µm 10 15 0 5 µm 10 15 1000 nM 100 nM 10 nM 1 nM 1000 nM 100 nM 10 nM 1 nM a) b) c) d)
Figure 21. (a) Fluorescent microscopy images (GFP filter) of immobilized NiNTA-PPsMPs
functionalized with different concentrations of H6-EGFP. The red line corresponds to the
area the line scans were taken from. (b) Line scans of the images shown on a). (c) Fluorescent microscopy images (GFP filter) of immobilized NiNTA-PPsMPs functionalized
with different concentrations of H6-EGFP after elution with 500 mM Imidazole. The red line
corresponds to the area where the line scans were taken from. (d) Line scans of the images shown on c). 1 10 100 1000 0 5 10 15 20 25 30 Intens ity / a. u. [H6-EGFP] / nM Before elution with EDTA After elution with EDTA 1 10 100 1000 0 10 20 30 40 50 60 Intens ity / a.u. [H6-EGFP] / nM Before elution with imidazole After elution with Imidazole
Figure 22. Fluorescence intensity of NiNTA-PPsMPs with different concentrations of
H6-EGFP prior and after elution. On the left 500 mM EDTA was used to elute the protein and on the right it was eluted with 500 mM imidazole.
0 20 40 60 80 100 0 5 10 15 Fl u o res cen ce In ten si ty / a. u . µm 0 5 µm 10 15 0 5 µm 10 15 0 5 µm 10 15 0 20 40 60 80 100 0 5 10 15 Fl u o res cen ce In ten si ty / a. u . µm 0 5 µm 10 15 0 5 µm 10 15 0 5 µm 10 15 1000 nM 100 nM 10 nM 1 nM 1000 nM 100 nM 10 nM 1 nM a) b) c) d)
3.3.3. Immobilization of functionalized polystyrene
microparticles on a glass surface
A different approach aiming at immobilizing different proteins on the same glass slide is to functionalize NiNTA-PPsMPs with protein while in solution and then immobilizing the functionalized particles on the glass surface. By separately functionalizing NiNTA-PPsMPs with different proteins and mixing them prior to the immobilization of the particles onto the surface it is possible to immobilize different proteins on the glass surface. The proof-of-concept is shown in figure 23. NiNTA-PPsMPs were separately functionalized with 100 nM H6-EGFP and 100 nM
SFH10-647 and immobilized on a PLL coated glass surface. H6-EGFP and SFH10 have
a pI of 6.13 and 6.16, respectively, thus, at pH 7.4 the proteins are negatively charged. As upon functionalization of the NiNTA-PPsMPs, these negatively charged proteins are covering the surface of the particles, the positively charged PLL is able to interact electrostatically with the protein coating of the particles and immobilize them. Figure 23 shows the functionalized NiNTA-PPsMPs remain on the surface even after extensive rinsing with deionized water.
Line scans from the fluorescence micrographs recorded with the GFP (to monitor H6-EGFP) and Cy5 (to monitor SFH10-647) were normalized between 0 and 1 (figure
23, b) as the aim of this experiment is to show the proof-of-concept of the use of NiNTA-PPsMPs for protein immobilization and not to quantify the amount of protein immobilized. Particles functionalized with different proteins can be clearly identified o the different channels (GFP and Cy5) and no transfer of proteins from different beads is detected.
Figure 23. (a) Brighfield (DIC) (left) and fluorescent microscopy (GFP filter in green and Cy5
filter in red) images of immobilized NiNTA-PPsMPs previously functionalized with H6-EGFP
or SFH10-647. The white line corresponds to the area where the line scans were taken from.
(d) Line scans of the fluorescent microscope images taken with the GFP filter (—) and the
Cy5 filter (—). 0 5 10 15 20 N o rm aliz ed flu o re sce n ce in ten sity distance / µm a) b)