Fare policies and a markup applica on based on
airport cost
Reinaldo Moreira Del Fiaco1, Paulo Afonso Lopes da Silva2 1Military Ins tute of Engineering (IME/EB), cmtefiaco@gmail.com
2Military Ins tute of Engineering (IME/EB), pauloafonsolopes@uol.com.br
Recebido:
22 de março de 2018
Aceito para publicação:
30 de setembro de 2018 Publicado: 30 de abril de 2019 Editor de área: Li Weigang ABSTRACT
The experience gained by developed countries shows that airport administrators seeks to increase their profitability, and regulatory agencies aims to guarantee quality, invest-ment and fair rates. States that are interested in having self-sustaining airports find in the regula ons for the private ini a ve or mixed capital society the change they want. With the goal of developing an aeronau cal fare pricing model based on airport cost, this paper presents an applica on of the Tornqvist index and the markup pricing method to find the market price opportunity. One of the specific goals is to compare the financial results based on ANAC Resolu on No. 350/14 with the results obtained in the proposed model. For the forecast of demand with the new price of the fare, it was used the con-cept of elas city. The scenario used was Campinas / Viracopos Airport, from January 2014 to March 2017. During the quarter in which there are no infrastructure
construc-on costs, the price of the fare is 0.04% higher than the fare ceiling envisaged by ANAC. An independent method based on cost and market opportunity, but on which the finan-cial statement should be audited, is shown to be promising in terms of increasing airport revenue. Establishing qualita ve parameters may be the best op on to ensure the qual-ity of social welfare for passengers, and if these goals are not achieved, then fines can be applied to the airport administrator.
RESUMO
A experiência de países desenvolvidos mostra que os administradores aeroportuários procuram aumentar sua lucra vidade, e as Agências Reguladoras obje vam garan r qualidade, inves mento e tarifas justas. Os Estados, que se interessam em ter aeropor-tos auaeropor-tossustentáveis, encontram na regulamentação para a inicia va privada ou socie-dade de capital misto a mudança que desejam. Com o obje vo de desenvolver um mo-delo de precificação da tarifa aeronáu ca baseada no custo do aeroporto, este ar go apresenta uma aplicação do índice de Tornqvist e do método de precificação Markup para encontrar a oportunidade de preço do mercado. Sendo um dos obje vos específi-cos de comparar os resultados financeiros com base na Resolução No. 350/14 da ANAC com os resultados ob dos no modelo proposto. Para a previsão de demanda com o novo preço da tarifa, u lizou-se o conceito de elas cidade. O cenário u lizado foi o do Aero-porto de Campinas/Viracopos, de janeiro de 2014 até março de 2017. Durante o trimes-tre em que não há custos com construção de infraestrutura, o preço da tarifa é 0,04% maior do que o teto tarifário previsto pela ANAC. Durante períodos com custo de cons-trução, a média da tarifa foi 2,4 vezes maior em relação ao preço do Agente Regulador. Um método independente e baseado em custo e na oportunidade de mercado, mas no qual o demonstra vo financeiro deva ser seja fiscalizado, mostra-se ser promissor quanto ao aumento da receita do aeroporto. Estabelecer parâmetros qualita vos pode ser a melhor opção para exigir a qualidade do bem-estar social dos passageiros, e caso essas metas não sejam a ngidas, então multas podem ser aplicadas a administradora aeroportuária. Keywords: Airport; Regula on; Fares; Markup. Palavras-chaves: Aeroportos; Regulamentação; Tarifas; Markup. DOI: 10.14295/transportes.v27i1.1640
1. INTRODUCTION
Examples of international regulations show that it is possible to charge to the regulatory agency the responsibility for the readjustment of aeronautical fares and consequently the inancial vi-ability of the airport as a venture. Czerny (2006), Biggar (2012), Yang and Fu (2015) and Czerny and Zhang (2015) use optimization methods to determine the fare prices, and Fadloui (2012) uses multiple linear regression the same goal. In Brazil, each concession round from 2011 to 2017 received a different method to calculate the airport fare, all of which are not based on cost, using variables such as Euclidean distances of the competitor, the application of the Extended Consumer Price Index, factors of production and a quality index (ANAC, 2011, 2014, 2015). Airport revenues are divided into operational and operational. It is considered as non-operational revenues the inancial investments, consulting and training, and non-operational reve-nues are divided into aeronautical and non-aeronautical. The aeronautical revereve-nues include the fares related to the operations of embarkation, connection, landing, shipment, permanence, wharfage and storage, and of non-aeronautical tariffs are the rent of spaces for the promotion of advertising, commercial spaces, being able to collect participation in the pro its, parking lots, counters check-in, and others (Brazil, 1973; Vojvodic, 2008; Tadeu, 2011; Young and Wells, 2014).
Revenue management must have well-de ined and robust methods to maximize the airports and airlines pro it. (Sousa, 2014). However, Rocha et al. (2016) consider that, in air transporta-tion, the power of suppliers is strong and that of consumers is weak in relation to price choice, with consumers being only the price takers.
Serebrisky (2012) says that there is a question about what the best regulatory practice for pursuit of economic and inancial balance is, especially in the period of conception of privatiza-tion or concession regulaprivatiza-tion, despite the recommendaprivatiza-tions made by ICAO (2013) and IATA (2017b). Also, according to Serebrisky (2012), the Latin American and Caribbean countries that privatized their airports in the early twentieth century faced the challenge of choosing the pric-ing model, and each country adopted a different method for calculate aeronautical fares. When there is privatization, the tendency is to increase airport fares, for aiming the new ad-ministration's objectives, but these prices cannot be abusive for the market demand (Abeyratne, 2001). The concession of airports in the Latin American states, mainly at Brazil and Mexico, which are signi icant markets in world air transportation, allowed the perception of an admin-istration focused on the measurement of performance, mainly operational and inancial (Fer-nandes and Pacheco, 2016; TRB, 2010; Serebrisky, 2012), The privatization or concession pro-cess is usually accompanied by a new fare regulation policy (Czerny, 2006), and the operating costs, previously absorbed by the States, are now by operating revenues to compensate for the entry of the private agent into the airport administration (Serebrisky, 2012).
For Starkie and Yarrow (2013) each airline will react differently with the raise of aeronautical fares, depending on route performance, aircraft type, acceptance of passenger loss and revenue management. The proportion recognized by Starkie and Yarrow (2013) is: for each monetary unit of increase of the airport fares, there is an increase of one monetary unit in the airfare. Both authors cited the importance of the airport and the airline company to invest in price strategies. To establish the nomenclatures, it is considered as fare the price charged for airport services, airlines charges as the price of the airplane seat (airlines services), and airfare as the sum of the airport fare and airlines charges.
Starkie and Yarrow (2013) consider that an airport can change the price of their own fare, according to their inancial strategies and even when observing other airports fares. Fiuza and Pioner (2009) says the ideal model to determine airport fares are based on costs of the airport's inputs for each level of production, and from this one, should create an index of the operational cost, compatible with the inancial risk to airport administration.
The aim of this paper is to develop an aeronautical fare pricing model based on airport costs by applying the Tornqvist index and the markup method. The Tornqvist index is found by the calculation of Total Factor Productivity (TFP), being a method to ind the cost of one product according to the factory total cost and quantity produced (Dumagan and Ball, 2009). The spe-ci ics goals are not only to review the applicable prispe-cing polispe-cies, reviewing the calculation methods found in the literature, and Brazilian regulations, but also to compare the prices of fares published by Brazilian Aviation Authority Agency (ANAC) with the fare calculated in the application of this paper.
2. AIRPORT FARE POLICIES AND REGULATIONS
Airport regulations have two types of fare segregation, single-till and dual-till. The irst refers to the business model in which all aeronautical and non-aeronautical revenues are included. In the second, only aeronautical revenues are considered (Salgado and Fiuza, 2009; ICAO, 2013). For Czerny and Zhang (2015), the analysis of both tariff segregations should be focused on ques-tions about the pro its from each airport service.
There are two regulatory approaches for airports, cost-based pricing and non-cost-based pricing. The irst one encourages investment in ef iciency because it charges an aeronautical low-fare for airlines and passengers, as well as requiring the regulator to take speci ic care of each airport (Australian Government, 2011). For ANAC (2015), this approach refers to the cross subsidies between the origin of revenues and the adjustment rules for each case, aiming at the economic- inancial balance. In the second approach, regulation is adjusted according to produc-tivity, service quality and airport costs.
For Salgado and Fiuza (2009), the price-cap regulatory strategy is the system that should provide incentives to airport administrators, since if there is an optimization in the processes (cost reduction), the difference between revenue and costs would increase, that is, increase the pro it. However, ACI-EU (2016) states that this regulatory strategy limits revenue opportunities with aviation tariffs.
Another regulatory strategy is cost-plus, also referred as a return rate regulation strategy (Dempsey, 2008, ICAO, 2013). The airport administrator sends the marginal costs to the regu-latory agency, and a fare ceiling is de ined (Salgado and Fiuza, 2009), whose objective is to limit a rate of return on investment to the airport (ICAO, 2013).
In the light-handed regulatory strategy, ICAO (2013) lists the requirements for its applica-tion: de ining competitiveness laws, regulating benchmarking, and analyzing economic perfor-mance in inancial and equity balances. However, this strategy must be "lighter" than traditional ones, not a deregulation, but the acceptance of an innovative approach that determines prices and new conditions (Arblaster, 2017).
In brief, the regulation will be single-till or dual-till, the approach cost-based pricing or non-cost-based pricing, and the strategies price-cap, cost-plus or light-handed (Dempsey, 2008; Fuhr, 2008; Salgado and Fiuza, 2009; ANAC, 2015).
2.1. Pricing methods for aeronau7cal fares
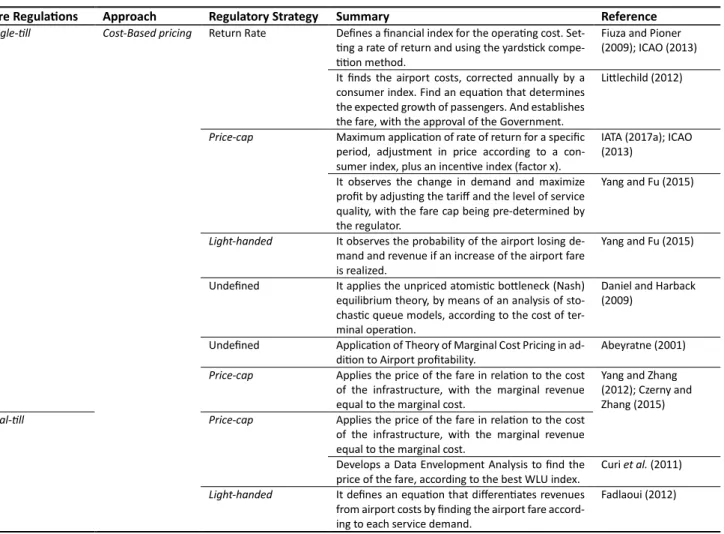
Table 1 presents the fare regulations, the approaches and the strategies found during the bibli-ographic review, as well as the summary of the methodology used by the various authors. It is noted that different methods are used for the same regulatory policy.
Table 1: Systematic review of regulations and pricing methods
Fare Regula7ons Approach Regulatory Strategy Summary Reference
Single- ll Cost-Based pricing Return Rate Defines a financial index for the opera ng cost. Set-ng a rate of return and usiSet-ng the yards ck
compe-on method.
Fiuza and Pioner (2009); ICAO (2013) It finds the airport costs, corrected annually by a
consumer index. Find an equa on that determines the expected growth of passengers. And establishes the fare, with the approval of the Government.
LiOlechild (2012)
Price-cap Maximum applica on of rate of return for a specific period, adjustment in price according to a con-sumer index, plus an incen ve index (factor x).
IATA (2017a); ICAO (2013)
It observes the change in demand and maximize profit by adjus ng the tariff and the level of service quality, with the fare cap being pre-determined by the regulator.
Yang and Fu (2015)
Light-handed It observes the probability of the airport losing de-mand and revenue if an increase of the airport fare is realized.
Yang and Fu (2015)
Undefined It applies the unpriced atomis c boOleneck (Nash) equilibrium theory, by means of an analysis of sto-chas c queue models, according to the cost of ter-minal opera on.
Daniel and Harback (2009)
Undefined Applica on of Theory of Marginal Cost Pricing in ad-di on to Airport profitability.
Abeyratne (2001)
Price-cap Applies the price of the fare in rela on to the cost of the infrastructure, with the marginal revenue equal to the marginal cost.
Yang and Zhang (2012); Czerny and Zhang (2015)
Dual- ll Price-cap Applies the price of the fare in rela on to the cost of the infrastructure, with the marginal revenue equal to the marginal cost.
Develops a Data Envelopment Analysis to find the price of the fare, according to the best WLU index.
Curi et al. (2011)
Light-handed It defines an equa on that differen ates revenues from airport costs by finding the airport fare accord-ing to each service demand.
Fadlaoui (2012)
The minimum price of the aeronautical fare in single-till (ST) segregation, using the price-cap strategy, is in Equation 1, and the minimization process was applied to cover the Average Costs (Biggar, 2012). If the airport has a higher than expected actual demand, then you will get a positive Marginal Revenue.
where ST: single-till fare;
Czerny and Zhang (2015), when analyzing the Biggar (2012) method, concluded that if the airport has a lower demand than expected, it becomes necessary to determine a rate of return to ind the cash balance.
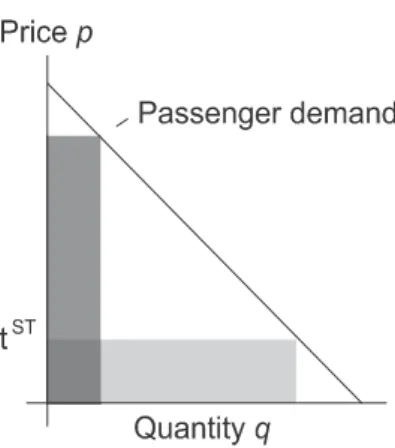
Figure 1 shows a graph of passenger quantity (q) x single-till fare ( ST). It is observed that
pro itability can be maintained with different fare prices. If the fare price is higher, the number of passengers is lower, and the inancial result is compensated. If the price of the fare is lower,
the number of passengers is greater, and the inancial result is also compensated. This analysis was done by Czerny and Zhang (2015) using Equation 1.
Figure 1. Rices and quantity per single-till price-cap with different fare prices. Available in: Czerny and Zhang (2015. p.9)
In the case of dual-till price-cap regulation ( #$) the price of the minimum tariff to be charged is represented by Equation 2 (Czerny and Zhang, 2015).
where DT: dual-till;
Czerny (2006) has demonstrated that single-till regulation has advantages in maximizing pro its compared to dual-till. The author assumes that airports and airlines can consider the demand for passengers by calculating airport fare, and non-aeronautical companies that serve passengers at the airport should consider their own prices for the calculation of demand elas-ticity. Czerny (2006) de ines the objective function (3) to demonstrate the calculation of the fare in the regulation single-till price-cap (τsp). The maximum fare price is given when the difference
between cost and revenue is zero, and the average is based on costs per passenger and the prof-its from non-aeronautical revenues.
where &': initial fare price; &(: inal fare price;
': initial demand, and (: inal demand.
Fadlaoui (2012) carried out an empirical analysis between the price-cap and cost-plus regu-latory strategies considering the price of the boarding fare (t) (exogenous variable of the model). The study was applied at 11 German airports to identify the impact of the increase in the price of the embarkation fare on demand. This author used multiple regression (Equation 4) and the characteristics as type of airport (X1) (hub, medium or regional), type of regulation
(X2), number of passengers (X3), number of airlines (X4) , and number of aircraft movements
(X5), are considered as independent variables (Xi), and being ε1 a random variable for the error
of the experiment.
= )'+ )(+(+ ),+,+ )-+-+ ). +.+ )/+/+ 0(
1 = min {τ: τ =
! }
& = max {0, − &1 1(&0, &1) 1(&0, &1) }
(2)
(3)
The result found by Fadlaoui (2012) for the price-cap regulatory strategy is that if all non-dummy independent variables are zero, the average price found at the airports hubs for the boarding fare would be € 2.121,32. Already with the cost-plus strategy, the average result for the airports hubs would be € 1.702,56. The conclusion of the author was that the price-cap strategy does not offer governmental incentives for the airport administrators, causing the air-port fare to be higher.
Yang and Zhang (2012) show that the rate adjustment can be done both by measuring the quality of services and by the proven improvement in operational capacity, i.e., the rate can be increased if the airport is evaluated by the users or there is an increase in their operational capacity.
Yang and Fu (2015) consider that the viability of the airports is directly related to the inan-cial result of the airlines, according to Equation 5.
where π1: airline inancial result, and
q1: the volume of airline traf ic at an airport.
The solutions found by Yang and Fu (2015, p. 127) have maximized the inancial pro itability of airports (π) using a light-handed proposal. In objective function (6), a ine is de ined (pT) if the airport does not achieve the desirable operational or inancial capacity.
max π − & = ( + ℎ) 9 − 2 − ; − &,
where u: variable costs that interfere with the correction of the fare price; h: revenue from commercial passenger services;
S: quality of services offered, and K: ixed cost.
Yang and Fu (2015) conclude that performances and airport inancial viability depend on many market factors, passengers and airlines aiming an excellent quality in airport services, but all of this increases the average cost pricing. For these authors, their investigation shows that light-handed regulation is promising for quality performance, and predicts demand based on welfare, but, for example, Australian public agencies and airlines do not agree in terms of higher fares that this type of regulation can generate. For these reasons, they suggest more studies based on price-cap, on cost-based and on optimization of the social welfare.
2.2. Brazilian regula7ons on airport fares
Although in Brazil the control by means of pricing is free and done by the airlines, the airport fares are controlled by the regulatory agent. According to the ANAC (2015, p.6) "the tariff setting did not follow a regulatory model, but made sporadically and according to the needs of IN-FRAERO or public policies." The Law 6.009/1973 (Brazil, 1973) allows annual adjustments for reaching the ceiling of airport fares.
The ANAC updated in 2011 the model of regulation of the airport tariffs of embarkation, landing and permanence, through Resolution n ° 180/11. In the text of this resolution, ANAC says that the methodology for inding the tariff cap price was developed according to IN-FRAERO's operational data, since 95% of the total volume of passenger and cargo traf ic in Bra-zil occurred in 66 airports administered by it in 2011 (ANAC, 2011; INFRAERO, 2012). Since then, the regulation has been based on the average airport costs of three previous years related
< = (= ! − > ? − ) 1 (5)
to the collection period, which used the Extended National Consumer Price Index (IPCA) for the annual rate adjustment.
Article 3 of Resolution No. 180/11 states that airports may apply discounts without discrim-ination based on such items as quality of service, time, day and season. This article is in line with IATA's recommendation (2017b) that independent economic regulation should be non-discriminatory and safeguard human rights without distinguishing several types of passengers. The same Resolution allowed fares to be increased up to 20% above the ceiling set by ANAC. If surpluses of collection prices are identi ied, then administrative measures would be taken to favor tariff modality (ANAC, 2011).
To increase airport revenue, the Law 12.648/12 (Brazil, 2012) reduced the percentage of Additional Airport Tariff (Adicional de Tarifa Aeroportuária - ATAERO) from 50% to 35.9%. Adding taxes, ATAERO and other fees, the gross remaining percentage for airports was about 32.55%, and with this established in 2012, the percentage of revenue from tariff revenue under total gross revenue increased to 46.65%.
In 2011, the airport concession program began, beginning with the São Gonçalo do Amarante airport (SBSG). The second round of concessions was held in 2012, in which private airports were granted to Brası́lia (SBBR), Guarulhos (SBGR) and Campinas (SBKP). With the Logistics Investment Program (PIL), the Galeão (SBGL) and Con ins (SBCF) airports also began, the auc-tion took place in 2012 and the contracts were signed in 2013. In 2015, a new step was an-nounced for the PIL with the fourth round of concessions, with the concession of the airports of Fortaleza (SBFZ), Salvador (SBSV), Porto Alegre (SBPA) and Florianópolis (SBFL). However, the new Government elected in 2014 announced the Crescer Project in 2016 and these airports (SBFZ, SBSV, SBPA and SBFL) were auctioned only in 2017 (ANAC, 2017).
For the airports granted, the regulation was the one based on cost, according to ANAC Reso-lution 350/14, based on the concession model of SBSG. With the experience that ANAC and IN-FRAERO acquired in the irst years of the concessioned airports, both have opted for a change of approach, now for the regulation not based on cost. Under Resolution No. 350/14, airport fares could be increased up to 100% of the amount of the fare celling set by ANAC (2014).
2.2.1 Non-cost-based pricing methodology
The non-cost regulation is applicable to the INFRAERO Network and concessioned airports (ANAC, 2015), since each concessioned airport can operate under the rules de ined by contract with ANAC (ANAC, 2014). Decree n° 7.624/11 (Brazil, 2011), says in art. 7 that "in the operation of aerodromes granted, airport fares will be applied according to the fares regime established by ANAC". The calculation methodology of the fares changes according to the predetermined revisions in the contract with each concession, and, in general, and it is the result of the sum of equations 9 and 10, and the indicators of quality of services (IQS).
To compose the initial fare pricing, the Total Factor Productivity (TFP) is calculated using the Tornqvist index or the price of the fare previously found by INFRAERO's internal methodology (ANAC, 2015). After the composition of the price found through the TFP, the base for the ad-justment of airport tariffs for the remaining years is the application of the broad national con sumer price index. Paragraph 2 of art. 7 of Decree 7.624/11 (Brazil, 2011) states that "tariff prices shall be adjusted annually by means of a consumer price index" (ANAC, 2015, p. 12). Paragraph 1 of the same art. 7 states that fare gains should be used to provide operational ef iciency and quality in the services provided by the concessionaire, and as a tool for evaluation
and pricing, besides the qualitative indicators of ef iciency indices (X Factor) and quality of ser-vices (IQS), the latter being performed through the Permanent Passenger Satisfaction Survey made by Civil Aviation Secretariat (Brazil, 2011).
After calculating the IPCA variation, the contracts of concession de ine the X Factor as shown in Equation 7. The adjustment of the price of the fare considers the investment in the increase of space at passenger terminal (TPAX) and the parking positions for aircraft (PA), both repre-senting by percentage of operational gain (ANAC, 2013, p.2), and being a reduction of the price of the fare. For SBBR, SBGR and SBKP airports adjust fares with the reference base price of 2.06%, and SBGL and SBCF use of 1.42%.
+ @ A = 1,0206 [1 − ( = + + = )]
SBFL, SBFZ, SBPA and SBSV consider the X Factor the percentage of TFP, and use it as the reference the price previously practiced by INFRAERO.
In the same way, the Q Factor is the result of the analysis of the following indicators of quality of services (IQS): direct services, and availability of equipment and facilities on the air side. IQS are composed of 29 performance indexes. According to Appendix D of the concession agree-ment, ANAC considers 15 IQS factors, each with a decrease factor. The readjustment of the Q factor may vary according to the agreement, with a minimum of 2% and a maximum of 7.5% in relationship of the price found after the sum of equations 9 and 10 (ANAC, 2011b).
3. DEVELOPMENT OF THE EMPIRICAL MODEL
The development of the model was divided into two parts: irst, the description of the data, which presents the variables of macroeconomic and microeconomic panel, the movement of the airport and the operational history of lights; the second part, the development of the empirical model with the proposed delimitations. Fiuza and Pioner (2009) recommend that an ideal model for determining airport fares should be based on the costs of airport inputs, although Phang (2016) argues that cost-based regulation is fairer for the consumer that understand pric-ing and agrees to pay for that service.
3.1. Descrip7on of the data
For the development of the proposed model, macroeconomic, microeconomic, operational and tax rates are required.
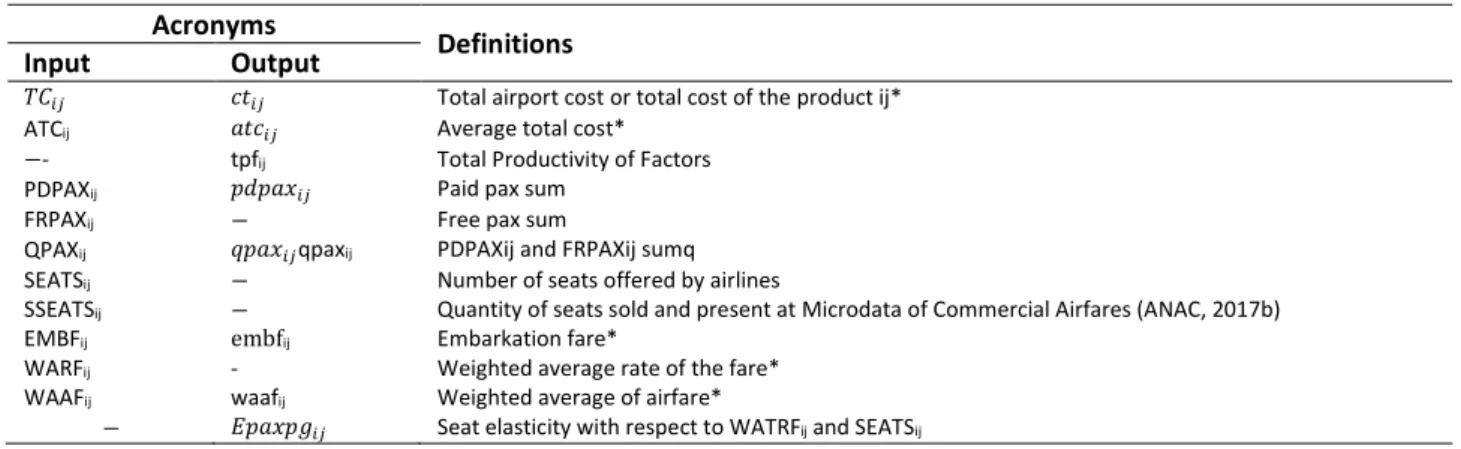
Table 2 shows the de inition of the input and output variables of the model.
Table 2: Model Input and Output Variables Acronyms
Definitions
Input Output
EF AEF Total airport cost or total cost of the product ij*
ATCij AEF Average total cost*
−- tpfij Total Productivity of Factors
PDPAXij &G& EF Paid pax sum
FRPAXij − Free pax sum
QPAXij & EFqpaxij PDPAXij and FRPAXij sumq
SEATSij − Number of seats offered by airlines
SSEATSij − Quantity of seats sold and present at Microdata of Commercial Airfares (ANAC, 2017b)
EMBFij embfij Embarkation fare*
WARFij - Weighted average rate of the fare*
WAAFij waafij Weighted average of airfare*
− H& & EF Seat elasticity with respect to WATRFij and SEATSij
The indexes i are considered for the type of aeronautical fares (1 is used for boarding and 2 for connection), and j for the destination, (1 for domestic and 2 for international).
The microeconomic variables can be found in the inancial statements of airports, these var-iables being presented in Table 2. To ind the Average Total Cost, we apply Equation 8, obtained from Vasigh et. al (2013).
EF = IEF
EF
where Yij: quantity of product ij.
To calculate the Weighted Average Rate of the Fare (WARF), we used Equation 9, also from Vasigh et. al (2013):
J @EF = ∑ ℎ EF
L
EM (;FM( OP , H EF
H EF
The operational variables can be found in the electronic portals of the airport administrator, in the Regulatory Agent and in the Ministry responsible for transportation (YOUNG and WELLS, 2014). For the model, the prices of PDPAXij, FRPAXij and QPAXij are necessary, because they are
the destination of domestic and international lights.
3.2. Descrip7on of the empirical model
To ind the cost of each airport service is used the Tornqvist index. The use of this index is jus-ti ied if the airport does not have the cost of its services (ANAC, 2015, p.14). The Equajus-tion 10 was obtained from Dumagan and Ball (2009), due to the amount of data available for the appli-cations of this article.
!&EFQ !&EFQR( = S T IQ IQR(U ( ,VWXYZ[WXYZ\]^ L EM(
where Yijt: quantity of product ij at a given time (t); and
Sijt: share of product revenue ij in total revenues in t.
After inding the Tornqvist index for the product, the result is multiplied by the absolute price of the total cost of the airport, with the objective of determining the cost of the unit produced of the service, according to Equation 11.
AEF = !&EF | |
With the TCij prices found in the previous step, the result of the elasticity between the seat
supply (ASS) and the WAAF is used to de ine the price per markup which is the percentage that the entrepreneur can generate of gross pro it, and this method is mainly used by airlines (Vasigh
et. al, 2013).
To ind the prices of the aeronautical fares considered here, it is necessary to observe the offer of seats by all the airlines that operate in the determined airport, considering the destina-tion, and applying in the pricing model of Starkie and Yarrow (2013). Equation 12 shows the calculation of the elasticity, and the result is classi ied as elastic when greater than 1, inelastic if less than 1 and unitary if equal to 1.
Ea= ΔSEATΔ (f
ghhijkx
WAAFjk,+ WAAFjk(
SEATS(f,+ SEATS(f(
Vasigh et. al (2013) say that the model will correspond to prices more suitable for the market if the result is elastic or unitary. If the result is less than 1 it is pointed out that the supply has (8)
(9)
(10)
(11)
decreased, and that strategies to attract passenger demand, seat supply and cost reduction can be considered as an option by the airport administrator (Vega, 2012; Vashing et. al, 2013). Equation 13 determines the price per markup (Vasigh et. al, 2013, p.337). If the elasticity result is negative, then the calculation should consider the markup formula as ATCij x (Ep /1+
Ep).
n & & A ( o?! ) = EF p1 +1 + HHq
qr
4. APPLICATION OF THE MODEL
The chosen scenario was International Airport of Campinas / Viracopos (SBKP), which attracts a large volume of passenger traf ic because it is the hub of Azul Airlines, and the Metropolitan Region of Campinas concentrates 20 municipalities representing 2.7% of the national GDP (Cappa and Souza Filho, 2017). It is also known that the highest revenue from the airport is derived from the movement of cargoes, as the region is a pole of industrial, agroindustry, aero-nautical and educational attractiveness (Cappa and Souza Filho, 2017).
From 2014 to 2016, SBKP's largest revenue was from cargo business (60,4%), followed by business with airlines (22.2%), commercial revenues (10.6%) and others. According to Cappa and Souza Filho (2017) the demand for 14 million passengers was expected for 2014, and in the planning of the concession for 2018, the amount of 22 million. Meanwhile, the handling (ar-rival / landing / connection) of passengers in 2014 was 9.84 million, with 5 million passengers paying the domestic embarkation fare from regular air transportation (Viracopos, 2015). The application of the model consists in using the demand and the cost of domestic embar-kation fare of regular air transportation to ind the best price for the corresponding aeronautical fare, using the markup method. With the data obtained and demonstrated in the next subsection (4.1), the model could be done quarterly, from 2014 to the irst quarter of 2017.
4.1. Obtaining the data
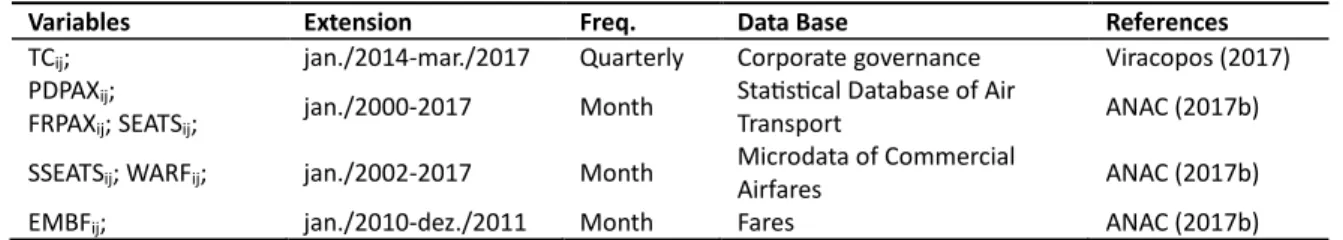
The economic, inancial and operational prices were organized monthly. The Brazilian National Civil Aviation Agency (ANAC), the Central Bank of Brazil (BCB) and the World Bank have a data repository that directs the users of their networks to different databases, so it is necessary to differentiate this information. Table 3 shows the searched variables, the time series extension, the database name and the references.
Table 3: Structure and references of the data used
Variables Extension Freq. Data Base References
TCij; jan./2014-mar./2017 Quarterly Corporate governance Viracopos (2017) PDPAXij;
FRPAXij; SEATSij;
jan./2000-2017 Month Sta s cal Database of Air
Transport ANAC (2017b)
SSEATSij; WARFij; jan./2002-2017 Month
Microdata of Commercial
Airfares ANAC (2017b)
EMBFij; jan./2010-dez./2011 Month Fares ANAC (2017b)
Table 4 shows the operating prices. The sample released by the airlines of the WATRF corre-sponds to 45% of the total PDPPAX that light to SBKP in 2014, 36% of the total when compared to 2015, and 28% corresponding to passengers paid in 2016 (ANAC, 2017b).
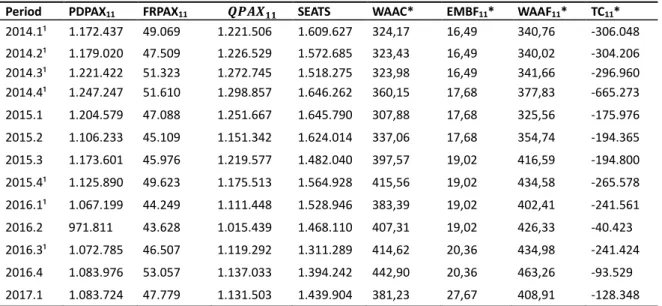
Table 4: Demand, supply and tariff prices at Viracopos Airport
Period PDPAX11 FRPAX11 stuvww SEATS WAAC* EMBF11* WAAF11* TC11*
2014.1¹ 1.172.437 49.069 1.221.506 1.609.627 324,17 16,49 340,76 -306.048 2014.2¹ 1.179.020 47.509 1.226.529 1.572.685 323,43 16,49 340,02 -304.206 2014.3¹ 1.221.422 51.323 1.272.745 1.518.275 323,98 16,49 341,66 -296.960 2014.4¹ 1.247.247 51.610 1.298.857 1.646.262 360,15 17,68 377,83 -665.273 2015.1 1.204.579 47.088 1.251.667 1.645.790 307,88 17,68 325,56 -175.976 2015.2 1.106.233 45.109 1.151.342 1.624.014 337,06 17,68 354,74 -194.365 2015.3 1.173.601 45.976 1.219.577 1.482.040 397,57 19,02 416,59 -194.800 2015.4¹ 1.125.890 49.623 1.175.513 1.564.928 415,56 19,02 434,58 -265.578 2016.1¹ 1.067.199 44.249 1.111.448 1.528.946 383,39 19,02 402,41 -241.561 2016.2 971.811 43.628 1.015.439 1.468.110 407,31 19,02 426,33 -40.423 2016.3¹ 1.072.785 46.507 1.119.292 1.311.289 414,62 20,36 434,98 -241.424 2016.4 1.083.976 53.057 1.137.033 1.394.242 442,90 20,36 463,26 -93.529 2017.1 1.083.724 47.779 1.131.503 1.439.904 381,23 27,67 408,91 -128.348 *Values in BRL (Brazilian Real) ¹Period with high infrastructure investment (VIRACOPOS, 2017).
To obtain the tax prices, it was identi ied that from 2012 to December 2016, ATAERO was applied, corresponding to 35.9% of the total price of the boarding embarkation fare (Brazil, 1989). From 2017 onwards, ATAERO's collection was extinguished until the recovery of the eco-nomic- inancial balance of the concession, according to the Law 13.319/2016 (Brazil, 2016). In Campinas-SP, the Tax on Services of Any Nature (ISSQN) corresponds to 5% of the amount charged for airport services, according to Decree 25.508/05 (Campinas, 2005). DAC Ordinance No. 602 / GC-5 of September 2000 stipulated that airlines for collecting passenger fares could retain 3% of the amount of this charges, and the same ordinance also establishes that a percent-age of 7.05% should be withheld from the fare, pursuant to Normative Instruction No. 1,234 / 12 of the Brazilian Federal Revenue (RFB, 2012).
4.2. Results
This section shows the results of the model, as described in the previous section. Table 5 shows the results of the Tornqvist index for each period and the tcij, according to Equations 10 and 11.
Table 5: Result of application of the Tornqvist index
Period tpf11 tc11* Period tpf11 tc11* 2013.4 - - 2015.3 0,164181 -31.982.546 2014.1 0,173761 -53.179.305 2015.4 0,158906 -42.201.807 2014.2 0,180207 -54.820.041 2016.1 0,145267 -35.090.874 2014.3 0,178204 -52.919.506 2016.2 0,094217 -3.808.536 2014.4 0,177955 -118.388.518 2016.3 0,124462 -30.048.157 2015.1 0,169242 -29.782.498 2016.4 0,152058 -14.221.861 2015.2 0,146245 -28.424.972 2017.1 0,165661 -21.262.291 * Values in BRL (Brazilian Real)
The tc11 from the period of 2014.1 represents 17.4% of the TC11. The average of tc11 with
domestic passengers is 15.6%. The lowest tc11 was in 2016.2, a period without no signi icant
infrastructure investment (VIRACOPOS, 2017). Martı́n and Socorro (2009) says that a public airport must be budget-constrained to avoid higher charges and the bad use of public inancial for infrastructure to subsidize a monopoly. For ACI-EU (2016), the private shareholders prefer
an appropriate return on investment on a short-time. European Airport, in the period of 2005-2014, increased their capital costs, capacity and social-welfare, and the charges varied approx-imately + 130,5%. When compared the price per passenger, the European Airports with higher investments presented lower cost in years than airports that do not made investments (ACI-EU, 2016).
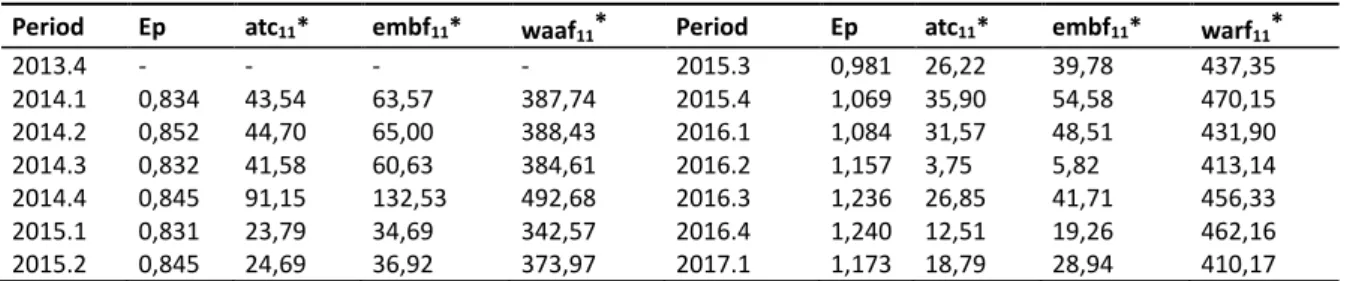
The results of the elasticity, atc11, embf11, and waaf11 are shown in Table 6. The result of the
mean elasticity is greater and approximately equal to 1. The higher elasticity was 1,240 in 2016.4, with embf11 equals to R$ 19,26, 5,4% less than the ANAC’s EMBF11 in a period without
signi icant infrastructure investment.
In this model based on cost, there is a dispersion on embf11 of R$ 126,71. Comparing the
average of EMBF11 and embf11, respectively, we have the amounts of R$ 18,99 and R$ 48,61. So,
the airport can then pro it in average R$ 29,50 from the present application of the markup method, difference found according the analysis of cost, and the price opportunity. For a single-till regulation, the same opportunity was found by Czerny (2006), but this article has used the Tornqvist index to ind the cost of domestic embarkation, instead of non-aeronautical revenue to reduce the aeronautical fare. The average embf11 is 2,54 times more than ANAC’s average
ceiling, representing the market opportunity for airport embarkation fare.
Table 6: Markup price application result
Period Ep atc11* embf11* waaf11* Period Ep atc11* embf11* warf11*
2013.4 - - - - 2015.3 0,981 26,22 39,78 437,35 2014.1 0,834 43,54 63,57 387,74 2015.4 1,069 35,90 54,58 470,15 2014.2 0,852 44,70 65,00 388,43 2016.1 1,084 31,57 48,51 431,90 2014.3 0,832 41,58 60,63 384,61 2016.2 1,157 3,75 5,82 413,14 2014.4 0,845 91,15 132,53 492,68 2016.3 1,236 26,85 41,71 456,33 2015.1 0,831 23,79 34,69 342,57 2016.4 1,240 12,51 19,26 462,16 2015.2 0,845 24,69 36,92 373,97 2017.1 1,173 18,79 28,94 410,17 * Values in BRL (Brazilian Real)
The lowest embf11 is R$ 5,82 in 2016.2, representing 69,3% less than the ANAC’s celling. On the other hand, the highest price is R$ 132,53 in 2014.4, showing that with high investments the fares will be higher. According to the ICAO (2013), this is a characteristic for a rate of return based on cost regulation, type of regulation that may provide a strong incentive for over-invest-ment to increase the pro it. We can observe, in the Figure 1, that Czerny and Zhang (2015) said that in a single-till regulation, highest prices can represent low demand, and a breakeven point should be determinated.
5. DISCUSSIONS
If were followed the Czerny and Zhang (2015) model for a single-till regulation, the airport ad-ministrator would predict a passenger or other aeronautical revenue demand to be greater than the average cost, but the ixed cost should be greater than thebe cover with non-aeronautical revenue. This occur to minimize the risk of a divergent market reaction comparing to airport prediction of demand. The method used in this article, based on cost, Tornqvist index and markup is for a single-till regulation the services to generate the non-aeronautical services should be applied to the total cost, and then the productivity could be used for a benchmarking analysis.
In this model, it was used the real demand to ind the productivity index and the fare price. The prediction of demand is the fragile component for airport business plan. However, this method is recommended by ICAO (2013), that says that the full costs of the airports need to be determined, and the price of their services is also a fragile component. According to ANAC (2014a, 2015), responsible to establish the aeronautical fares, if in the end of the contract of concession, the airport shows a negative return of investment, the Government will recompose this investment until it reaches the price of zero.
As airlines have sophisticated methods to ind their own prices, why airports cannot have their own methods by observing the non-discriminatory issues recommend by ICAO (2013) and IATA (2017b)? Despite the high price in periods of investment in infrastructure, it would be easier to ind the break-even point by using the method proposed in this article, a suggestion for ANAC and other regulatory agencies for considering its applicability.
When airport charges are adjusted by a new policy, with higher prices than before, this fact can create a juridical dispute with airlines and only can be resolved if the country has an inde-pendent administrative council for economic defense and a strong antitrust law (Littlechild, 2012). For example, as made for German Airports, when applied the light-handed regulation and compared to Australian Regulation, Littlechild (2012) says that is necessary a framework agreement with an independent aviation regulatory agency monitoring investment, reducing litigation and defending the interests of passengers. Any increasing in airport charges could be interpreted as an action against public interest (Abeyratne, 2001), and on the other hand, the investment made to increase the social welfare can justify the higher prices?
The social welfare for passenger is a concern for Yang and Fu (2015), ICAO (2013) and ANAC (2014). Using a qualitative index to calculate the airport fares approach for a light-handed reg-ulation, it is dif icult the prediction of revenue and the budget for an optimal investment in qual-ity of service. Establishing quantitative parameters may be the best option to ensure the qualqual-ity of social welfare for passengers, and if these goals are not achieved, then ines can be applied to the airport administrator.
6. CONCLUSIONS
This paper presents an innovative method based on Tornqvist index and the markup/cost pric-ing to ind the market price opportunity for aeronautical fare pricpric-ing. The method consists in pricing aeronautical fares after ind the operating costs of each airport service using the Tornqvist index, applying the cost multiplied by the elasticity of the seat supply and the total weighted average of the airfare paid by the passengers.
The Tornqvist index has as an advantage the accounting facility for updating the share of the cost of a service under total cost. And the markup pricing model stands out, because it is a well-known application for airlines that want to pro it from market opportunities, being possible to obtain more predictable results when using the offer as a criterion of elasticity for the adjust-ment of aeronautics fares.
The scenario used was the Campinas Airport from 2014 to March 2017. Analyzing the results of the markup model prices and the inancial statements, we conclude that in the periods when construction costs were higher, the price of the fare were will be higher. For having no major differences in the price of the fare for the passenger, the airport administration may distribute expenses and other actions in time construction for cost management.
showed the opportunity to gain with passenger’s demand. When the markup average is an unity, it can be explained as the airlines has an optimal prices after using the embarkation fare and their own cost to ind the price opportunity.
It is recommended to apply statistical methods to verify the impact of change airport fares on the passenger demand. It can also be veri ied the impact on demand when the price of the embarkation fare is applied with the 100% after the celling price, as stipulated by ANAC. De-mand assessment studies for aeronautical and non-aeronautical fares can be made to verify the impact of prices on airport revenues.
ACKNOWLEDGEMENTS
The authors thank the Coordination for the Improvement of Higher Level Personnel - CAPES for the support provided to carry out this research.
REFERENCES
Abeyratne, R. (2001) ICAO: Some Recent Developments in Aviation and Environmental Protection Regulation. Environmental Policy and Law, 32 (1), p. 32-40.
ACI-EU (2016) Airport Council International – Europe. Leveraging Airport Investment To Drive The Eu’s Aviation Strategy. Avai-lable at: <https://goo.gl/9u5iPK> (Access: 12/06/2016).
ANAC, Agência Nacional de Aviação Civil (2011) Resolução n° 180, de 25 de janeiro de 2011. Dispõe sobre o modelo de regula-mentação das tarifas aeroportuárias de embarque, pouso e permanência e dos preços uni5icado e de permanência. Brası́lia, DF. (in Portuguese)
ANAC, Agência Nacional de Aviação Civil (2011a). Anexo 2 – Plano de Exploração Aeroportuária (PEA). Concessão para Constru-ção Parcial, Manutenção e Exploração do Aeroporto Internacional de São Gonçalo do Amarante. Brası́lia, DF. (in Portuguese) ANAC, Agência Nacional de Aviação Civil (2011b.). Anexo 13 – Metodologia de Cálculo do Fator X a Ser Aplicado no Primeiro
Reajuste Tarifário. Concessão para Construção Parcial, Manutenção e Exploração do Aeroporto Internacional de São Gon-çalo do Amarante. Brası́lia, DF. (in Portuguese)
ANAC, Agência Nacional de Aviação Civil (2013) Anexo 11 do Contrato de Concessão Fator X. Concessão para Ampliação, Manu-tenção e Exploração do Aeroporto Internacional Tancredo Neves/Con5ins. Brası́lia, DF. (in Portuguese)
ANAC, Agência Nacional de Aviação Civil (2014). Relatório de Atividades 2013. p. 107. Brası́lia, DF. (in Portuguese) ANAC, Agência Nacional de Aviação Civil (2014a). Resolução n°350 de 19 dez. 2014. Brası́lia, DF. (in Portuguese)
ANAC, Agência Nacional de Aviação Civil (2015) Regulação Econômica de Aeroportos – Atuação da ANAC no âmbito da regula-ção econômica de tarifas aeroportuárias e preços especı́ icos. Apresentaregula-ção. ONLINE. Brası́lia, DF. (in Portuguese) ANAC, Agência Nacional de Aviação Civil (2017) Concessões. ONLINE. (in Portuguese)
ANAC, Agência Nacional de Aviação Civil (2017a) Tarifas Aeroportuárias - Valor Teto das Tarifas de Embarque. Available in: <https://goo.gl/j6Ygv9> (acess 12/06/2016). (in Portuguese)
ANAC, Agência Nacional de Aviação Civil (2017b) Demanda e Oferta do Transporte Aéreo – Empresas Brasileiras. Available in: < https://goo.gl/wXi47z> (acess 12/06/2016). (in Portuguese)
Arblaster, M. (2017) Light-Handed Regulation of Airport Services: An alternative approach to direct regulation? Chapter 2 of The Economics of Airport Operations: Advances in Airline Economics, v. 6, 2017. p.15-47.
Australian Government. (2011) Economic Regulation of Airport Services. Productivity Commission Inquiry Report. Mel-bourne, n. 57. Available at: DOI: 10.1108/S2212-160920170000006002
BCB, Banco Central do Brasil (2017) Sistema Gerenciador de Séries Temporais – SGST. v. 2.1 Módulo público. ONLINE. (in Por-tuguese)
Biggar, D. (2012) Why Regulate Airports? A Re-examination of the Rationale for Airport Regulation. Jornal of Transport Eco-nomics and Policy, v. 46, part 3, p. 367-380. Available at: http://www.jstor.org/stable/24396317
Brazil. (1973) Lei N° 6.009, de 26 de dezembro de 1973. Dispõe sobre a utilização e a exploração dos aeroportos, das facilida-des a navegação aérea e dá outras providências. Diário O icial [da] República Federativa do Brazil. Brası́lia, DF. DOFC de 28/12/1973, p. 13417. (in Portuguese)
Brazil. Constituição (1988). Constituição [da] República Federativa do Brasil. Senado Federal. Brası́lia, DF. (in Portuguese) Brazil. (2011) Decreto n° 7.624, de 22 de novembro de 2011. Dispõe sobre as condições de exploração pela iniciativa privada da
infraestrutura aeroportuária, por meio de concessão. Diário O icial [da] República Federativa do Brasil. Brası́lia, DF. (in Por-tuguese)
Brazil. (2011b) Medida Provisória n° 551, de 22 de novembro de 2011. Altera Dispositivos das Leis nº 7.920, de 12 de dezembro de 1989, nº 9.825, de 23 de agosto de 1999, nº 8.399, de 7 de janeiro de 1992, nº 6.009, de 26 de dezembro de 1973, nº 5.862, de 12 de dezembro de 1972, nº 12.462, de 5 de agosto de 2011; e dá outras providências. Diário O icial [da] República Fede-rativa do Brasil. Brası́lia, DF. (in Portuguese)
Brazil. (2012) Lei n° 12.648, de 17 de maio de 2012. Altera dispositivos das Lei n° 7.920, de 12 de dezembro de 1989. Diário O icial [da] República Federativa do Brasil. Brası́lia, DF. (in Portuguese)
Brazil. (1989) Lei n° 12.648, de 17 de maio de 2012. Altera dispositivos das Lei n° 7.920, de 12 de dezembro de 1989. Diário O icial [da] República Federativa do Brasil. Brası́lia, DF. (in Portuguese)
Brazil. (2016) Edital n° 1/2016 da Agência Nacional de Aviação Civil. Diário O icial da República Federativa do Brasil, Poder Executivo, DF, 01 de dezembro de 2016, Capı́tulo 3, n. 230, p. 126-127. (in Portuguese)
Campinas – Municı́pio de Campinas, SP. Lei n°12.392, de 20 de outubro de 2005. Lei que regula o ISSQN. Campinas, SP. (in Por-tuguese)
Cappa, J. Souza Filho, J. V. (2017) Análise da Evolução do Imposto Sobre Serviços na Arrecadação Tributária no Município de Campinas – SP. Revista de Polı́ticas Públicas, v. 21, n.1. Available at: DOI: 10.18764/2178-2865.v21n1p65-87 (in Portu-guese)
Curi, C., Gitto, S., Mancuso, P. (2010). New evidence on the ef5iciency of Itatian airports: A bootstrapped DEA analysis. Socio-Economic Planning Sciences, 45, 84-93. Available at: DOI: 10.1016/j.seps.2010.11.002
Czerny, A.I. (2006) Price-cap Regulation of Airports: Single-till Versus Dual-till. Journal of Regulatory Economics, ed. 30, vol. 1, p. 85-97. Available at: DOI: 10.1007/s11149-006-0010-9
Czerny, A.I.; Zhang, A. (2015) Single-Till versus Dual-Till Regulation of Airports. Tinbergen Institute Discussion Paper. Tinber-gen Institute, Amsterdam.
Daniel, J. I, Harback, K. T. (2009) Pricing the major hub airports. Journal of Urban Economics, v. 66, i. 1, p. 33-56.
Dempsey, P. S. (2008) Airport Finance. Air and Space Law, Graduation (Law Degrees and Certi5icate Programs), McGill Univer-sity.
Dumagan, J.C., Ball, V.E. (2009) Decomposing growth in revenues and cost into price, quantity and total factor productivity contributions. Applied Economics, 41, p. 2943-2953. Available at DOI: 10.1080/00036840701367549
Fadlaoui, A. (2012) Impact of Price Regulation on Airport Charges – Airport charges and price regulation in Germany. Airlines Magazine. Online Journal on Air Transport for Aviation Business Students and Professionals.
Fernandes, E., Pacheco, R.R. (2016) The Casual Relationship Between GDP and Domestic Air Passenger Traf ic in Brazil. Trans-portation Planning and Technology, 33 (7) p. 569-581. Available at: DOI: 10.1080/03081060.2010.512217
Fiuza, E.P.S.; Pioner, H.M. (2009) Regulamentação e Concorrência no Setor de Aeroportos. Série Estudos Regulatórios. Direção Nacional do Projeto BRA/01/801 ANAC-ICAO, Rio de Janeiro, RJ. (in Portuguese)
Fuhr, J. The Institutional Arrangements Between Airlines, Airports, and Handling Companies: A Transaction Cost Assessment. The Technical University of Berlin for obtaining the academic degree (The faculty of Economics and Management). Berlin, 2008.
Gujarati, D. N.; Porter, D. C. (2012) Basic Econometrics. 5 ed. McGraw-Hill.
IATA (2017b) International Air Transport Association. Economic Regulation of Airports and Air Navigation Services Providers. Airport and ATC Charges Positions. ONLINE.
ICAO (2013) International Civil Aviation Organization. International. Airport Economics Manual. Doc 9562. Third Edition. Montreal.
INFRAERO (2012). Empresa Brazileira de Infraestrutura Aeroportuária. Relatório Anual 2011. Brası́lia, DF. (in Portuguese) Littlechild, S. C. (2012). German Airport Regulation: framework agreements, civil law and the EU Directive. Jounal of Air
Transport Management, v. 21, p. 63-75. DOI: 10.1016/j.jairtraman.2011.12.018
Martı́n, J.C., Socorro, M.P. (2009) A new era for airport regulators through capacity investments. Transportation Research Part A, v.43, p.618-625. Available at DOI: 10.1016/j.tra.2009.04.001
Phang, S.-Y. (2016) A General Framework for Price Regulation of Airports. Journal of Air Transport Management, v.51, p.39-45. Available at DOI: 10.1016/j.jairtraman.2015.11.001
Tadeu, H. F. B. (2011) Logística Aeroportuária – Análises setoriais e o modelo de cidades-aeroportos. Campinas: Cengage Learn-ing, 296 p. (in Portuguese)
Vasigh, B.; Fleming, K.; Tacker, T. (2013) Introduction to Air Transport Economics: From Theory to Applications. ed. 2. Ashgate Publishing.
Vega, D. J. G. (2012) A Methodology to Forecast Air Transportation Demand with Alternative Econometric Models. Thesis pre- sented to the Instituto Tecnológico de Aeronáutica, in partial ful5illment of the requirements for the Degree of Master in Sci-ence. São José dos Campos, SP.
Viracopos – Aeroportos Brasil (2015). Estatística e Publicações. Resumo da Movimentação Aeroportuária de 2014. Institucional. ONLINE. (in Portuguese)
Viracopos – Aeroportos Brasil (2017) Governança Corporativa. Demonstrações Financeiras. Institucional. ONLINE. (in Portu-guese)
Vojvodic, K. (2008) Airport Concession. ed. 1. EKON. MISAO PRAKSA DBK GOD XVII, p. 95-104. Vose, D. (2008) Risk Analysis: A quantitative guide. 3° Ed. John Wiley and Sons, p. 752.
RFB, RECEITA FEDERAL BRAZILEIRA (2012) Instrução Normativa RFB n° 1.540, de 05 de janeiro de 2015. Diário O icial [da] República Federativa do Brasil. Brası́lia, DF. (in Portuguese)
Salgado, L. H., Fiuza, E. (2009) Marcos Regulatórios no Brazil – É tempo de Rever Regras? IPEA - Instituto de Pesquisa Econô-mica Aplicada. Secretaria de Assuntos Estratégicos da BRAZIL. Rio de Janeiro. (in Portuguese)
Senado Federal (2016a) Projeto de Lei do Senado N° 258. Brası́lia, DF. (in Portuguese)
Serebrisky, T. (2012). Airport Economics in Latin America and the Caribbean: Benchmarking, Regulation and Pricing. Direc-tions in Development: Insfraestructure. The World Bank, Washington, D.C. Available at DOI: 10.1596/978-0-8213-8977-5
Sousa, E. (2014) Retorno Operacional Sobre o Ativo (ROA): Análise do desempenho das companhias listadas no Segmento Novo Mercado da BMandFBOVESPA. Anais do 5° Congresso UFSC de Controladoria e Finanças and Iniciação Cientı́ ica em Conta-bilidade. Florianópolis. (in Portuguese)
Starkie, D.; Yarrow, G. (2013) Why Airports Can Face Price-Elastic Demands: margins, lumpiness and leveraged passenger losses. International Transport Forum.
TRB (2010) Transportation Research Board. Developing an Airport Performance-Measurement System. Airport Cooperative Research Program – ACRP Report 19. Washington, DC. Available at DOI: 10.17226/14428
Yang, H.; Fu, X. (2015) A Comparison of Price-Cap and Light-handed Airport Regulation with Demand Uncertainty. Transporta-tion Research Part B. Available at DOI: 10.1016/j.trb.2015.02.002
Yang, H.; Zhang A. (2011) Price-cap Regulation of Congested Airports. Journal of Regulatory Economics, v. 39, pp. 293-312. Young, S.; Wells, A. (2014) Aeroportos – Planejamento e Gestão. 6° Ed. Porto Alegre: Bookman, 539 p. (in Portuguese)