INÊS BEATRIZ CASTRO MAIA
2019
OPTIMIZATION OF EMILIANIA HUXLEYI
GROWTH FOR PRODUCTION OF n-3
POLYUNSATURATED FATTY ACIDS AND NOVEL
COMPOUNDS WITH OSTEOGENIC ACTIVITY
INÊS BEATRIZ CASTRO MAIA
Mestrado em Biologia Molecular e Microbiana
Trabalho efetuado sob a orientação de:
Professor Doutor João Carlos Serafim Varela
Professora Doutora Luísa Paula Viola Afonso Barreira
2019
OPTIMIZATION OF EMILIANIA HUXLEYI
GROWTH FOR PRODUCTION OF n-3
POLYUNSATURATED FATTY ACIDS AND
NOVEL COMPOUNDS WITH OSTEOGENIC
ACTIVITY
Optimization of Emiliania huxleyi growth for production of n-3
polyunsaturated fatty acids and novel compounds with osteogenic activity.
Declaração de autoria de trabalho
Declaro ser a autora deste trabalho, que é original e inédito. Autores e trabalhos consultados estão devidamente citados no texto e constam da listagem de referências incluída.
Copyright
A Universidade do Algarve reserva para si o direito, em conformidade com o disposto no Código do Direito de Autor e dos Direitos Conexos, de arquivar, reproduzir e publicar a obra, independentemente do meio utilizado, bem como de a divulgar através de repositórios científicos e de admitir a sua cópia e distribuição para fins meramente educacionais ou de investigação e não comerciais, conquanto seja dado o devido crédito ao autor e editor respetivos.
i Ao professor João Varela e à professora Luísa Barreira, um muito obrigado por esta oportunidade, por toda a confiança que colocaram em mim e por toda a disponibilidade durante este ano. Sinto-me realmente sortuda.
Ainda ao professor João Varela, por dizer sempre que Sim sempre que lhe bato à porta, várias vezes ao dia, pela (muita) paciência e por todo o excelente trabalho.
Ao Dr. João Navalho da empresa Necton S.A. pela oportunidade, pela confiança e por toda a ajuda e orientação durante o desenvolvimento desta tese.
Ao Hugo, por todo o apoio e ajuda durante este (longo) ano. Por toda a disponibilidade e capacidade de “apaga fogos”. Por ter aturado todos os mini ataques de pânico, crises existenciais e stresses que, afinal, não tinham razão de ser. Mas já está mesmo quase a acabar!
À Tamára, por toda a ajuda e tudo o que me ensinou durante este ano. Por se dividir em mil e estar lá sempre para ensinar e para mandar vir quando é preciso, pelos dias bons e pelos de mau humor que depois até passam com a minha simpatia.
A toda a equipa da Necton S.A., em especial à Ana e à Inês, por tudo o que me ensinaram e ainda vão ensinar, por estarem lá para me animarem e me darem alguma perspetiva quando as coisas correram menos bem e por se rirem comigo quando correram muito bem. Mas, principalmente, pela amizade. Essa, levo-a comigo.
Ao grupo BIOSKEL, em especial ao Marco, pela transferência de conhecimento, pela ajuda e paciência no desenvolvimento do trabalho experimental com os peixe-zebra. Aos meus colegas do grupo MarBiotech, pela amizade, pela ajuda, pela companhia e pelas longas horas. E à Marta porque, afinal, somos o turno da noite!
À Tânia e ao João, pela excelente amizade, pela ajuda, pela paciência… por tudo na verdade! Estamos os três no mesmo barco.
Aos meus amigos, os antigos e os novos que fiz pelo caminho. Por estarem sempre presentes, por todos os momentos e apoio, não só agora, mas sempre.
Ao Bruno, pela imensa paciência com o meu cansaço e mau humor, por todo o carinho e pelas palavras certas nos momentos certos. Por me fazer rir quando estava mesmo a precisar. Por tudo.
E, por último, aos meus pais e à minha irmã. Por todo o esforço que fizeram para eu chegar até aqui. Por todo o gigante e incansável apoio, por acreditarem sempre em mim até mesmo quando eu não acreditei.
Esta tese não é só minha, mas é um bocadinho de cada um de vocês.
Um gigante e sincero Obrigada.
ACKNOWLEDGEMENTS
ACKNOWLEDGEMENTS
ACKNOWLEDGEMENTS
ACKNOWLEDGEMENTS
ACKNOWLEDGEMENTS
ACKNOWLEDGEMENTS
ACKNOWLEDGEMENTS
ACKNOWLEDGEMENTS
iii
Emiliania huxleyi é uma das mais abundantes espécies de cocolitoforídeos
(Haptophyta) e é responsável por vastos blooms em todo o mundo, sendo até visíveis do espaço. A abundância de E. huxleyi nos oceanos sugere fortemente que é uma microalga promissora para a produção industrial de larga escala, com possíveis aplicações biotecnológicas. A sua capacidade de calcificação, devido à produção de placas de calcite, sugere ainda que poderá ser usada para estudos de acidificação dos oceanos, com potencial para mitigação de CO2.
E. huxleyi é um organismo unicelular com um reduzido tamanho (4-6 µm) que
produz cocólitos em vesículas intracelulares especializadas. Possui também um ciclo de vida haplo-diplonte complexo, com 3 tipos celulares diferentes: células portadoras de cocólitos (células C diploides), células nuas não-móveis (células N) e células móveis portadores de escamas (células S haploides). Os diferentes tipos celulares podem ser induzidos durante o ciclo de vida, levando à diferenciação celular. O ciclo de vida haplo-diplonte tem também um papel muito importante para a sobrevivência da espécie.
Esta espécie possui várias caraterísticas com interesse biotecnológico, devido à síntese de ácidos gordos polinsaturados de elevado valor comercial e à produção de pigmentos que poderão servir como substitutos de colorantes artificiais. Além disso, E.
huxleyi possui ainda uma caraterística diferente de outras espécies de microalgas mais
produzidas industrialmente, que é a produção de cocólitos formados por CaCO3. Estes
cocólitos demonstram também grande potencial, com aplicações em nanotecnologia ou ainda como substitutos à calcite industrial. A produção de CaCO3 sugere ainda a presença
de compostos com atividade osteogénica.
Sete estirpes de E. huxleyi foram adquiridas, procedendo-se ao seu crescimento sob condições controladas. Das sete estirpes, a estirpe RCC1250 foi a selecionada, uma vez que foi a que respondeu melhor às condições de scale-up. Fatores abióticos importantes – meio de cultura, temperatura e intensidade luminosa – foram otimizados para a estirpe E. huxleyi RCC1250 através do uso de fotobiorreatores de escala laboratorial Algem®. Cada ensaio teve a duração de 11 dias, com a monitorização das culturas a cada 2 dias, que incluía: contagens celulares, fluorometria, determinação da concentração de NO3- e observações microscópicas. O desempenho de crescimento foi
iv superior usando Nutribloom® como meio de cultura, quando comparado com o crescimento observado com o meio de cultura K/2, que é considerado o meio de cultura “standard” para esta espécie. A concentração de NO3- também mostrou ser crucial para o
crescimento, em que o meio de cultura a uma concentração de NO3- de 0.6 mM
demonstrou ser inibitório, numa fase inicial do crescimento. Com este ensaio, ficou definido que o meio de cultura Nutribloom® a uma concentração de 0.3 mM de NO3- seria
adicionado no dia 0 e, quando a cultura atingisse uma densidade ótica de 1, esta concentração seria aumentada para 0.6 mM, com adição de meio de cultura a cada 2 dias. A temperatura ótima de crescimento correspondeu a 23 ºC, mas também houve crescimento aos 26 ºC, mostrando um certo nível de adaptação a temperaturas mais altas, o que será vantajoso para uma produção industrial no sul de Portugal. Determinou-se também que 900 µmol fotões/m2/s corresponde à intensidade luminosa ótima em termos
de densidade de fluxo de fotões. Foi ainda possível verificar a inibição da fotossíntese em culturas expostas a intensidades luminosas superiores a 1000 µmol fotões/m2/s. As
condições “standard” (meio de cultura K/2 a uma concentração de NO3- de 0.3 mM,
posteriormente aumentada para 0.6 mM, 17 ºC e 1219 µmol fotões/m2/s) foram também comparadas com as condições otimizadas (meio de cultura Nutribloom® a uma concentração de NO3- de 0.3 mM, posteriormente aumentada para 0.6 mM, 23 ºC e 900
µmol fotões/m2/s), resultando num aumento de crescimento significativo. No final dos ensaios nos fotobiorreatores Algem®, a biomassa foi recolhida por centrifugação e liofilizada para a determinação da composição bioquímica de E. huxleyi. Determinou-se também o conteúdo proteico e de pigmentos, a percentagem de lípidos totais e o perfil de ácidos gordos.
A biomassa produzida sob as condições standard continha elevadas quantidades de ácidos gordos saturados e monoinsaturados, nomeadamente os ácidos gordos mirístico, palmítico e oleico. No entanto, a biomassa produzida sob as condições otimizadas continha elevadas quantidades de ácidos gordos polinsaturados (PUFA), nomeadamente os ácidos octadecatetrenóico (OTA) e docosahexenóico (DHA), que são conhecidos pelo seu elevado valor comercial. Aumentaram ainda a produção dos PUFAs anteriores em 4 e 5 vezes, respetivamente. O conteúdo proteico foi também significativamente superior nas culturas expostas às condições otimizadas. Elevadas quantidades de 19’-hexanoilofucoxantina e fucoxantina foram também obtidas sob condições otimizadas, com um aumento de 3 e 2 vezes, respetivamente. O potencial osteogénico de vários extratos de E. huxleyi (etanol, acetato de etilo e água) foi avaliado em larvas de
peixe-v zebra (Danio rerio) com 3 dias pós-fertilização, expostas por 3 dias a várias concentrações de cada extrato. Os extratos testados não afetaram a área da cabeça das larvas, sendo este o parâmetro usado para a correção da área do opérculo. Análises morfométricas das larvas coloradas com alizarin-red revelaram que o extrato etanólico a 10 µg/mL e 1 µg/mL aumentaram, respetivamente, a área do opérculo em 20 e 11% sobre o controlo (o primeiro tão alto quanto o controlo positivo). A aplicação do extrato de acetato de etilo também levou a um aumento do opérculo em 12% a 100 µg/mL, enquanto o extrato de água não demonstrou nenhum efeito significativo no crescimento do osso. Este ensaio mostrou a presença de compostos pro-osteogénicos, com potencial para desenvolvimento de um novo fármaco.
Em conclusão, o presente estudo revelou uma nova perspetiva no impacto dos fatores abióticos no crescimento de E. huxleyi RCC1250. O meio de cultura e a sua concentração de NO3- demonstrou ter um papel fundamental no crescimento desta estirpe,
assim como a temperatura e a intensidade luminosa. A otimização destes parâmetros levou também a um aumento significativo na produção de compostos de elevado valor comercial, como PUFAs n-3, fucoxantina e 19’-hexanoilofucoxantina. Deste modo, este trabalho não só permitiu o estabelecimento de um novo protocolo para o melhoramento do crescimento de E. huxleyi, mas também mostrou o seu potencial como uma fonte de compostos de elevado valor comercial e de importantes metabolitos secundários com atividade osteogénica na biomassa produzida.
Palavras-chave:
Microalga marinha; Emiliania huxleyi; fotobioreatores Algem®; atividade osteogénica;
vii
Emiliania huxleyi is one of the most abundant species of coccolithophores
(Haptophyta) and is responsible for extensive blooms worldwide. The widespread abundance of E. huxleyi suggests that it may be a promising species for industrial production with high potential for biotechnological applications. Important abiotic factors – culture media, temperature and light intensity – were optimized for E. huxleyi RCC1250 using lab-scale Algem® photobioreactors. Growth performance was higher using Nutribloom® as culture medium as compared to K/2, which is the considered to be the “standard” medium for this species. Optimal temperature and light intensity were, respectively, 23ºC and 900 µmol photons/m2/s in Nutribloom® growth medium. The biomass produced contained high amounts of polyunsaturated fatty acids (PUFA), in particular octadecatetraenoic (OTA) and docosahexaenoic acids (DHA), which are known to have high market value. Optimized conditions increased the production of these PUFAs by 5- and 4-fold, respectively. High amounts of 19’-hexanoyloxyfucoxanthin and fucoxanthin were also achieved under optimized conditions with an increase of 2- and 3-fold. The osteogenic potential of several E. huxleyi extracts (i.e., ethanol, ethyl acetate and water) was assessed in zebrafish (Danio rerio) larvae at 3 days post-fertilization exposed for 3 days to a range of concentrations of each extract. Morphometric analysis of alizarin red-stained larvae revealed that the ethanolic extract at 10 µg/mL and 1 µg/mL increased, respectively, the operculum area by 20 and 11% over the control (the former as high as the positive control). Ethyl acetate extract also induced an operculum increase of 12% at 100 µg/mL, whereas water extract did not show any significant effect on bone growth. In conclusion, this work has not only established a new protocol to improve E.
huxleyi growth performance but has shown the presence of high-value compounds and
important secondary metabolites with osteogenic activity in the produced biomass.
Keywords:
Marine microalgae; Emiliania huxleyi; Algem® photobioreactors; osteogenic activity;
Danio rerio.
ABSTRACT
ABSTRACT
ABSTRACT
ABSTRACT
ABSTRACT
ABSTRACT
ABSTRACT
ABSTRACT
ix
ACKNOWLEDGEMENTS ... i
RESUMO ... iii
ABSTRACT ... vii
INDEX - FIGURES ... xi
INDEX - TABLES ... xiii
GLOSSARY ... xv
I INTRODUCTION ... 1
1.1. MICROALGAE ... 1
1.2. HAPTOPHYTA ... 3
1.3. COCCOLITHOPHORES ... 3
1.4. COCCOLITHOPHORES AND THE GLOBAL CARBON CYCLE ... 4
II EMILIANIA HUXLEYI ... 7
2.1. MORPHOLOGY OF EMILIANIA HUXLEYI ... 7
2.2. LIFE CYCLE OF EMILIANIA HUXLEYI ... 9
2.3. GROWTH PERFORMANCE AND CULTURE CONDITIONS ... 10
2.4. BIOCHEMICAL COMPOSITION ... 16 2.4.1. PROTEINS... 16 2.4.2. AMINOACIDS ... 16 2.4.3. LIPIDS ... 16 2.4.4. FATTY ACIDS ... 17 2.4.5. CARBOHYDRATES ... 17
2.4.6. PIGMENT AND CAROTENOID COMPOSITION ... 19
2.4.7. VITAMINS ... 19
2.5. BIOTECHNOLOGICAL APLICATIONS OF EMILIANIA HUXLYEI ... 19
2.5.1. OSTEOGENIC ACTIVITY ... 20
III OBJECTIVES ... 23
IV MATERIAL AND METHODS ... 25
4.1. SCALE-UP PROCESS ... 25
4.1.1. LAB-SCALE ALGEM® PHOTOBIOREACTORS ... 25
4.1.2. PARAMETERS FOR GROWTH OPTIMIZATION ... 27
4.1.3. ALGEM® INOCULATION ... 28
4.1.4. CULTURE MONITORING ... 28
4.2. BIOCHEMICAL COMPOSITION OF E. HUXLEYI ... 31
4.2.1. PROTEINS... 31
INDEX
INDEX
INDEX
INDEX
INDEX
INDEX
INDEX
INDEX
x
4.2.2. LIPIDS ... 31
4.2.3. PIGMENTS ... 32
4.2.4. FATTY ACIDS ... 33
4.3.1. BIOMASS PRODUCTION AND COLLECTION ... 35
4.3.2. EXTRACTS PREPARATION ... 35
4.3.3. ETHICS STATEMENT ON ANIMAL EXPERIMENTS ... 36
4.3.4. ZEBRAFISH PRODUCTION ... 36
4.3.5. EXPOSURE TO DIFFERENT EXTRACTS ... 36
4.3.6. IMAGE ACQUISITION ... 37
4.3.7. MORPHOMETRIC ANALYSIS ... 37
4.3.8. STATISTICAL ANALYSIS ... 38
V RESULTS AND DISCUSSION ... 39
5.1. GROWTH OPTIMIZATON ... 39
5.1.1. CULTURE MEDIA OPTIMIZATION ... 39
5.1.2. TEMPERATURE OPTIMIZATION ... 43
5.1.3. LIGHT INTENSITY OPTIMIZATION ... 46
5.1.4. STANDARD CONDITIONS VS OPTIMIZED CONDITIONS ... 50
5.2. BIOCHEMICAL COMPOSITION ... 56
5.2.1. PROTEINS... 56
5.2.2. LIPIDS ... 56
5.2.3. FATTY ACIDS COMPOSITION ... 57
5.2.4. PIGMENT AND CAROTENOID COMPOSITION ... 61
5.3. OSTEOGENIC ACTIVITY ... 63
VI CONCLUSIONS ... 66
REFERENCES ... 68
xi
Figure 1 – Schematic representation of the biological carbon pump, carbonate counter-pump
and carbon cycle. ... 6
Figure 2 - Scanning electron microscopy of the different morphotypes and coccoliths present in Emiliania huxleyi. ... 8
Figure 3 – Life cycle of the coccolithophore Emiliania huxleyi. ... 9
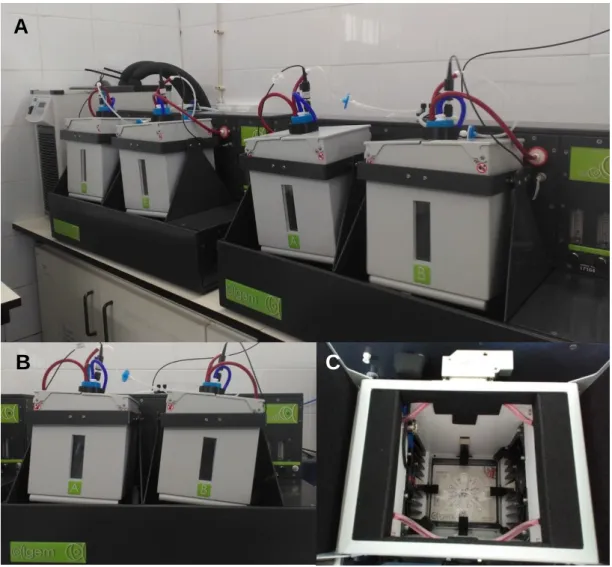
Figure 4 - Algem® PBR array at Necton’s facility. ... 26
Figure 5– Example of a profile used in a trial using the Algem® software. ... 27
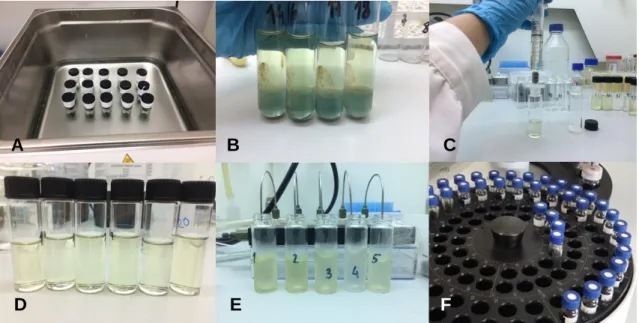
Figure 6– Some of the steps of total lipid quantification. ... 32
Figure 7 – Some of the steps of the fatty acids samples. ... 34
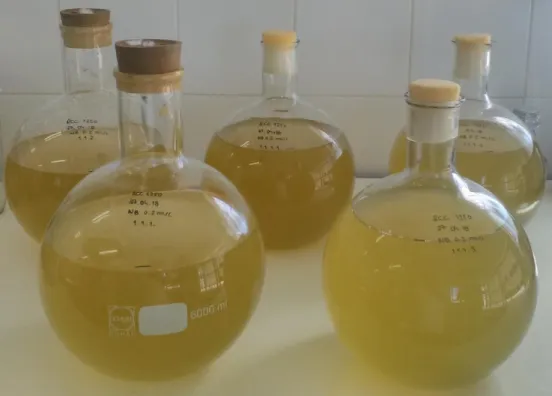
Figure 8 – Production of biomass of E. huxleyi strain RCC 1250 at Necton’s facilities. ... 35
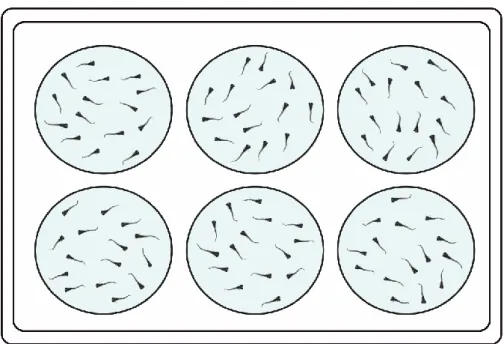
Figure 9 – Schematic representation of the experimental setup. ... 37
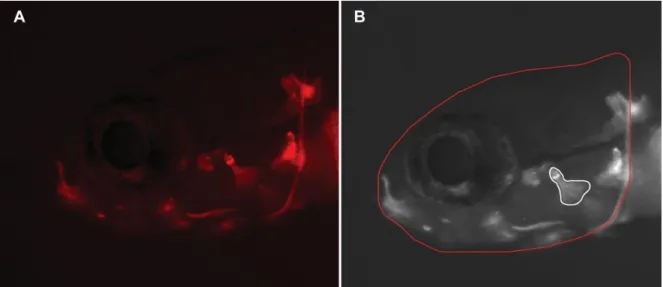
Figure 10 – Observations of zebrafish larvae (Danio rerio) using a MZ 7.5 fluorescence stereomicroscope. ... 38
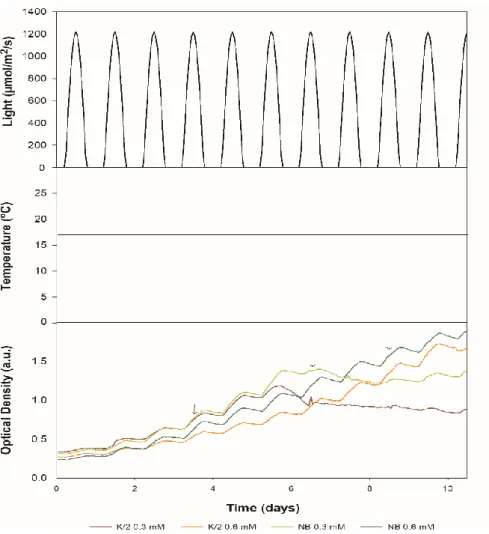
Figure 11– Growth performance of Emiliania huxleyi when exposed to different culture media and at different concentrations. ... 40
Figure 12 - Cultures at the end of the experiment grown in K/2 with 0.3 mM NO3- (A); K/2 with 0.6 mM NO3- (B); NB+ with 0.3 mM NO3- (C) and NB+ with 0.6 mM NO3- (D). ... 40
Figure 13 – Cellular concentration of the cultures exposed to different culture media at different concentrations. ... 41
Figure 14 – Rapid fluorescence induction kinetics (OJIP test) of Emiliania huxleyi cultures in the trial for culture media optimization. ... 42
Figure 15 – Growth performance of Emiliania huxleyi when exposed to different temperatures. Arrows represent the replenishment of culture media. ... 43
Figure 16 – Cultures at the end of the experiment, exposed to: 17º(A); 20º (B); 23º (C) and 26ºC (D). ... 44
Figure 17 – Cellular concentration of the cultures exposed to different temperatures. ... 44
Figure 18 – Rapid fluorescence induction kinetics (OJIP test) of Emiliania huxleyi cultures in the trial for temperature optimization. ... 45
Figure 19– Growth performance of Emiliania huxleyi when exposed to different light intensities. Arrows represent the replenishment of culture media. ... 47
xii
Figure 20 – Cultures at the end of the experiment, exposed to: 600(A); 900 (B); 1200 (C) and 1500 µmol photons/m2/s (D). ... 47
Figure 21– Cellular concentration of the cultures exposed to different light intensities……….48 Figure 22 - Rapid fluorescence induction kinetics (OJIP test) of Emiliania huxleyi cultures in
the trial for light intensity optimization. ... 49
Figure 23 – Growth performance of Emiliania huxleyi when exposed to standard and optimized
conditions. ... 51
Figure 24 – Cultures at the end of the experiment (day 11) exposed to standard (A) and
optimized conditions (B). ... 51
Figure 25 – Cellular concentration of the cultures exposed to standard and optimized
conditions. ... 52
Figure 26 – Rapid fluorescence induction kinetics (OJIP test) of Emiliania huxleyi cultures in
the trial of optimized conditions. ... 53
Figure 27 – Microscopic observations of Emiliania huxleyi under standard conditions, using
DIC and a 100 × lens with an additional 1.6 × amplification provided by an Optovar module. Scale bar = 5 µm. ... 55
Figura 28 – Microscopic observations of Emiliania huxleyi under optimized conditions, using
DIC and a 100 × lens with an additional 1.6 × amplification provided by an Optovar module. Scale bar = 5 µm. ... 55
Figura 29 – Example of a chromatogram obtained by HPLC when analysing a sample from the
culture exposed to optimized conditions. ... 62
Figure 30 – Effect of ethanol (A), ethyl acetate (B) and water extract (C) on the osteogenic
xiii
Table I: Compilation of experimental data from research made on Emiliania huxleyi, including
strains used, culture medium, growth temperature, pH, light cycle, irradiance, salinity, duration and sampling and growth rate. ... 12
Table II: Areas (A0) between the fluorescence curve and Fm of the OJIP test performed in the
culture media optimization trial. ... 42 Table III: Areas (A0) between the fluorescence curve and Fm of the OJIP test performed in the
temperature optimization trial. ... 46
Table IV: Averaged areas (A0) between the fluorescence curve and Fm of the OJIP test
performed at different light intensities. ... 48
Table V: Set of conditions (culture media, temperature and light intensity) used for each culture
in the Algem® PBRs. ... 50
Table VI: Averaged areas (A0) between the fluorescence curve and Fm of the OJIP test
performed on the standard vs optimization trial and respective standard deviation. ... 53
Table VII: Averaged non-photochemical quenching (NPQ) values performed in the standard vs
optimized conditions trial, and respective standard deviation. ... 54
Table VIII: Percentage of the protein content of Emiliania huxleyi cultures in the standard vs
optimized conditions trial. ... 56
Table IX: Percentage of total lipid content of Emiliania huxleyi cultures throughout the culture
conditions optimization. ... 57
Table X: Fatty acid profile of Emiliania huxleyi on the culture media optimization trial. Given
values are expressed as mean of total FAME percentages ± standard deviation. n.d., not
detected. ... 58
Tabela XI: Fatty acid profile of Emiliania huxleyi on the temperature optimization trial. Given
values are expressed as mean of total FAME percentages ± standard deviation. n.d., not
detected. ... 59
Table XII: Fatty acid profile of Emiliania huxleyi on the light intensity optimization trial.
Given values are expressed as mean of total FAME percentages ± standard deviation. n.d., not detected. ... 60
Table XIII: Fatty acid profile of Emiliania huxleyi on the standard vs. optimization trial. Given
values are expressed as mean of total FAME percentages ± standard deviation. n.d., not
detected. ... 61
Table XIV: Fucoxanthin and 19’-hexanoyloxyfucoxanthin concentration (µg/g) of Emiliania
huxleyi under standard and optimized conditions. Given values are in mean ± standard
deviation. ... 63
xv
A0 – Area above the fluorescence curve between F0 and Fm
AA – Amino acids AL – Actinic light ALA – α-linolenic CC – Cellular concentration CCHO – Carbohydrates CP – Coccolith polysaccharide
dCHO – Dissolved carbohydrates pCHO – Particulate carbohydrates
DHA – Docosahexaenoic acid DIC – Dissolved inorganic carbon dpf – Days post-fertilization DOC – Dissolved organic carbon DW – Dry weight
EA – Ethyl acetate
EPA – Eicosapentaenoic acid
EPAR – Photosynthetically active radiation
FA – Fatty acids
FAME – Fatty acid methyl esters
Fm – Maximum fluorescence F0 – Basal fluorescence hpf – Hours post-fertilization LA – Linoleic acid LC – Light-response curves L:D – light:dark
LEDs – Light-emitted diodes LOD – Limit of detection
xvi LOQ – Limit of quantification
ML – Measuring light
MUFA – Monounsaturated fatty acid n.a. – Not available
n.d. – Not detected NB+ - Nutribloom Plus
NPQ – Non-photochemical quenching OD – Optical density
ODA – Oleic acid
OJIP – Chlorophyll fluorescence induction kinetics OPA – Octadecapentaenoic acid
OTA – Octadecatetraenoic acid PBR – Photobioreactors
PFD – Photon flux density
PIC – Particulate inorganic carbon POC – Particulate organic carbon PSII – Photosystem II
PQ - Polyquinone
PUFA – Polyunsaturated fatty acids QY – Quantum yield
RCC – Roscoff Culture Collection RCII – Reaction center II
rETR – Relative electron transport rate
SFA – Saturated fatty acid TAG – Triacylglycerols
1
I
1.1. MICROALGAE
Microalgae are key organisms due to their role as primary producers (Custódio et al. 2012; Promdaen et al. 2014). They are a diverse group of photosynthetic microorganisms (Pulz & Gross 2004) with different sizes and morphotypes (Mendes et al. 2003; Drews-Jr et al. 2013; Pereira et al. 2013). These organisms are able to convert carbon dioxide into oxygen and other metabolites that can be used as food, feed and high value biochemicals (Walker et al. 2005; Spolaore et al. 2006; Pereira et al. 2011). Because of their higher photosynthetic rates resulting in higher efficiency in terms of CO2 fixation,
microalgae are also a very promising model for CO2 sequestration and mitigation and
could be an effective resource for applications with important environmental impact such as wastewater treatment, energy production (Hu et al. 2012; Hussain et al. 2017; Schulze et al. 2017), bioremediation, and nitrogen fixation (Malik 2002; Kalin et al. 2005; Muñoz & Guieysse 2006). Furthermore, the presence of important biomolecules in different microalgal strains reveal that these organisms are a good source of compounds that can be used in several areas, namely fatty acids, proteins, carotenoids, vitamins, phycobilins, sterols, polysaccharides, lipids (mainly triacylglycerols) and phenolics (Pulz & Gross 2004; Hu et al. 2008; Plaza et al. 2009; Guedes et al. 2011; Hemaiswarya et al. 2013; Pereira et al. 2015). When exposed to abiotic stress, microalgae can accumulate specific bioactive compounds as, for example, the production of high-value carotenoids (Coesel et al. 2008). The presence of compounds in the microalgal biomass that are responsible for various biological activities (e.g., cytotoxic, anticancer, antitumor, antibiotic, antioxidant, anti-inflammatory, antifungal, antiviral, anticholesterol, immuno-suppressive, hepatoprotective and neuroprotective activities) have also been described, underlining the importance of these microorganisms (Gouveia et al. 2008; Plaza et al. 2009; Patil et al. 2011; Pereira et al. 2011).
Even though they are microscopic, most microalgae possess some characteristics in common with higher plants (e.g., efficient oxygenic photosynthesis and simple nutritional requirements), having also other properties similar to those of bacterial cells, such as fast growth in liquid medium and accumulation and secretion of metabolites (Custódio et al. 2012). Industrial production of microalgal biomass is commonly achieved
2 in open (e.g., raceways) or closed (e.g., photobioreactors or fermenters) systems (Chisti 2007; Custódio et al. 2014; Pereira et al. 2015), thus enabling the production of large quantities of biomass and biomolecules (Sánchez et al. 2008). They are also very promising candidates in the process of CO2 mitigation (Thawechai et al. 2016; Yun et al.
2016; Hussain et al. 2017) and production of important bioproducts (Pereira et al. 2016). This is due to their high photosynthetic and growth rates and their ability to be cultivated on non-arable land (e.g., deserts; Haiduc et al. 2009; Mutanda et al. 2011). Moreover, they are able to grow at high biomass concentrations per unit area (25-30 t/ha/year in open ponds and 50-150 t/ha/year in photobioreactors; Haiduc et al. 2009), using non-potable water (sea- or wastewater; Thomas et al. 2016). In addition, some microalgae are able to grow at very high CO2 concentrations. In general, concentrations of 10-15% CO2 can be
used. However, Scenedesmus obliquus, Chlorella kessleri and Arthrospira sp. can grow at up to 18% CO2 and Chlorella sp. can withstand concentrations of 70-100% CO2 (Zhao
& Su 2014; Thawechai et al. 2016). Some microalgae are capable of tolerating extreme environmental conditions such as hypersaline environments, brackish water and a wide thermal range (Mutanda et al. 2011). Last but not least, they are able to produce several metabolites that can be used in different biotechnological fields: lipids for biodiesel (Chisti 2007; Pereira et al. 2016), biomass and pigments such as chlorophyll and carotenoids (Thawechai et al. 2016) for colouring scales of ornamental fish and the yolk of chicken eggs; and protective agents against sunburns (Varela et al. 2015). All these applications have the possibility of implementing zero-waste methodologies (Thomas et al. 2016) by means of the establishment of biorefineries.
To achieve a high growth rate in photoautotrophic microalgae, specific culture parameters must be controlled, namely CO2, nitrogen, phosphorus, iron and trace metals,
temperature, pH and a light source, which can be natural (sunlight) or artificial (e.g., light-emitting diodes; Chandra et al. 2011; Schulze et al. 2014).
Because microalgae are highly biodiverse, they are classified into different taxonomic groups according to their evolutionary history (Drews-Jr et al. 2013). The taxonomic classification of algae is based on their phylogenetic relationships that usually coincides with the classes of pigments they can biosynthesize. Some very important taxa include the Chlorophyta (green algae), Rhodophyta (red algae), Bacillariophyceae (diatoms), Dinoflagellata (dinoflagellates) and Haptophyta (haptophytes). Specifically, the coccolithophores such as Emiliania huxleyi, are classified in the phylum Haptophyta (Adl et al. 2012; Keeling 2013; Burki et al. 2016).
3
1.2. HAPTOPHYTA
The phylum Haptophyta is now recognized as belonging to the Haptista super-group (Burki et al. 2016) and includes two classes: Pavlovophyceae and
Prymnesiophyceae (Adl et al. 2012). Haptophytes are abundant primary producers in
marine and freshwater environments (Andersen 2004; Keeling 2009), representing an important component of the ocean’s phytoplankton (Zapata et al. 2004). Nearly all known haptophytes are photosynthetic organisms that usually possess a haptonema, some of them forming large blooms (Andersen 2004; Keeling 2009). The haptonema is a microtubular appendix located between two closely equal flagella that serves the purpose of collecting food particles and/or attaching to surfaces. The haptonema is unique to the haptophytes, being often a feature used to diagnose their taxonomical classification (Kawachi et al. 1991; Andersen 2004; Billard and Inouye 2004).
The plastids of haptophytes were acquired through secondary endosymbiosis, and belong to the “red plastid lineage”, being surrounded by four membranes (Keeling 2010; Keeling 2013). The primary function of their chloroplasts is to carry out photosynthesis, having a wide range of light-harvesting pigments, including one or more types of chlorophyll c. To aid the microalgae to carry out photosynthesis, the flagella have autofluorescent substances (e.g., flavin and pterin) that have an important role in phototaxis (Jeffrey 1976; Kawai & Inouye 1989; Andersen 2004).
Haptophytes can show absence (naked cells) or presence of several types of cell coverings, with some having mineralized scales, others having only organic scales and some of them being surrounded by gelatinous material. Haptophytes that are able to produce calcified scales covering their cell body are called coccolithophores (Andersen 2004). These coccolithophores have an important role as a long-term sink of inorganic carbon and thus CO2 sequestration (Van Der Wal et al. 1995; Jordan & Chamberlain 1997;
Zapata et al. 2004).
1.3. COCCOLITHOPHORES
Coccolithophores are haptophytes belonging to the class Prymnesiophyceae (Billard & Inouye 2004; Adl et al. 2012). They have a very important role in the ocean, estimated to be responsible for half of the precipitation of CaCO3, which becomes part of
the deep sea sediment in the form of calcified cell coverings (Milliman 1993; Richier & Fiorini 2011). Even though coccolithophores are able to export carbon as organic matter and calcite, they also release CO2 in the process of calcification (Read et al. 2013). These
4 microorganisms are able to produce mass blooms under certain environmental conditions (Tyrrell & Merico 2004; Poulton et al. 2010).
They are known for producing CaCO3 plates (coccoliths) that form their
exoskeleton (coccosphere), covering the cell surface (Müller et al. 2008; Read et al. 2013). Coccoliths can become detached from the cells when they are exposed to stress or even from healthy cells as they grow and age (Balch et al. 1996). However, high detachment rates often occur under nutrient stress (Balch et al. 1993; Poulton et al. 2010). The cell coverings of coccolithophores consist of several layers of organic scales (i.e., the coccoliths) that are connected together through fibrillary material with adhesive properties, calcifying the distal scales of the periplast (Billard & Inouye 2004). Coccolithophores can produce different types of coccoliths that are divided into two groups with different morphologies and origin: heterococcoliths and holococcoliths. Heterococcoliths are assembled from two different crystal units of variable size and shape. They are intracellularly produced, and later mineralized in the dictyosome-derived vesicles. Holococcoliths are formed from one single type of crystal that is smaller than the ones present in the heterococcoliths. It has been proposed that the organic base of these coccoliths develops in dictyosomes, but mineralization occurs outside the plasma membrane (Young et al. 1999; Billard & Inouye 2004; Dashiell 2010).
Even though the haptonema is a feature of haptophytes, it is often vestigial in various groups of coccolithophores or is even absent, as is in the case of Emiliania huxleyi (Billard & Inouye 2004). Regarding chloroplasts, coccolithophores normally have two golden-brown chloroplasts with chlorophylls a and c. In addition, each chloroplast contains a pyrenoid with 1,3-β-glucan (chrysolaminarin) as the main product of photosynthesis (Billard & Inouye 2004; Van Lenning et al. 2004).
1.4. COCCOLITHOPHORES AND THE GLOBAL CARBON CYCLE
Coccolithophores have a global impact in the geochemical surface-ocean processes, mainly due to the blooms produced by them (Tyrrell & Merico 2004; Poulton et al. 2010) that extend for several square kilometres and are visible from space (Holligan et al. 1993; Merico et al. 2003). They actively participate in gas exchange between the ocean and the atmosphere (CO2, O2 and dimethyl sulphide (DMS)) and in the export of
carbonate and organic matter to deep oceanic layers or even deep-sea floor (Fig. 1). They, along with the foraminifera, are responsible for the calcification that happens in the oceans (Rost & Riebesell 2004; Engel et al. 2009; Balch 2018), due to the production of
5 exoskeletons that act on an extensive range of geological and ecological time scales (de Vargas et al. 2007). Because coccolithophores are calcifying primary producers, they contribute to the biological carbon pump, to the carbonate counter-pump and to the global carbon cycle (Fig. 1; Rost & Riebesell 2004; de Vargas et al. 2007; Taylor et al. 2017) Because of their blooms, they are also responsible for half of the precipitation of CaCO3 in the oceans (Milliman 1993; de Vargas et al. 2007; Richier & Fiorini 2011).
The process of biomineralization carried out by coccolithophores has a great impact on the alkalinity and carbonate chemistry in the photic zone of the world’s oceans. The formation of CaCO3 in the form of calcite is frequently named as particulate
inorganic carbon (PIC) and it is thought that they contribute significantly for the decrease of atmospheric CO2 by two ways: 1) absorption of dissolved inorganic carbon (DIC) in
the form of HCO3- and 2) in the sedimentation of organic matter in the bottom of the
oceans due to cell death or coccolith release (de Vargas 2007; Balch 2018).
However, there has been some disagreement among authors on whether coccolithophores are the ideal microalgae for biotechnological processes of mitigation/sequestration of CO2 due to the release of CO2 in the precipitation process of
CaCO3:
Ca2++ 2HCO3− ↔ CaCO3+ CO2+ H2O (Urey, 1952)
It is evident that, for each two moles of consumed bicarbonate, one mole of CaCO3
is produced along with a mole of CO2. This shows that they also have an important role
in the ocean alkalinity pump (Balch 2018). Even though there is the consumption of an atom of carbon, this process will result in a short-term local source of atmospheric CO2
(de Vargas et al. 2007). Yet, it is known that this temporary increase is frequently compensated by the processes of sedimentation of organic material to the bottom of the ocean (Fig. 1; Rost & Riebesell 2004).
The biogenic carbonate produced constitutes an optimal material for aggregation of particulate organic carbon (POC) created by photosynthesis. Coccolithophores also contribute to the formation of organic debris in the form of dissolved organic carbon (DOC) or through the formation of POC as suspended cells in the water column or coccoliths (Engel et al. 2009; Taylor et al. 2017). The accumulation of coccoliths into marine snow ballasts organic matter and other debris—which would not sink to deep oceanic layers or to the deep-sea floor any other way—is a main driver of the organic carbon pump. Therefore, coccolithophores are an important factor for the removal of CO2
6 The biotechnological processes proposed for coccolithophores mimic not only the formation of calcite in the form of coccoliths but also the sequestration of carbon in organic material, since the biomass of the microalga is collected, having a high commercial value.
This group – coccolithophores - has been widely studied to understand their biochemical processes and role in the carbon cycle of the ocean, mainly the coccolithophore Emiliania huxleyi that serves as a model due to their high abundance in blooms occurring in the world’s oceans.
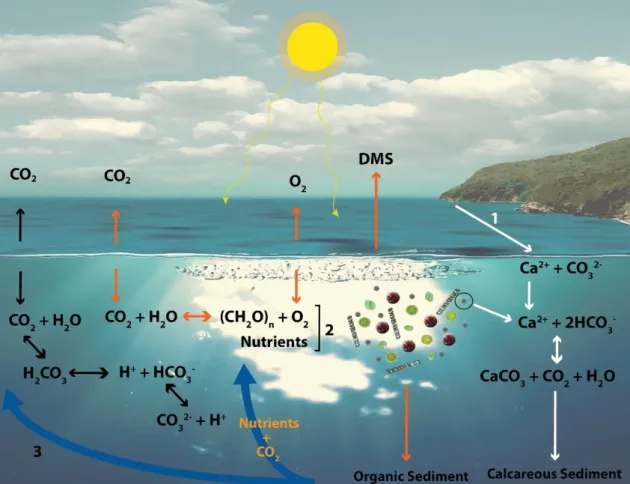
Figure 1 – Schematic representation of the biological carbon pump, carbonate counter-pump and carbon
cycle. CO2 can enter the ocean through the atmosphere or through the (1) weathering of calcite rock. Part of the atmospheric CO2 that enters the ocean - carbon cycle (black arrows) - is converted into H2CO3 which, in turn, dissociates into protons and HCO3- that can be, again, dissociated into protons and CO32-. However, the atmospheric CO2 can also enter the biological carbon pump (orange arrows). CO2, water and light are used in photosynthesis, originating oxygen, DMS and (2) phytoplankton growth that represent the primary producers. A group of these producers (coccolithophores) can also fix carbon (carbonate counter-pump; white arrows), as they use Ca2+ and 2HCO
3- to produce CaCO3. During this process, there is the release of CO2 and water, resulting in a local increase of CO2. However, part of the biomass produced will result in organic sediment and the coccoliths produced will result in calcareous sediment. These sediments can later be remobilized due to the action of upwelling currents (3, orange text), providing more nutrients and CO2 for phytoplankton growth.
7
II
Emiliania huxleyi (Lohmann) Hay and Mohler represents one of the most
abundant calcifying planktonic microalgae (Richier & Fiorini 2011) and one of the most productive coccolithophores (Barcelos e Ramos et al. 2010; Jakob et al. 2017), accounting for up to 20-50% of the total coccolithophore community present in oceanic blooms (Westbroek et al. 1993). These can occupy areas greater than 100,000 km2 (Brown & Yoder 1994; Laguna et al. 2001), being visible in satellite images (Holligan et al. 1993), which detect the shedding of highly reflective coccoliths produced by them (Poulton et al. 2013). The widespread abundance of E. huxleyi and its ability to calcify body scales strongly suggests that this is a promising species to study ocean acidification (Young et al. 2014) with potential for CO2 mitigation and sequestration (Riebesell 2004; Young et
al. 2014). The physiology and molecular ecology of this species has been studied extensively (Paasche 2002; von Dassow et al. 2009; Rokitta et al. 2011), because of its impact on the biosphere, enhancing the fluxes of several important elements (oxygen, carbon and sulphur) between the atmosphere, the ocean and the ocean floor (Westbroek et al. 1993; Rost & Riebesell 2004; Frada et al. 2012). E. huxleyi is capable of carbon fixation on a global scale due to its widespread distribution, ability to carry out photosynthesis and body scale calcification (Linschooten et al. 1991).
2.1. MORPHOLOGY OF EMILIANIA HUXLEYI
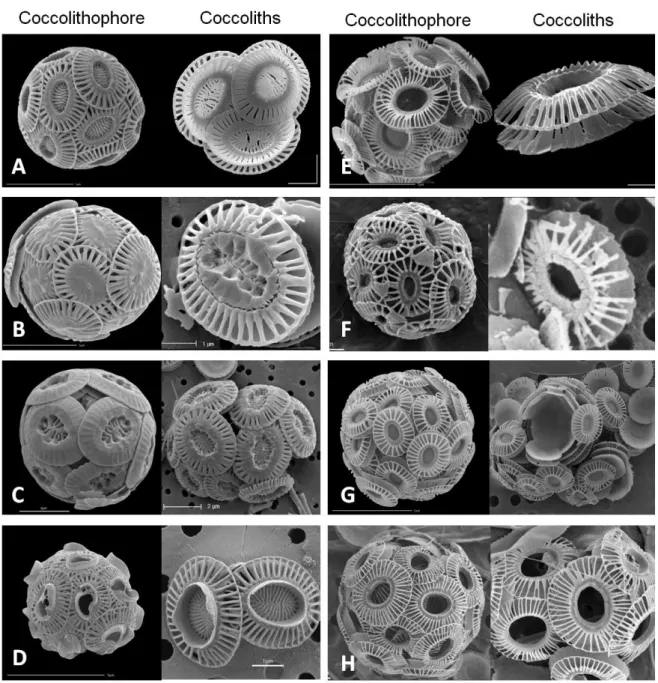
Morphologically, E. huxleyi is a unicellular organism with a small cell body size (4-6 µm; Klaveness 1972a, Paasche 2002) and relatively low amounts of chlorophyll a (Haxo 1985). The coccoliths (Jong et al. 1976; Laguna et al. 2001; Jakob et al. 2017) are formed intracellularly in a specialized vesicle (Klaveness 1972b; Borman et al. 1982), via controlled crystal growth, being excreted and assembled to form the coccosphere at a later stage. Each cell can produce between 10 to 15 coccoliths (Jakob et al. 2017). So far, eight morphotypes of E. huxleyi (Fig. 2) have been described (Paasche 2002; Beaufort et al. 2011; Cook et al. 2011; Hagino et al. 2011; Read et al. 2013). These differ in their genetic makeup, cell size, distribution, and coccolith morphology (Cook et al. 2011; Müller et al. 2017). Type A (Fig. 2A) and type B (Fig. 2E) are the best characterized. Type A is the most common and widespread morphotype and type B is distinctly less calcified than the former, but tend to produce more coccoliths per cell, though irregular ones (Paasche 2002;
8 Schroeder et al. 2005; Young et al. 2014). Type C (Fig. 2G) resembles type B, but cells are lighter and have smaller coccoliths with the central area open or covered with a delicate plate (Young & Westbroek 1991; Beaufort et al. 2011). Type B/C (Fig. 2F) is similar to both type B and C but have an intermediate size with delicate coccoliths (Young et al. 2003). Type O (Fig. 2H) is similar to type B but the coccoliths always have an open central-area (Hagino et al. 2011). Type R (Fig. 2C) presents extremely thick coccoliths similar to the ones produced by Reticulofenestra parvula (Paasche 2002; Cook et al. 2011). Type corona (Fig. 2D) is very similar to type A, however, they have a projection formed from inner elements protruding from the centre (Young & Westbroek 1991).
Figure 2 - Scanning electron microscopy of the different morphotypes and coccoliths present in Emiliania
huxleyi. (A) morphotype A; (B) morphotype A overcalcified; (C) morphotype R; (D) morphotype corona; (E)
morphotype B; (F) morphotype B/C; (G) morphotype C; (H) morphotype O. Adapted from Wei & Wise (1992) and Young et al. (2003).
9 Recently, an overcalcified morphotype (Type A overcalcified; Fig. 2B) was described where the relative abundance of individuals with this morphotype increases in acidic waters (Beaufort et al. 2011).
2.2. LIFE CYCLE OF EMILIANIA HUXLEYI
With a complex life cycle, E. huxleyi presents different cell types that include: i) C cells (coccolith-bearing coccolithophores) usually found in nature; ii) N cells (non-motile naked cells) that appear spontaneously in C cell cultures and iii) S cells (scale-bearing motile cells) with flagella that also appear spontaneously in cultures (Figure 3). Each cell type is capable of vegetative reproduction, with reports of C cells resulting in both N and S cells (Klaveness 1972b; Green et al. 1996; Laguna et al. 2001). Cell division within the C cell type can occur in two ways: i) after the cell contents escape from the coccosphere in the form of a naked cell where the daughter cells gradually produce coccoliths; or ii) it can happen via simple fission, where the original coccoliths are retained by the daughter cells (Paasche 1968). N cells do not form coccoliths and have a slower reproduction rate due to smaller chloroplasts. They are not part of the normal life cycle of E. huxleyi, but the appearance of C cells can be induced upon depletion of sodium nitrate (Wilbur & Watabe 1963; Paasche & Klaveness 1970). S cells differ from the N and C cells, primarily because they exhibit flagella. They also possess a single external layer of organic scales different from the scales produced by C cells (Klaveness 1972a). Beside these different cell types, E. huxleyi also presents a haplo-diplontic life cycle, with diploid C cells and the haploid S cells (Frada et al. 2008) playing an important role in the ecology of the species (Rokitta & Rost 2012). Haploid individuals are able to survive to
Figure 3 – Life cycle of the coccolithophore Emiliania huxleyi. Diploid cells are
represented by C (coccolith-bearing cells) and N cells (non-motile naked cells) and haploid cells by S cells (scale-bearing motile cells). Adapted from Paasche (2001).
10 stage-specific viruses that destroy blooms of diploid individuals. The endocytic vesicles, present only in diploid cells, might be the structures targeted by virus when under limiting bloom conditions. The virus infects the diploid cells and forces the termination of the bloom (Rokitta et al. 2011) through the up-regulation activity of the host metacaspase (Bidle et al. 2007). This action causes caspase-dependent programmed cell death, leading to population collapse (Mayers et al. 2016). On the other hand, haploid cells are apparently not affected by the virus. Thus, it has been suggested that meiosis might act as an escape strategy (Frada et al. 2008) to viral infection. This strategy has been named as “The Cheshire cat escape strategy”. Haploid cells are also likely to act as sexual gametes (Frada et al. 2012), possibly justifying the metabolic differences between haploid and diploid cells (Rokitta & Rost 2012). Even though they are the same species, the haploid form of E. huxleyi expresses different classes of genes as compared to those of the diploid form (Rokitta et al. 2011).
2.3. GROWTH PERFORMANCE AND CULTURE CONDITIONS
Because E. huxleyi is an interesting species from a biotechnological point of view, it was necessary to understand which strain was more appropriate to “domesticate” and grow, being able to withstand the climate in southern Portugal upon scale-up in outdoor pilot- and industrial-scale facilities. For this purpose, data was gathered about the available strains and it was possible to analyse how these strains were grown and which were better adapted to be cultivated in Portugal due to the information about the site and temperature from where they were isolated. A comprehensive literature review of growth experiments carried out in different E. huxleyi strains and the culture conditions used are presented in Table I.
The E. huxleyi strains used in most works were obtained from the National Center for Marine Algae and Microbiota (NCMA; formerly known as CCMP) and from the Roscoff Culture Collection (RCC). Guillard´s f/2 and K were the most used growth media to culture this microalga. Both of them were used in diluted form in some works (e.g., f/10 or K/2 media). In addition, the culture medium was often adjusted or supplemented, in particular when nutrient limitation experiments were carried out. Nitrate and phosphate were among the nutrients whose concentrations were frequently modified (e.g., Riegman et al. 2000; Stolte et al. 2000; Eltgroth et al. 2005; McKew et al. 2015; Skau et al. 2017). The temperature at which cultures were grown ranged between 13 and 25 ºC, with 15 ºC as the most reported temperature. Nevertheless, the highest growth rates were obtained in
11 experiments where cultures were grown between 20-21 ºC (Paasche & Klaveness 1970; Conte et al. 1998; Muller et al. 2008; Moheimani et al. 2011; Bartal et al. 2015; Hariskos et al. 2015; Jakob et al. 2018). The pH of most experiments varied between 7.5 and 8.7. Salinities above 30 were most frequently reported; however, salinities ranging from 23.7 to 38 can be found in the literature. The most frequent photoperiod chosen was a 16:8 light:dark (L:D) cycle followed by 12:12 and 24:0 L:D cycles. Upon comparison of the 24:0 and 12:12 L:D cycles, higher cell concentrations were obtained under the latter condition (Laguna et al. 2001). When comparing 24:0 and 16:8 L:D cycles, cultures under the former photoperiod showed a higher production of POC and PIC, but cultures under the 16:8 L:D photoperiod showed a higher ratio of PIC/POC (Zondervan et al. 2002). The photon flux density (PFD) ranged from 10 to 1500 µmol photons/m2/s. However, it has been shown that PFD above 500 µmol photons/m2/s causes photoinhibition in calcifying
strains. PFD at lower levels also gives rise to higher chlorophyll a content (Hariskos et al. 2015).
The initial cell concentration of inoculum cultures is of the outmost importance. A culture with a concentration of 105cells/mL seemed to be the most commonly used as an initial inoculum for batch cultures of about 15 days. Samples were usually taken during exponential growth phase and growth rates ranged from 0.13 to 2.8/day.
Concerning the volume of the culture, successful growth of E. huxleyi in 6-L flat-plate photobioreactors (PBR), 10-L carboy and 20-L custom made bag PBRs have been reported. In the 10-L carboy PBR, however, E. huxleyi showed a slower growth rate (Moheimani et al. 2011). E. huxleyi cultures were also produced in raceway ponds (200 L), but after two weeks the culture deteriorated due to contamination by ciliates and other microalgae (Moheimani 2005). For coccolith production, Jakob et al. (2018) achieved 5 g/Lin a 2-L stirred PBR under low carbon conditions. Aeration was not used since it causes cell damage caused by air bubble burst-associated shear stress (Chisti 2001; Moheimani et al. 2011; Jakob et al. 2018).
12
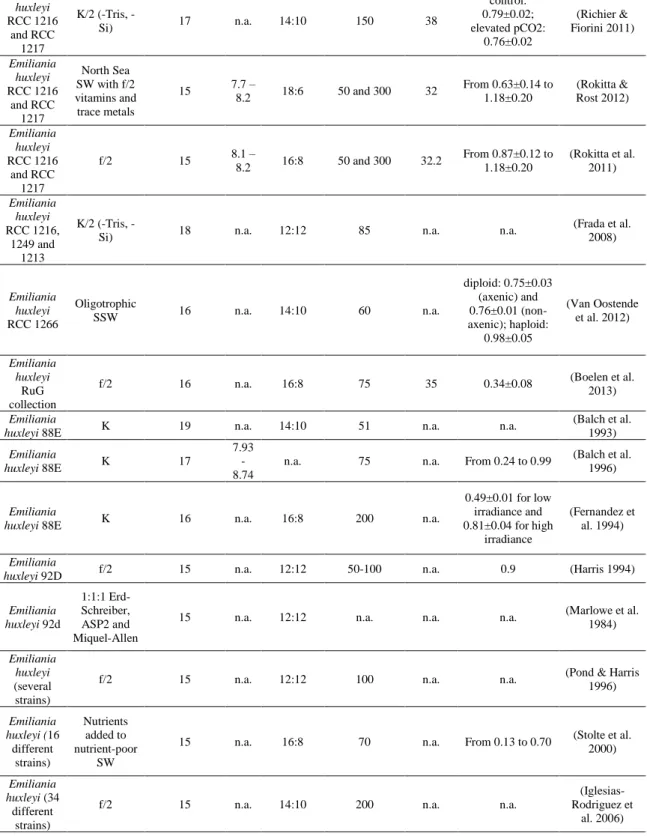
Table I: Compilation of experimental data from research made on Emiliania huxleyi, including strains
used, culture medium, growth temperature, pH, light cycle, irradiance, salinity, duration and sampling and growth rate. Species and strain Culture medium Growth temperature (ºC) pH Light cycle (L:D) PFD (µmol
photons/m2/s) Salinity Growth rate (d-1) References
Emiliania
huxleyi f/2 20 n.a. n.a. 56-70 n.a. n.a.
(Sumitra-Vijayaraghavan 1976) Emiliania huxley AC481 Surface
post-bloom SW 13 and 18 n.a. 14:10 150 35.6
Higher growth rate at 18ºC and present CO2: 0.15
(De Bodt et al. 2010)
Emiliania huxleyi
BOF92
Eppley and
f/25 18 n.a. 15:9 45 n.a. n.a.
(Nanninga et al. 1996) Emiliania huxleyi BOF92 Eppley and f/25 18 8.1 24:0 200 n.a. 2.6 and 2.8 (Nanninga & Tyrrell 1996) Emiliania
huxleyi B11 f/2 15 n.a. 14:10 30 and 300 n.a. 0.11 - 0.45
(Ragni et al. 2008) Emiliania huxleyi B92/21, G1779Ga, M181b, S.Africa, Van556 f/2 6, 9, 12, 15, 18, 21, 24, 27 and 30
n.a. 16:8 100-200 n.a. 1.75 at 21ºC (Conte et al. 1998)
Emiliania huxleyi BT6
D n.a. n.a. n.a. 12 n.a. n.a. (Haxo 1985)
Emiliania huxleyi
CCAP 920/2
ASW
supplemented 18 n.a. 12:12 80 n.a.
2.6 days (doubling
time) (Flynn 1990)
Emiliania huxleyi
CCMP 370
L1 15 n.a. 12:12 130 n.a. n.a. (Garrido et al. 2016) Emiliania huxleyi CCMP 370, 373, 374, 379
f/2 (-Si) 15 n.a. 14:10 100 n.a. n.a. (Strom et al. 2003) Emiliania huxleyi CCMP 371 f/2 23 n.a. 12:12 and 18:6 300; 350; 320 and 120-130 n.a. 0.99±0.06; dry weight productivity: 0.47±0.022 g/L/day (Moheimani et al. 2011) Emiliania huxleyi CCMP 371
f/50 21 n.a. 12:12 300 n.a. From 1.05 to 1.08 (Muller et al. 2008) Emiliania huxleyi CCMP 371 and CS-369 Pacific ASW in modified f/50 (CCMP371) and GSe/2 (CS-369) 18, 20 and 25 7.7-7.9 and 8.1-8.3 12:12 150-300 23.7-33.1 0.17±0.09 - 1.19±0.03; 1.38±0.09 at 23.7 ppt; 0.99±0.06 in plate PBR (Moheimani, 2005) Emiliania huxleyi CCMP 371 and RCC 1216 ESW 21 n.a. 24:0 10, 20, 50, 100, 300, 400, 500, 800, 1500
n.a. 1.1 (Hariskos et al. 2015)
Emiliania huxleyi
CCMP 373
f/2 (-Si) 23 n.a. 14:10 900 n.a. n.a. (Aluwihare & Repeta 1999) Emiliania huxleyi CCMP 373 and CCMP 370 f/2 15 n.a. 16:8 80-100 n.a. 0.47-0.70; no production of coccoliths (Wolfe & Steinke 1996)
13 Emiliania huxleyi CCMP 373 and CCMP 374
f/2 (-Si) 18 n.a. 14:10 450 n.a. 0.9 (Bidle et al. 2007) Emiliania huxleyi CCMP 1516 SW with f/2 metals and vitamins
20 n.a. 16:8 150 n.a. From 0.67±0.05 to 1.25±0.04 (Bartal et al. 2015) Emiliania huxleyi CCMP 1516
f/2 15 n.a. 14:10 250 n.a. n.a. (Evans et al. 2009) Emiliania huxleyi CCMP 1516 ASW supplemented with Erd-Schreiber’s SW 25 n.a. 24:0 100 n.a. (cell density on day 6 at 25ºC) 8.6±1.8 × 10⁶ cells/mL (Kotajima et al. 2014) Emiliania huxleyi CCMP 1516 f/50 or f/2 17-18 n.a. 24:0 or 12:12 600 n.a. n.a. (Laguna et al. 2001) Emiliania huxleyi CCMP 1516 ASW with f/8 trace metals and vitamins
18 n.a. 16:8 300 n.a. n.a. (McKew et al. 2015)
Emiliania huxleyi
CCMP 1516
f/2 (-Si) 18 n.a. 14:10 200 n.a.
2.5 × 10⁶ cells/ml (only cell abundance) (Rose et al. 2014) Emiliania huxleyi CCMP 1742, 1516, 370, 374
f/2 or f/20 16 n.a. 16:8 80 n.a. n.a. (Eltgroth et al. 2005)
Emiliania huxleyi
CCMP 2090
K/2 18 n.a. 16:8 100 n.a. n.a. (Shemi et al. 2016) Emiliania huxleyi CCMP 3266, CCMP 3268 and CCMP 2090
L1 (-Si) 18 n.a. 16:8 n.a. n.a. n.a. (Mayers et al. 2016) Emiliania huxleyi Ch24-90 and Ch25-90 f/2 10 and 15 7.98 - 8 16:8 70-155 n.a. 0.8-0.9 (van Bleijswijk et al. 1994) Emiliania huxleyi CS-57
f/2 20 n.a. 16:8 80 n.a. n.a. (Rontani et al. 2007)
Emiliania huxleyi
DWN 61/81/5
f/2 15 n.a. 12:12 100 n.a. n.a. (Bell & Pond 1996) Emiliania huxleyi EHSO 5.14 f/20 or f/80 14 7.48-8.06 24:0 100-115 35 0.2 (Müller et al. 2017) Emiliania huxleyi EHSO 5.30, 5.25, 5.28, 5.11, 6.17, 8.15
K 16 n.a. 12:12 70 n.a. 1.04 and 0.86 (Cook et al. 2011)
Emiliania
huxleyi F Eppley (-Si) 21 n.a. 24:0 196 30
1.42 (C-cells) and 1.68 (N-cells) (Paasche & Klaveness 1970) Emiliania
huxleyi IMR/2 17 n.a. n.a. 42 or 196 30 n.a.
(Klaveness 1972)
14 F61, F63, G4 Emiliania huxleyi F61 and 92 Droop and
Eppley (-Si) 19 n.a. n.a. 70 n.a. n.a.
(Jong et al. 1976) Emiliania huxleyi isolated f/2 pre-culture and f/20 for experiment 15 7.47 - 8.36 14:10 150 34 1.01 (Barcelos e Ramos et al. 2010) Emiliania huxleyi isolated
MNK 18 n.a. 18:6 n.a. n.a. n.a. (Hagino et al. 2011)
Emiliania huxleyi
isolated
IMR ½ 13 and 19 n.a. 14:10 170 30
Higher growth rate at high P: 0.855-1.045 (Skau et al. 2017) Emiliania huxleyi L f/50 or Eppley’s 18 8 16:8 90 n.a. 0.8 - 1.1 div/cell/4h (0.034 - 1.1) (Linschooten et al. 1991) Emiliania huxleyi L Prepared from SSW 15 8 24:0 200 n.a. 0.14 - 0.63 (Riegman et al. 2000) Emiliania huxleyi L and CCMP 370, 373, 374, 379 and 1516
f/2 (-Si) 15 n.a. 18:6 40 30 0.62 - 0.82 (Steinke et al. 1998)
Emiliania huxleyi L,
92, 92D and MCH
f/50 19 n.a. 16:8 n.a. n.a. n.a.
(Young & Westbroek 1991) Emiliania huxleyi NIES-837
MNK 20 n.a. 12:12 20-30 n.a. n.a. (Mizoguchi et al. 2011)
Emiliania huxleyi
NIES 873
Erd-Schreiber 20 n.a. 24:0 100 n.a. n.a.
(Obata & Shiraiwa 2005) Emiliania huxleyi PCC 92 and 92d
ESW 18 n.a. 24:0 n.a. n.a. n.a. (Vasconcelos et al. 2002)
Emiliania huxleyi
PCC 92 and 92d
f/10 18 8 24:0 n.a. 35 From 0.72 to 0.83 (Vasconcelos & Leal 2001) Emiliania huxleyi PML B92/11 Treated and supplemented SW with f/2 metals
14 and 18 7.97 16:8 300 32 0.1 and 0.3 (Borchard & Engel 2012) Emiliania huxleyi PML B92/11 f/2 14 8.24 16:8 19 33 0.2 (Borchard & Engel 2015) Emiliania huxleyi PML B92/11 f/2 15 7.8 – 8.6 24:0 and
16:8 15, 30 and 80 n.a. 1.11 (high [CO2])
(Zondervan et al. 2002)
Emiliania huxleyi
RCC 1216
ESAW 21 n.a. n.a. 350 n.a. 1.06 ± 0.01 (Jakob et al. 2018) Emiliania huxleyi RCC 1216 and RCC 1217 K/2 (Tris,
-Si) 17 n.a. 14:10 80 n.a.
0.843 ± 0.028 and 0.851 ± 0.004
(Dassow et al. 2009)
15 Emiliania huxleyi RCC 1216 and RCC 1217 K/2 (Tris, -Si) 17 n.a. 14:10 150 38 control: 0.79±0.02; elevated pCO2: 0.76±0.02 (Richier & Fiorini 2011) Emiliania huxleyi RCC 1216 and RCC 1217 North Sea SW with f/2 vitamins and trace metals 15 7.7 – 8.2 18:6 50 and 300 32 From 0.63±0.14 to 1.18±0.20 (Rokitta & Rost 2012) Emiliania huxleyi RCC 1216 and RCC 1217 f/2 15 8.1 – 8.2 16:8 50 and 300 32.2 From 0.87±0.12 to 1.18±0.20 (Rokitta et al. 2011) Emiliania huxleyi RCC 1216, 1249 and 1213 K/2 (Tris,
-Si) 18 n.a. 12:12 85 n.a. n.a.
(Frada et al. 2008) Emiliania huxleyi RCC 1266 Oligotrophic SSW 16 n.a. 14:10 60 n.a. diploid: 0.75±0.03 (axenic) and 0.76±0.01 (non-axenic); haploid: 0.98±0.05 (Van Oostende et al. 2012) Emiliania huxleyi RuG collection
f/2 16 n.a. 16:8 75 35 0.34±0.08 (Boelen et al. 2013)
Emiliania
huxleyi 88E K 19 n.a. 14:10 51 n.a. n.a.
(Balch et al. 1993) Emiliania huxleyi 88E K 17 7.93 - 8.74
n.a. 75 n.a. From 0.24 to 0.99 (Balch et al. 1996)
Emiliania
huxleyi 88E K 16 n.a. 16:8 200 n.a.
0.49±0.01 for low irradiance and 0.81±0.04 for high irradiance (Fernandez et al. 1994) Emiliania
huxleyi 92D f/2 15 n.a. 12:12 50-100 n.a. 0.9 (Harris 1994)
Emiliania huxleyi 92d 1:1:1 Erd-Schreiber, ASP2 and Miquel-Allen
15 n.a. 12:12 n.a. n.a. n.a. (Marlowe et al. 1984)
Emiliania huxleyi
(several strains)
f/2 15 n.a. 12:12 100 n.a. n.a. (Pond & Harris 1996) Emiliania huxleyi (16 different strains) Nutrients added to nutrient-poor SW
15 n.a. 16:8 70 n.a. From 0.13 to 0.70 (Stolte et al. 2000)
Emiliania huxleyi (34
different strains)
f/2 15 n.a. 14:10 200 n.a. n.a.
(Iglesias-Rodriguez et
al. 2006)
Table I Glossary: ASW - Artificial seawater; ESW - Enriched seawater; L:D - Light:Dark; n.a. - Not available; PBR – Photobioreactor; PFD - Photon flux density; SW - Seawater; SSW - Synthetic seawater.
Table I Glossary: ASW - Artificial seawater; ESW - Enriched seawater; L:D - Light:Dark; n.a. - Not available; PBR – Photobioreactor; PFD - Photon flux density; SW - Seawater; SSW - Synthetic seawater.
Table I Glossary: ASW - Artificial seawater; ESW - Enriched seawater; L:D - Light:Dark; n.a. - Not available; PBR – Photobioreactor; PFD - Photon flux density; SW - Seawater; SSW - Synthetic seawater.
Table I Glossary: ASW - Artificial seawater; ESW - Enriched seawater; L:D - Light:Dark; n.a. - Not available; PBR – Photobioreactor; PFD - Photon flux density; SW - Seawater; SSW - Synthetic seawater.
Table I Glossary: ASW - Artificial seawater; ESW - Enriched seawater; L:D - Light:Dark; n.a. - Not available; PBR – Photobioreactor; PFD - Photon flux density; SW - Seawater; SSW - Synthetic seawater.
16
2.4. BIOCHEMICAL COMPOSITION 2.4.1. PROTEINS
In order to grow and bloom, E. huxleyi has various proteins that help cells adapt to different environments such as: a) several photoreceptors and proteins involved in the assemblage and repair of said photoreceptors that help withstand photoinhibition; b) inorganic phosphate transporters, alkaline phosphatases, purple acid phosphatases and other enzymes that hydrolyse organic phosphorus compounds, thus being able to thrive in low phosphorus conditions; c) transporters used in the uptake and assimilation of inorganic nitrogen, in particular in the form of ammonium transporters; d) resistance-associated macrophage protein class of metal transporters, multi-copper oxidases, ferric reductases and siderophores that allow for growth in surface waters with low iron concentration; e) presence of selenoproteins, usually found in mammals and green algae, that promote the use of selenium for growth (Obata & Shiraiwa 2005; Read et al. 2013). Overall, the protein content in E. huxleyi is around 6.7 pg/cell for coccolith-forming cells and 6.6 pg/cell for naked cells (Paasche & Klaveness 1970).
2.4.2. AMINOACIDS
Because of their role in the structure of proteins, amino acids (AA) are of extreme importance. With E. huxleyi, that is no exception. During the life cycle of E. huxleyi, the transport and metabolism of AA varies, with higher expression during the haploid phase, showing specific transcriptomes for each of their life cycle phases (Rokitta et al. 2011). It has also been shown that E. huxleyi can grow well in a medium with free AA that are used as a nitrogen source (Ietswaart et al. 1994; McKew et al. 2015). Considerable growth of axenic cultures in growth medium containing alanine and leucine has been described. In the presence of bacteria, E. huxleyi is able to grow at a higher rate when in the presence of glutamine and glycine (Ietswaart et al. 1994; Bruhn et al. 2010). In 100 g of total AA obtained from the biomass of this haptophyte, the most abundant AA are glutamic acid (12.4 g), alanine (11.6 g), leucine (9.3 g), aspartic acid (7.6 g) and lysine (7.6 g; Chau et al. 1967).
2.4.3. LIPIDS
Lipids are formed primarily of carbon, hydrogen and oxygen and represent an important class of compounds for microalgal metabolism (Babayan 1987). In E. huxleyi, only small amounts of neutral lipids are stored, usually in the form of triacylglycerols
17 (TAG), while polyunsaturated long-chain alkenes, alkenones and alkenoates, are produced in higher amounts (Volkman et al. 1980, Marlowe et al. 1984; Eltgroth et al. 2005). These compounds are connected to structures such as the endoplasmic reticulum and the coccolith-producing compartment (Evans et al. 2009). The production of ketones suggests that these compounds act as storage lipids, replacing the role of TAG (Bell & Pond 1996). Their sphingolipids are primarily glucosylceramides with a C9-methyl chain that are usually found only in fungi and some animals (Oura & Kajiwara 2010; Read et al. 2013). Sulpholipids are used as partial replacements for cellular phospholipids (Van Mooy et al. 2009; Read et al. 2013). In terms of glycerolipids, E. huxleyi has high contents of phosphatidylcholine, monogalctosyldiacylglycerols, and sulpho-quinovosylglycerol. It also contains significant amounts of hydrocarbons, methyl and ethyl ketones and sterol esters (Pond & Harris 1996).
2.4.4. FATTY ACIDS
In the marine environment, fatty acids (FA) are usually provided by microalgae to other organisms in the food web, playing a vital role in terms of energy storage, somatic growth and reproduction (Evans et al. 2009). Docosahexaenoic acid (DHA) and eicosapentaenoic acid (EPA) are considered to be extremely important for human nutrition, being used in food and feed supplements (Boelen et al. 2013; Read et al. 2013).
E. huxleyi lipids are predominantly rich in (n-3) polyunsaturated fatty acids (PUFA;
Conte et al. 1994). Different types of FA are present in this species, such as tetradecanoic (14:0), hexadecenoic (16:0) and oleic (ODA; 18:1n-9) acids. Regarding PUFA, DHA (22:6n-3), octadecapentaenoic (OPA; 18:5n-3), α-linolenic (ALA; 18:3n-3) and octadecatetraenoic (OTA; 18:4n-3) acids are frequently present in higher abundances (33, 20, 5 and 10%, respectively). Docosapentaenoic acid (DPA; 22:5n-3) and EPA (20:5n-3) are also present; however, smaller proportions (0.8 and 0.9%, respectively) are commonly detected (Conte et al. 1994, Bell & Pond 1996, Pond & Harris 1996; Evans et al. 2009, Khozin-Goldberg et al. 2011, Boelen et al. 2013).
2.4.5. CARBOHYDRATES
Carbohydrates (CHO) are molecules often released as a part of dissolved organic matter, making up a big part of the DOC present in the ocean (Pakulski & Benner 1994; Myklestad 2000; Van Oostende et al. 2012). A major percentage of CHO in seawater comes from either phytoplankton biomass (Pakulski & Benner 1994; Børsheim et al. 1999) or extracellular CHO (Biersmith & Benner 1998; Aluwihare & Repeta 1999) that