Full Terms & Conditions of access and use can be found at
http://www.tandfonline.com/action/journalInformation?journalCode=lpla20
Download by: [b-on: Biblioteca do conhecimento online IPB] Date: 05 January 2018, At: 13:09
Journal of Plant Nutrition
ISSN: 0190-4167 (Print) 1532-4087 (Online) Journal homepage: http://www.tandfonline.com/loi/lpla20
Assessing the potential use of two portable
chlorophyll meters in diagnosing the nutritional
status of plants
Sandra Afonso, Margarida Arrobas, Isabel Q. Ferreira & M. Ângelo Rodrigues
To cite this article: Sandra Afonso, Margarida Arrobas, Isabel Q. Ferreira & M. Ângelo Rodrigues (2018) Assessing the potential use of two portable chlorophyll meters in diagnosing the nutritional status of plants, Journal of Plant Nutrition, 41:2, 261-271, DOI: 10.1080/01904167.2017.1385798 To link to this article: https://doi.org/10.1080/01904167.2017.1385798
Accepted author version posted online: 28 Sep 2017.
Published online: 13 Oct 2017.
Submit your article to this journal
Article views: 54
View related articles
Assessing the potential use of two portable chlorophyll meters
in diagnosing the nutritional status of plants
Sandra Afonso, Margarida Arrobas, Isabel Q. Ferreira, and M.Angelo Rodrigues^
Centro de Investigac¸~ao de Montanha–Instituto Politecnico de Braganca, Campus de Santa Apol¸ onia, Braganca,¸
Portugal
ARTICLE HISTORY
Received 13 June 2016 Accepted 13 September 2016
ABSTRACT
The SPAD-502 and the FieldScout CM 1000 chlorophyll meters were compared in their performance in diagnosing the nutritional status of plants. Leaves of a wide range of greenness were used to push the sensitivity of the tools to their limits. Both devices showed high reproducibility when used by different operators. The SPAD-readings were well-correlated with leaf nitrogen (N) concentrations, since leaves from heavily fertilized plants were not included in the sample population. The FieldScout-readings showed a marked saturation curve with the leaf N concentration, thus it cannot be used as a reliable N nutritional status index. The results also showed that the use of SPAD-502 in the diagnosis of the nutritional status of an orchard requires the establishment of specific critical concentrations for cultivars and sampling dates. The SPAD-502 appeared to have potential in the diagnosis of the nutritional status of the orchard for nutrients other than N.
KEYWORDS
FieldScout CM 1000 NDVI; leaf greenness; leaf N concentration; results reproducibility; SPAD-502
Introduction
Nitrogen (N) has a central role in all agricultural systems. It is required in large amounts by plants, since it is an integral constituent of proteins, nucleic acids, chlorophyll, co-enzymes, phytohormones and secondary metabolites (Hawkesford et al.2012). N limits the primary productivity of agricultural fields more than any other nutrient, mainly because it does not usually accumulate in the soil in avail-able forms to plants. N should be annually supplied as fertilizers, manures or N should reach the soil/ plant system by growing legumes or other plants that can access N from the atmosphere. Furthermore, N is highly dynamic in the soil–plant system. Usually, only 40–60% of the N applied as a fertilizer is taken up by the crop (Havlin et al.2005). A significant part is usually lost by nitrate leaching, denitrifi -cation or is volatized as ammonia (NH3) from the soil or plant canopy (Werner2010). In view of the
above, N management has been a major topic in agricultural research.
Splitting N rates is one of the most important strategies to increase N use efficiency, since it allows the better matching of available N in the soil to plant needs. Supported by diagnostic tools to evaluate the nutritional status of the plants, it is possible to reduce the importance of the pre-plant N applica-tions, by deferring the decision of the N rates to apply to the course of the growing season (Rodrigues et al.2005). Plant analysis is the standard methodology usually used to assess the nutritional status of plants. However, laboratory plant analysis is expensive and time-consuming. Tissue testing, such as petiole nitrate concentration, assessed by selective electrodes (Vitosh and Silva1994; Sims et al.1995) or test strips (Sims et al.1995; Rodrigues2004; Rodrigues et al.2005) and also chlorophyll measure-ments through portable tools (Schepers et al. 1992; Rodrigues et al. 2006; Arrobas, Aguiar, and
CONTACT Margarida Arrobas [email protected] Centro de Investiga¸c~ao de Montanha–Instituto Politecnico de Braganca,¸ Campus de Santa Apolonia, Braganca, Portugal.¸
© 2018 Taylor & Francis Group, LLC
2018, VOL. 41, NO. 2, 261–271
https://doi.org/10.1080/01904167.2017.1385798
Rodrigues2016) may be valuable alternatives. The reflectance properties of the canopy, assessed by handheld spectroradiometers (Basyouni, Dunn, and Goad 2015; Dunn, Shrestha, and Goad
2016), imagery from satellite sensors (Gitelson, Peng, and Huemmrich 2014; Zhang et al. 2014) or digital cameras (Hardin et al. 2012; Lopez-Bellido et al. 2012) have also been used to estimate nutritional status of plants. Tissue tests are, however, more popular since they are available to a large research community as well as farmers. They are particularly important in annual crops in which the delay in getting a diagnosis, common in standard plant analysis, is unhelpful in mak-ing in-season fertilization adjustments (Rodrigues et al. 2005). In tree crops, mainly due to the extension of the root system, soil analysis loses importance to plant analysis (Righetti, Wilder, and Cummings 1990), which creates a good opportunity for tissue testing. In tree crops, tissue testing is also attractive mainly because the critical sufficiency ranges established standard plant analysis are only available for advanced growth stages (Nielsen et al. 1995; Porro et al. 2001), which prevents interventions in the current growing season.
The close relationship between leaf N concentration and leaf greenness has resulted in the emer-gence of devices that seek to assess the N nutritional status of plants by estimating the leaf chlorophyll concentration. The SPAD-502 chlorophyll meter (Minolta Camera Co. Ltd., Japan), which measures the transmittance of light through the leaf, has been widely used. Several studies have shown a signifi -cant linear relationship between SPAD-readings and laboratory determination of leaf chlorophyll con-centration (Hawkins, Gardiner, and Comer2009; Ruiz-Espinosa et al.2010; Ibrahim and Jaafar2013) and between SPAD-readings and leaf N concentration (Ibrahim and Jaafar2013; Uchino et al.2013; Mahajan et al.2014; Basyouni, Dunn, and Goad2015). The FieldScout CM 1000 meter, more recently manufactured, evaluates by remote sensing the chlorophyll content in the leaves based on the chlorophyll reflectance. Based on a point-and-shoot technology, the FieldScout CM 1000 senses the light at different wavelengths displaying a normalized difference vegetation index (NDVI), which is proportional to the leaf chlorophyll content. The FieldScout CM 1000 chlorophyll meter was used to determine the actual amount of N needed to optimize playability and aesthetic quality in creeping bentgrass on golf greens by Lopez-Bellido et al. (2012). Mahajan et al. (2014) have also found a positive correlation between FieldScout CM 1000 NDVI and leaf N concentration in the aromatic rice hybrid PRH-10 in India.
The portable devices have potential but also weaknesses that must be revealed to increase their use-fulness in research and on farms. In the case of SPAD-502 chlorophyll meter, the main problems are the differences in the color of the plants due to abiotic and biotic stresses, growth stages and cultivars. To overcome such difficulties, Schepers et al. (1992) have proposed the use of relative SPAD-values instead of the direct readings, by estimating a sufficiency index based on a reference strip, where the crop is supplied with excess N. The plants in the reference strip display a maximum greenness, being the values of thefield expressed as a percentage of the maximum. Lin et al. (2010) estimated SPAD indices from readings taken at various leaf positions in rice. Their results have shown that those indices can predict foliar N concentration without significant interferences with rice genotypes and growth stages. The performance of the FieldScout CM 1000 meter is still poorly characterized. However, the few studies already published have given good prospects for the device (Lopez-Bellido et al. 2012; Mahajan et al.2014).
In this work, the potential use of two devices was compared that can estimate the chlorophyll content of the leaves and which in turn can be related to the N nutritional status of the crops: the SPAD-502 chlorophyll meter, which measures the transmittance of light through the leaves and has been used for over 20 years, and the FieldScout CM 1000 NDVI meter, a newer device that estimates the leaf greenness by remote sensing, measuring the leaf reflectance. The following will be assessed: (i) the reproducibility of the devices when used by several operators; (ii) the direction of the light beam of the FieldScout CM 1000 NDVI in relation to leaf surface; (iii) the relationship of the results of both devices with the leaf N concentration by using populations of leaves with variable greenness; and (iv) the performance of the devices in the diagnosis of the nutritional status of an apple (Mallus pumila Miller) orchard by taking readings in four cultivars and at three growth stages.
Materials and methods
In this work, two portable devices were used to estimate the chlorophyll content of the leaves: the SPAD-502 Plus chlorophyll meter; and the FieldScout CM 1000 NDVI meter. SPAD-502 Plus measures the transmittance of light throughout the leaf in two different wavelengths, 650 nm (red light, absorbed by chlorophyll pigments) and 940 nm (infrared light, not absorbed by chlorophyll). SPAD-502 Plus uses thumb pressure to close a chamber allowing the measure-ment of light transmittance throughout a leaf, displaying chlorophyll-SPAD readings that are expected to be proportional to the chlorophyll content of the leaf. The FieldScout CM 1000 meter senses light at wavelengths of 660 nm and 840 nm, measuring the ambient and reflected light at each of those wavelengths. Chlorophyll absorbs 660 nm light and, as a result, the reflectance of that wavelength from the leaf is reduced compared to the reflected 840 nm light (light having a wavelength of 840 nm is unaffected by leaf chlorophyll content and serves as an indication of how much light is reflected). The NDVI value (¡1 to 1) is calculated from the measured ambi-ent and reflected light [(%Near Infrared ¡ %Red) / (%Near Infrared C %Red)]. Readings are taken by pressing a trigger that activates the targeting lasers and causes the measuring and calcu-lating mechanism.
The test of reproducibility of SPAD-502 and FieldScout CM 1000 results were performed by four operators working as close as possible regarding the time of day. Leaves from three tree fruit species were used, grown in similar conditions. Readings from peach-tree [Prunus persica (L.) Basch], plum-tree (Prunus domestica L.) and cherry-tree (Prunus cerasus L.) were used in this test and the readings taken on 15 September 2015. To extend the range of the response of the devices there were used leaves of different greenness, from chlorotic to dark green. Three samples of ten homogeneous leaves per group of greenness and species were used for measurement. The readings were taken at half the length of the leaf and laterally between the midrib and the edge of the leaf blade.
The FieldScout CM 1000 meter was tested on the light beam orientation in relation to leaf surface. The test was carried out on dark green leaves of cherry-tree. Measurements were taken from angles of incidence of the light beam with the leaf surface of 90 and 45 and also bending
the blade U-shaped with the concavity turned up. The latter position attempts to simulate natu-ral curvatures that some leaves often present.
In the study of the relationship between the results of SPAD-502, FieldScout CM 1000 and leaf N concentration, leaves of different greenness from plum- and peach-tree were used. Leaves of lemon-balm (Melissa officinalis L.) from a pot experiment, where the plant was sub-jected to different N rates (0 to 200 kg N ha¡1
) were also used to obtain a wider range of leaf greenness. The aim was to create a situation of over-fertilization, which is better achieved by growing an herbaceous plant in a pot experiment than by fertilizing trees in an orchard.
An apple orchard with four different varieties (Red Chief/M7, Granny Smith/M106, Fuji/PajI, Galaxy/EM9), managed in a similar manner regarding fertilization, crop protection and pruning was used for the evaluation of leaf nutrient concentration and to perform SPAD and FieldScout readings throughout the growing season. In this experiment, the youngest fully expanded leaves of the current season’s growth were used for all measurements. Three replications per measure-ment, which corresponded to the average of 30 readings in different leaves, were recorded per variety and sampling date. The SPAD and FieldScout readings were taken in the middle part of the leaf considering the length and the distance between the midrib and the edge of the leaf blade. Leaves were collected for laboratory analysis and measurements carried out with SPAD and FieldScout devices on three dates, 19 June, 20 July and 1 September 2015.
The samples collected for elemental analysis were oven-dried at 70C and ground. Tissue
anal-yses were performed by Kjeldahl (N), colorimetry boron and phosphorus (B and P),flame emis-sion spectrometry potassium (K) and atomic absorption spectrophotometry calcium and magnesium (Ca and Mg) methods (Walinga et al.1989).
The relationship between the measured variables was subjected to analysis of variance. When a significant correlation was found (p<.05), the coefficients of determinations were also estimated.
Results
Reproducibility of SPAD readings and FieldScout NDVI between different operators
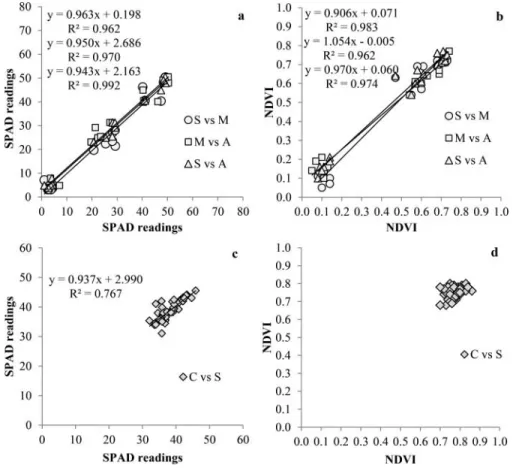
When chlorotic, pale green and dark green leaves were included in the same sample population, the readings obtained by the different operators with the SPAD-502 or the FieldScout CM 1000 NDVI showed significant linear relationships and values of regression coefficients close to 1 (Figure 1a and b). When only dark green leaves were used, the SPAD readings of the different operators still displayed a significant linear relationship although with a lower coefficient of determination (Figure 1c). Using only dark green leaves, the FieldScout NDVI of the different operators did not show a significant linear relationship (Figure 1d).
Position of leaf blade in relation to the FieldScout CM 1000 meter light beam
The angle by which the light beam of the FieldScout CM 1000 meter reached the leaf surface influenced the result. The relationships between the readings taken from an angle of 90 with the
readings taken at 45 or with leaves curved in U-shape, were linear with high coefficients of
determination (Figure 2a and b), but the regression coefficients were in all situations below 1.
Figure 1.Reproducibility of SPAD-502 and FieldScout NDVI readings taken by three different operators (S, M and A) using a mixture of leaf samples of peach- and plum-tree, considering chlorotic, pale green and dark green leaves (a, b), and taken by two operators (C and S) from cherry-tree using only dark green leaves (c, d).
This means that light beam angles different from 90 underestimate the result obtained in this
position.
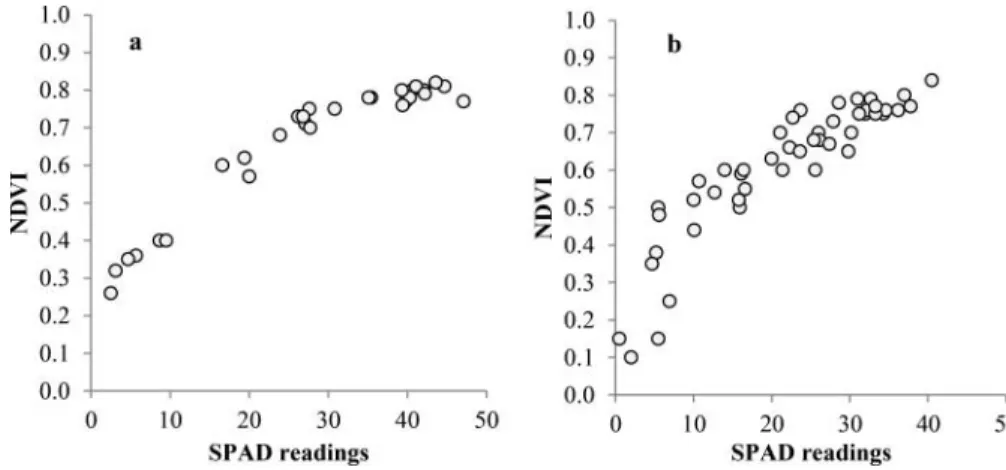
Relationship between SPAD readings and FieldScout NDVI
The relationship between SPAD readings and FieldScout DNVI values followed a saturation curve, which means that FieldScout NDVI did not increase proportionally to SPAD readings as the greenness of the leaves increased (Figure 3). For SPAD readings higher than 30, or NDVI values higher than 0.7, the sensitivity of the FiledScout CM 1000 to the leaf greenness became reduced.
Relationship between SPAD readings and FieldScout NDVI with leaf N concentration
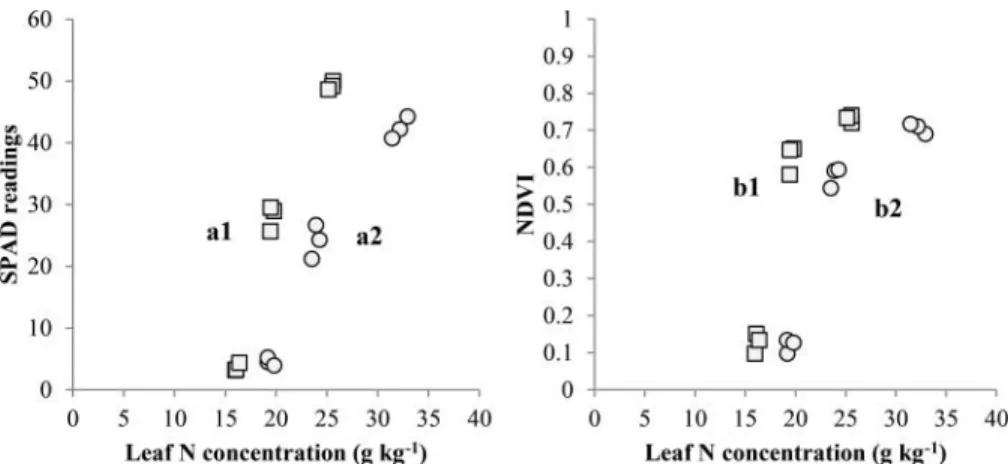
Using samples from two different tree species, a specific species-pattern arises between leaf N concentration and SPAD values and between leaf N concentration and NDVI (Figure 4). By species, the relationship between leaf N concentration and SPAD values was linear, while the relationship between leaf N concentration and NDVI showed a saturation curve, since NDVI val-ues did not increase with the increase of leaf N concentration.
Figure 2.Relationships between FieldScout NDVI taken from different angles of the light beam with the leaf surface (45and 90) and placing the leaf curved in U-shape with the concavity facing up, using cherry-tree leaves.
Figure 3.Relationship between SPAD readings and FieldScout NDVI values from peach- (a) and cherry-tree (b) leaves.
When the relationship between leaf N concentration and SPAD readings included leaves of over-fertilized plants, a saturation curve was also observed, since SPAD-readings increased at a lower rate than the leaf N concentration (Figure 5).
Dynamic of leaf nutrient concentration, SPAD-readings and FieldScout NDVI over the growing season
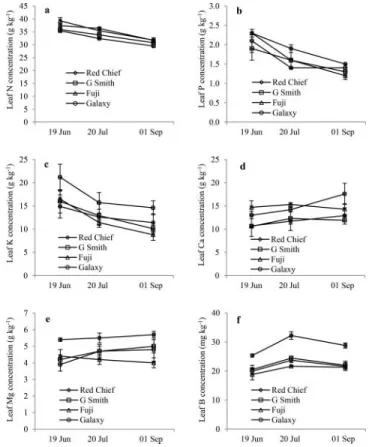
The measurements taken from four apple cultivars showed that the leaf N, K and P concentrations tended to decrease throughout the growing season, although slightly dissimilar patterns have occurred among cultivars (Figure 6a,b, andc). In the case of leaf Ca and Mg concentrations, there was a ten-dency to increase, although the response has not been similar in all varieties (Figure 6dande). Regard-ing leaf B concentration, it seems that a slight increase has occurred followed by a slight decrease or stabilization (Figure 6f). The SPAD-readings and NDVI values increased over the growing season, although some differences among cultivars were recorded (Figure 7).
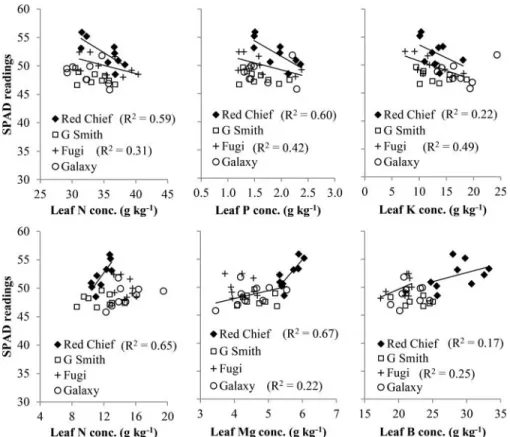
The attempt to establish relationships between the leaf nutrient concentrations and the SPAD read-ings gave significant linear relationships with some cultivars but not with others (Figure 8). In the case of N, K and P, when a significant linear relationship was found, the slope was negative since leaf Figure 4.Relationships between leaf N concentration and SPAD readings and FieldScout NDVI values using chlorotic, pale green and dark green leaves from plum- (a1, b1) and peach-tree (a2, b2).
Figure 5.Relationship between leaf N concentration and SPAD readings in leaf samples taken from a fertilization trial with different N rates of lemon balm.
nutrient concentrations evolved in a different way to SPAD readings (Figures 6and7). When signifi -cant linear relationships between the leaf Ca, Mg and B concentrations and SPAD-readings were found, these relationships are positive since the variables evolved in the same direction during the growing season, as shown inFigures 6and7.
Discussion
No problems of reproducibility were detected when the FieldScout CM 1000 was used by different operators, likely due, at least in part, to the previous standardization of the reading process, which Figure 6.Leaf nutrient concentrations in four commercial apple varieties from samples collected during the growing season of 2015. The vertical bars represent the mean standard deviation.
Figure 7.SPAD readings and FieldScout NDVI values in four commercial apple varieties from samples collected during the growing season of 2015. The vertical bars represent the mean standard deviation.
consisted of using the same leaves by all operators and taking the readings in the same position in the leaf. The lack of linearity between the readings of different operators when only dark green leaves were used (Figure 1d), cannot be attributed to an operator effect but rather to the loss of sensibility of FieldScout CM 1,000 meter when operating with dark green leaves.
The orientation of the light beam at 45 relative to the leaf surface, or taking the readings with the
leaf in a U-shape position, gave both positive linear relationships with the readings taken perpendicu-larly to the leaf surface. However, the readings were underestimated in both positions different to 90,
producing regression coefficients lower than 1 (Figure 2). Thus, the angle of incidence of the light beam in the leaves should also be standardized to gather data with the FieldScout CM 1000 NDVI meter.
The relationship between the SPAD-readings and FieldScout NDVI showed a saturation curve for NDVI values, i.e., in the conditions of this experiment, the FieldScout NDVI seemed to lose sensitivity as the leaf greenness increased, particularly to SPAD-values up to 30 and NDVI values up to 0.7. Above those values the rate of increase of NDVI values was lower than that of SPAD readings (Figure 3a, 3band4b). In turn, SPAD readings also saturated for over-fertilization con-ditions in a relationship with leaf N concentration (Figure 5). On the other hand, a linear rela-tionship between leaf N concentration and NDVI values was only achieved when deeply chlorotic leaves were included in the sampled population. When using dark green leaves, there was no relationship between leaf N and NDVI values. The failure of chlorophyll sensors to dis-tinguish within the range of over-fertilized plants has been observed since the early studies with SPAD-502 chlorophyll meter (Schepers et al. 1992; Blackmer and Schepers, 1994). Since then, the results have varied between obtaining significant linear relationships between SPAD-readings and leaf N concentrations (Uchino et al. 2013; Mahajan et al. 2014; Basyouni, Dunn, and Goad Figure 8.Relationships between leaf nutrient concentrations and SPAD readings from leaf samples of four apple varieties taken in three sampling dates over the growing season (June 19, July 20, September 01).
2015) and their absence (Sibley et al. 1996; Bullock and Anderson, 1998; Hardin et al. 2012). This discrepancy in results might be due to differences in the nutritional status of the plants in each of the experiments in which the device was used.
In the study, where chlorotic, green pale, dark green leaves and two species, peach- and plum-tree, were joined, linear relationships were found between SPAD-readings and leaf N con-centrations, although each species displayed a different-pattern linear relationship (Figure 4a). It should be noted that leaf N concentration was evaluated per unit of mass (dry weight basis), whereas SPAD-readings reflect the chlorophyll content per unit of leaf area, which makes the relationship between the two variables sensitive to the thickness of the leaf and other aspects that affect the chloroplast arrangement in cells, as reported by Naus et al. (2010) working with tobacco plants. Hardin et al. (2012) also reported distinct linear relationships for different culti-vars of Pecan [Carya illinoinensis (Wangenh.) K. Koch]. Thus, it seems clear that different spe-cies and cultivars need different standards or sufficiency ranges for SPAD-readings interpretation as generally occurs with laboratory plant analysis. The relationship between FieldScout NDVI and leaf N concentration showed also different patterns for different cultivars (Figure 4b).
In apple, the concentration of N, P and K in the leaves decreased throughout the growing season, in a very similar way among cultivars for N, but with different patterns among culti-vars for P and K. The concentration of Ca and Mg in the leaves showed an increasing trend during the growing season but with different patterns among cultivars. In the case of B, there was an increase from June to July similar in all cultivars, followed by a slight decrease or sta-bilization depending on the cultivar between July and September. SPAD-readings and FieldSc-out NDVI recorded an increase during the growing season in all cultivars. This trend over the growing season, whether negative or positive, depending on the nutrients, conditioned the rela-tionship between leaf nutrient concentrations and SPAD-readings and FieldScout NDVI. Thus, the relationships between leaf N, P and K concentrations and SPAD values tend to be linear negative, while the relationships between leaves Ca, Mg and boron concentrations and SPAD values tend to be linear positive. Previous work of Nielsen et al. (1995) had also shown that different cultivars of apple displayed different leaf SPAD readings and leaf N concentrations and the SPAD readings increased over the growing season, whereas leaf N concentrations decreased. Our results and previous ones highlight the need to include the sampling date in the standardization process in the use of SPAD and also the FieldScout NDVI meters, as well as the need to set sufficiency indices by cultivar. It seems also possible to establish significant relationships between SPAD readings and leaf concentrations of other nutrients as previously found by Porro et al. (2001) in apple for N, Ca, K and Mg and in grapevine for N and P.
Conclusions
SPAD-502 and FieldScout CM 1000 meters showed high reproducibility of results among differ-ent operators if the reading process was properly standardized. SPAD readings were related to the leaf N if the sample population did not contain leaves from heavily-fertilized plants. Thus, SPAD readings may be a viable option to diagnose plant N nutritional status in cropping sys-tems, where high rates of N are not applied (such as organic farming, and syssys-tems, where N is split into multiple applications over the growing season, etc.). The FieldScout CM 1000 NDVI meter showed obvious limitations, being of little use in diagnosing plant N nutritional status by using the meter to capture data directly from individual leaves, since it was only able to provide linear relationships with leaf N concentration for very low levels of leaf greenness. In orchards, where it is not feasible to use well-fertilized reference strips to calculate relative SPAD-readings, the critical concentrations should be established by cultivar and phenological stage. Although there has been a little work on the relationship between SPAD readings and other nutrients besides N, it appears to be possible, which may increase the usefulness of the device in the diag-nosis of the nutritional status of orchards.
References
Arrobas, M., P. Aguiar, and M. A. Rodrigues. 2016. A comparison of a pasture ley with a maize monoculture on the soil fertility and nutrient release in the succeeding crop.Archives of Agronomy and Soil Science62:829–39.
Basyouni, R., B. L. Dunn, and C. Goad. 2015. Use of nondestructive sensors to assess nitrogen status in potted poinsettia (Euphorbia pulcherrimaL. (Willd. ex Klotzsch)) production.Scientia Horticulturae192:47–53.
Blackmer, T. M., and J. S. Schepers. 1994. Techniques for monitoring crop nitrogen status in corn.Communications in Soil Science and Plant Analysis25:1791–800.
Bullock, D. G., and D. S. Anderson. 1998. Evaluation of the Minolta SPAD-502 chlorophyll meter for nitrogen manage-ment in corn.Journal of Plant Nutrition21:741–55.
Dunn, B., A. Shrestha, and C. Goad. 2016. Use of nondestructive sensors to quantify ornamental kale nitrogen status. Journal of Plant Nutrition39:1123–30.
Gitelson, A. A., Y. Peng, and K. F. Huemmrich. 2014. Relationship between fraction of radiation absorbed by photosyn-thesizing maize and soybean canopies and NDVI from remotely sensed data taken at close range and from MODIS 250 m resolution data.Remote Sensing of Environment147:108–20.
Hardin, J. A., M. W. Smith, P. R. Weckler, and B. S. Cheary. 2012. In situ measurement of pecan leaf nitrogen concentra-tion using a chlorophyll meter and vis-near infrared multispectral camera.HortScience47:955–60.
Havlin, J. L., J. D. Beaton, S. L. Tisdale, and W. L. Nelson. 2005.Soil fertility and fertilizers. An introduction to nutrient management. 2nd ed. New Jersey: Pearson Prentice Hall.
Hawkesford, M., W. Horst, T. Kichey, H. Lambers, J. Schjoerring, I. S. Moller, and P. White. 2012. Function of macronu-trients. InMarschner’s mineral nutrition of higher plants, ed. P. Marschner, 135–89. London, UK: Elsevier.
Hawkins, T. S., E. S. Gardiner, and G. S. Comer. 2009. Modeling the relationship between extractable chlorophyll and SPAD-502 readings for endangered plant species research.Journal for Nature Conservation17:123–7.
Ibrahim, M. H., and H. Z. E. Jaafar. 2013. Relationship between extractable chlorophyll content and SPAD values in three varieties of kacip fatimah under greenhouse conditions.Journal of Plant Nutrition36:1366–72.
Lin, F. F., L. F. Qiu, J. S. Deng, Y. Y. Shi, L. S. Chen, and K. Wang. 2010. Investigation of SPAD meter-based indices for estimating rice nitrogen status.Computers and Electronics in Agriculture71:S60–5.
Lopez-Bellido, R. J., L. Lopez-Bellido, P. Fernandez-Garcıa, J. M. Lopez-Bellido, V. Mu~noz-Romero, P. L. Lopez-Bellido,
and S. Calvache. 2012. Nitrogen remote diagnosis in a creeping bentgrass golf green.European Journal of Agronomy 37:23–30.
Mahajan, G. R., R. N. Pandey, D. Kumar, S. C. Datta, R. N. Sahoo, and R. Parsad. 2014. Development of critical values for the leaf color chart, SPAD and FieldScout CM 1000 forfixed time adjustable nitrogen management in aromatic hybrid rice (Oryza sativaL.).Communications in Soil Science and Plant Analysis45:1877–93.
Naus, J., J. Prokopova, J.Reb ıcek, and M.Spundova. 2010. SPAD chlorophyll meter reading can be pronouncedly affected
by chloroplast movement.Photosynthesis Research105:265–71.
Nielsen, D., E. J. Hogue, G. H. Nielsen, and P. Parchomchuk. 1995. Using SPAD-502 values to assess the nitrogen status of apple trees.HortScience30:508–12.
Porro, D., C. Dorigatti, M. Stefanini, and A. Ceschini. 2001. Use of SPAD meter in diagnosis of nutritional status in apple and grapevine.Acta Horticulturae564:243–52.
Raun, W. R., and J. S. Schepers. 2008. Nitrogen management for improved use efficiency. InNitrogen in agricultural sys-tems, eds. J. S., Schepers and W. R., Raun, 675–93. Madison, WI: Agronomy Monograph No. 49, ASA, SSSA, CSSA. Righetti, T. L., K. L. Wilder, and G. A. Cummings. 1990. Plant analysis as an aid in fertilizing orchards. InSoil testing and
plant analysis, ed. R. L., Westermann, 3rd ed., 563–601. Madison, WI: Book Series no. 3. SSSA.
Rodrigues, M. A. 2004. Establishment of continuous critical levels for indices of plant and pre sidedress soil nitrogen sta-tus in the potato crop.Communications in Soil Science and Plant Analysis35:2067–85.
Rodrigues, M. A., J. Coutinho, F. Martins, and M. Arrobas. 2005. Quantitative sidedress nitrogen recommendations for potatoes based upon crop nutritional indices.European Journal of Agronomy23:79–88.
Rodrigues, M. A., A. Pereira, J. E. Cabanas, L. Dias, J. Pires, and M. Arrobas. 2006. Crops use-efficiency of nitrogen from manures permitted in organic farming.European Journal of Agronomy25:328–35.
Ruiz-Espinoza, F. H., B. Murillo-Amador, J. L. Garcıa-Hernandez, L. Fenech-Larios, E. O. Rueda-Puente, E.
Troyo-Dieguez, C. Kaya, and A. Beltran-Morales. 2010. Field evaluation of the relationship between chlorophyll content in basil leaves and a portable chlorophyll meter (APAD-502) readings.Journal of Plant Nutrition33:423–38.
Schepers, J. S., D. D. Francis, M. Vigil, and F. E. Below. 1992. Comparison of corn leaf nitrogen concentration and chloro-phyll meter readings.Communications in Soil Science and Plant Analysis23:2173–87.
Sibley, J. L., D. J. Eakes, C. H. Gilliam, G. J. Keever, W. A.Dozier, and D. G. Himelrick. 1996. Foliar SPAD-502 meter val-ues, nitrogen levels, and extractable chlorophyll for red maple selections.HortScience31:468–70.
Sims, J. T., B. L. Vasilas, K. L. Gartley, B. Milliken, and V. Green. 1995. Evaluation of soil and plant nitrogen test for maize on manured soils of the Atlantic coastal plain.Agronomy Journal87:213–22.
Uchino, H., T. Watanabe, K. Ramu, K. L. Sahrawat, S. Marimuthu, S. P. Wani, and O. Ito. 2013. Calibrating chlorophyll meter (SPAD-502) reading by specific leaf area for estimating leaf nitrogen concentration in sweet sorghum.Journal of Plant Nutrition36:1640–6.
Vitosh, M. L., and G. H. Silva. 1994. A rapid petiole sap nitrate-nitrogen test for potatoes.Communications in Soil Science and Plant Analysis25:183–90.
Walinga, I., W. van Vark, V. J. G. Houba, and J. J. Van der Lee. 1989.Soil and plant analysis, part 7: Plant analysis proce-dures. Wageningen, the Netherlands: Department of Soil Science and Plant Nutrition, Wageningen, Agricultural University.
Werner, W. 2010.Ullmann’s agrochemicals, fertilizers, 3. Chap. 9.1 and 9.2, 99–111. Weinheim, Germany: Wiley-VCH Verlag GmbH & Co.
Zhang, M., B. Wu, M. Yu, W. Zou, and Y. Zheng. 2014. Crop condition assessment with adjusted NDVI using the uncropped arable land ratio.Remote Sensing6:5774–94.