Growth and yield of peanut cultivars
and breeding lines under water deficit
1Isabella Mendonça Arruda2, Vânia Moda-Cirino3, Juliana Sawada Buratto3, Josué Maldonado Ferreira4
INTRODUCTION
Peanut (Arachis hypogaea L.) is a legume originating from South America and the fourth most popular oil seed in the world, following soy, cotton and canola. The largest worldwide producers of peanut are in Asia, where more than half of its worldwide production is concentrated (FAO 2013). In Brazil, the São Paulo State was responsible for 89 %
ABSTRACT
RESUMO
of the national production at the 2013/2014 season (Conab 2014). The peanut is mainly used for human consumption in natura, processing, or oil production. The peanut is currently being studied as a promising raw material for biodiesel production because of the high concentration of oil in its seeds (Gonçalves et al. 2004, Nakagawa & Rosolém 2011).
Peanut crops are subjected to a number of abiotic stresses, particularly water deficits caused
1. Manuscript received in May/2014 and accepted for publication in Apr./2015 (http://dx.doi.org/10.1590/1983-40632015v4529652b). 2. Universidade Estadual de Londrina (UEL), Departamento de Agronomia, Londrina, PR, Brazil.
E-mail: [email protected].
3. Instituto Agronômico do Paraná (Iapar), Área de Melhoramento e Genética Vegetal, Londrina, PR, Brazil.
E-mails: [email protected], [email protected].
Crescimento e produtividade de cultivares e
linhagens de amendoim submetidas a déficit hídrico O déficit hídrico durante o desenvolvimento do amendoin
-zeiro prejudica vários processos fisiológicos da planta e reduz sua
produtividade. Este estudo objetivou avaliar o rendimento de grãos, componentes de produção e crescimento de cultivares e linhagens
de amendoim submetidas a déficit hídrico, em condições de campo.
O delineamento experimental foi o de blocos ao acaso, com parcelas
subdivididas e três repetições. Os tratamentos de déficit hídrico (com e sem) constituíram as parcelas e os genótipos avaliados (IAC
Tatu ST, BR1, BRS Havana, Col 72 e Col 82) as subparcelas. A
irrigação foi suspensa nas parcelas submetidas à deficiência hídrica entre 35 e 75 dias após a emergência. O crescimento das plantas,
massa seca da parte aérea e área foliar foram afetados negativamente
pelo déficit hídrico. Verificou-se incremento da diferença entre as parcelas com e sem deficiência hídrica, conforme o aumento do período de supressão de água. A cultivar BRS Havana e a linhagem
Col 82 apresentaram tolerância moderada à seca, com os maiores
rendimentos de grãos em condição de déficit hídrico. O déficit hí -drico foi responsável por redução de 68 % no rendimento de grãos na cultivar IAC Tatu ST, 44 % no número de vagens por planta na linhagem Col 82, 11 % no número de sementes por vagem na linha-gem Col 72 e 11 % na massa de 100 sementes na cultivar BRS1. PALAVRAS-CHAVE: Arachis hypogaea L.; tolerância à seca; deficiência hídrica.
Water deficit throughout the peanut plant development negatively affects physiological processes and reduces its yield. This study aimed to evaluate grain yield, yield components and plant growth of peanut cultivars and breeding lines subjected to water deficit under field conditions. The experimental design was split-plot randomized blocks with three replications. Water deficit treatments (with and without irrigation) were considered the plots and genotypes (IAC Tatu ST, BR1, BRS Havana, Col 72 and Col 82) the subplots. Irrigation was discontinued between 35 and 75 days after emergence on plots subjected to water stress. Plant growth, shoot dry matter and leaf area were negatively affected by drought stress. The difference between plots with and without water stress increased proportionally to the increase in the period of water suppression. The BRS Havana cultivar and the Col 82 breeding line were moderately tolerant to water deficit, with the highest grain yields under stress conditions. Water deficit caused a 68 % reduction in grain yield for the IAC Tatu ST cultivar, 44 % in number of pods per plant for the Col 82 breeding line, 11 % in number of seeds per pod for the Col 72 breeding line and 11 % in the 100 seeds weight for the BRS1 cultivar.
by periods of no rainfall or rainfall below the crop demand. Adequate water and nutrient supply directly affect the development and productivity of agricultural crops (Cattivelli et al. 2008, Anjum et al. 2011). The level of damage caused by water deficits is determined by the intensity and duration of the stress, as well as by the phenological stage of the crop (Chaves & Oliveira 2004).
The frequency and intensity of drought periods and high temperatures are expected to increase in the near future because of climate changes, causing substantial losses in agricultural areas. Adaptation strategies and agricultural policies capable of mitigating negative impacts on food production are therefore required (Sheffield et al. 2012, Teixeira et al. 2013).
Drought periods are detrimental for plant vital functions and induce adaptation mechanisms (Graciano 2009) to minimize the damages caused by water deficits. This adaptation involves complex mechanisms that are related to the plant’s sensitivity and tolerance to other stresses and may vary among genotypes (Chaves et al. 2002).
Water deficit conditions cause changes in the cell membrane, increase respiration, inhibit photosynthesis, decrease dry matter production and cause premature senescence of production components (Upadhyaya et al. 2011, Pereira et al. 2012, Duarte et al. 2013).
The goal of the present study was to quantify the damages caused by water deficits to different peanut genotypes by evaluating the grain yield, production components and plant growth of five peanut genotypes subjected to water deficits under field conditions.
MATERIAL AND METHODS
The experiment was conducted during the 2012/2013 agricultural year at the Estação Experimental do Instituto Agronômico do Paraná (Iapar), which is located in Londrina, Paraná State (PR) (23º22´S, 51º10´W and 585 m altitude). The experimental area presents the following annual averages: 20.3 ºC temperature, 69 % relative humidity and 1,728 mm rainfall. The region’s climate is Cfa (subtropical) according to the Köppen climate classification (Iapar 1994). The soil is a dystrophic Red Latosol, which was previously described in Faria & Madramootoo (1996).
The experiment was set in three beds with concrete sides and the following dimensions: 100 m length x 5 m width x 1 m depth. A split-plot experiment with a complete randomized blocks design with three replicates was used. The water deficit treatments (with and without) constituted the main plots, and the evaluated genotypes (IAC Tatu ST, BR1, BRS Havana, Col 72 and Col 82) constituted the subplots. The subplots consisted of four rows 5 m long and spaced 0.5 m apart, and the seeding density was 16 viable seeds m-1.
Sowing was performed on 27 December 2012. Base fertilization of the soil was performed with NPK fertilizer (4:30:10), and weed control was performed using the systemic herbicides bentazon (720 g a.i. ha-1) and quizalofop-p-methyl (75 g a.i. ha-1). The remaining weeds were controlled manually. An application of thiamethoxam (14.1 g a.i. ha-1) was performed to control Enneothrips flavens, and three applications of the systemic fungicide pyraclostrobin (150 g a.i. ha-1) were performed to control leaf spot (Cercospora arachidicola and Pseudocercospora personata).
All plots were sprinkler irrigated until 35 days after emergence (DAE), with 300 mm water depth received during this initial period. Plots subjected to water deficits were not irrigated between 36 and 75 DAE, for a total of 40 days without irrigation. To avoid rainfall in the plots subjected to water deficits, movable shelters with sliding pulley wheels on iron tracks coupled to the bed sides were used. The shelters were composed of an iron structure and transparent polyethylene cover and sides and had the following dimensions: 10 m length x 5 m width x 2.8 m height. The plots that were not subjected to water deficit conditions were sprinkler irrigated two or three times a week, depending on rainfall, throughout the growth cycle to a total water depth of 600 mm.
Soil moisture during the period of water deficit was determined for all treatments using gravimetric methods at 35, 47, 54 and 70 DAE in the 0 to 20 cm soil layer. Water storage in the 0-20 cm soil layer was estimated according to Faria & Madramootoo (1996) for each evaluated period.
54 and 70 DAE. LA was measured on one leaf (four leaflets) from the middle third of each plant using a portable area meter (LI-3000C Li-Cor, USA). The total number of leaves per plant was quantified, and the total LA per hectare was calculated by multiplying the LA (m2) of one plant by the number of plants in one hectare. To quantify the DW, the selected plants were labeled, placed in paper bags, dried in a convection oven at 60 ºC ± 2ºC for 72 hours and then weighed. The DW per hectare was estimated by multiplying the number of plants per hectare by the DW of one plant.
At physiological maturation (94 DAE), 10 plants were collected from the useful area of each subplot, and the following characteristics were evaluated: number of nodes (NN), plant height or main stem length (PH), pods per plant (PP), seeds per pod (SP), weight of 100 seeds (WH) and total grain yield (YT). The YT was quantified following the harvest of each subplot, with 0.5 m discarded from both ends of each subplot. The grain moisture and weight were determined after pod processing. The grain production was expressed in kg ha-1 and corrected for 10 % standard moisture.
A reduction index (RI) was used to determine the percentage reduction caused by the water deficits, and it was calculated for all parameters quantified (DW, LA, NN, PH, PP, SP, WH and YT) according to the equation: RI (%) = 100 [(PNS - PWS) / PNS], where PND = parameter without water deficit and PWD = parameter with water deficit.
Regression analyses were performed for the DW and LA, and the best fit models were selected according to the coefficient of determination (R2). NN, PH, PP, SP, WH and YT were subjected to analyses of variance, with the drought treatments and genotypes as fixed effects. The mathematical model was Yijk = m + Pi + Bj + (PB)ij + Sk + (PS)ik + Eijk, where Yijk = the value observed for treatment i, genotype k and replicate j; m = the overall average of the trait; Pi = the effect of the i-th treatment (i = 1 or 2); Sk = the effect of the k-th genotype (k = 1, 2, 3, 4 or 5); Bj = the effect of the j-th plot (j = 1, 2 or 3); (PB)ij = random error a; (PS)ik = the effect of the interaction of the i-th treatment with k-th genotype; and Eijk =random error b. The quadratic components, coefficient of genetic variation (CVg), coefficient of environmental variation error a and
error b (CVa and CVb, respectively) and index B
were calculated according to the following equations:
ϕg = (MSG - MSEb) / rp; CVg = (√ϕg / m) x 100; CVb= (√MSEb / m) x 100; CVa = (√MEa / m) x 100); index B = CVg / CVe, where ϕg = genetic quadratic component; MSG = the mean square of genotype subplot; MSEb = the mean square of error b; r = the number of replicates; p = the number of genotypes; and m = the assay’s overall average. For YT, the Scott & Knott (1974) hierarchical cluster analysis was used to classify the treatments. Correlations between the quantified variables were evaluated using the Pearson product moment correlation coefficient (r). The significance of the correlations was analyzed using the t-test with n-2 degrees of freedom at p < 0.05. These analyses were performed using the software Genes (Cruz 2013).
RESULTS AND DISCUSSION
The available water for plants during the crop
cycle in the treatment without a water deficit was sufficient to meet the plants’ needs. Plots subjected to water deficit, however, always presented soil
water content lower than 50 % of the water holding capacity and higher than the permanent wilting point (Figure 1).
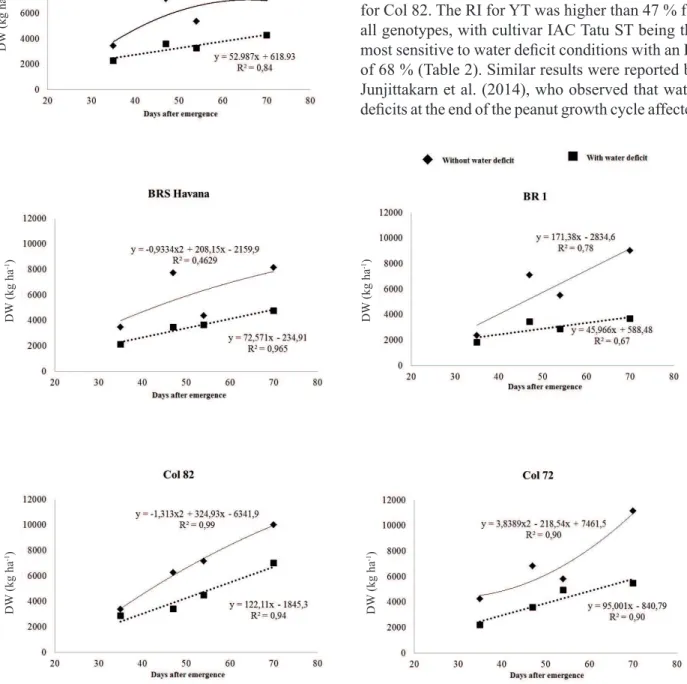
In treatments without water deficit, the DW for all genotypes was best fit by a quadratic model, except for cultivar BR1, which was best fit by a linear model. In treatments with a water deficit, the DW for all genotypes was best fit by a linear
model, with decreasing DW accumulation observed for all evaluated periods (Figure 2). This result was
expected because the first response of plants to water
deficit conditions is to decrease turgor, which inhibits photosynthesis and plant growth (Larcher 2006).
In treatments without a water deficit, the DW
decreased between 47 DAE and 54 DAE (Figure 2), which may be explained by the DW curve presenting a similar tendency to that of the soil water holding capacity (Figure 1). This indicates that the plants’ available water decreased during this period and likely reduced the production of photoassimilates and DW.
The magnitude of DW decrease under
water deficit conditions varied between different
genotypes. Breeding line Col 82 presented higher
DW (7,003 kg ha-1) at the end of the water deficit
period (Figure 2) and was the only genotype that did not present decreased DW with decreasing
Col 72 was the genotype that presented higher DW
accumulation (11,147 kg ha-1) without a water deficit
at 70 DAE (Figure 2).
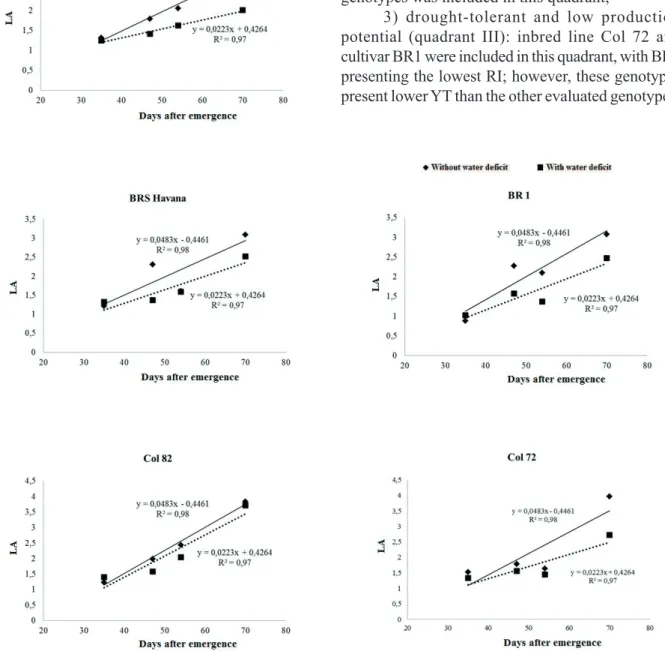
LA was best fit by linear models for the
treatments with and without a water deficit (Figure 3). Differences between treatments with and without a water deficit were observed with increasing water suppression time, although the response of different genotypes varied in magnitude (Figure 3). A decrease in LA is considered a defense mechanism against water deficit because smaller LAs result in lower transpiration and a decreased risk of suffering permanent wilting. However, decreased LA results in decreased productivity because of decreased light interception and photosynthesis (Graciano 2009). Therefore, the decreased LA caused by the water deficit affected DW production (Figure 2).
The analysis of variance showed a significant effect of water deficit on the NN (p = 0.005), PH
(p = 0.008), PP (p = 0.020) and YT (p = 0.016),
indicating that water availability influenced these parameters. Genotype only had a significant effect
on the NN (p = 0.012) and SP (p < 0.001), indicating that the five evaluated genotypes have genetic variability for these characteristics. The water
deficit x genotype interaction was not significant for
all analyzed parameters (p > 0.05) (Table 1). The CVg varied between 3.1 % for PH and 12.4 % for SP.
The environmental variation coefficient (CVe) varied
from moderate to low except for YT; thus, it exhibited a generally high experimental accuracy (Pimentel Gomes 2000). Index B, which is calculated as the
ratio between CVg and CVb, indicates the influence
of genetic variability relative to the environmental or random variance. Index B was below one (1), indicating that the environmental effects were stronger than the genetic effects for all variables
except for SP (Table 1).
Figure 1. Water storage in the 0 to 20 cm soil layer. (Londrina, PR, Brazil, 2012/2013). (FC: field capacity; PWP: permanent wilting point; DAE: days after emergence).
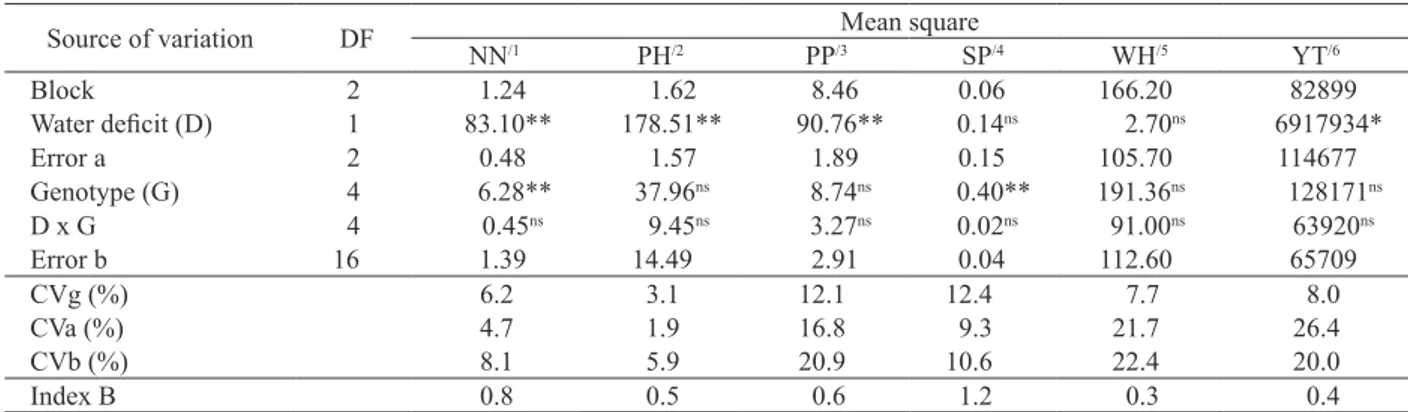
Table 1. Summary of the analysis of variance and estimates of the coefficients of genetic variation (CVg), coefficient of environmental variation error a (CVa), coefficient of environmental variation error b (CVb) and index B (CVg/CVb) for peanut genotypes grown with or without water deficit conditions (Londrina, PR, Brazil, 2012/2013).
NN/1: number of nodes; PH/2: plant height; PP/3: pods per plant; SP/4: seeds per pod; WH/5: weight of 100 seeds; YT/6: total grain yield; DF: degrees of freedom; ns: not
significant; **/*: significant according to the F test at p < 0.01 and p < 0.05, respectively.
Source of variation DF Mean square
NN/1 PH/2 PP/3 SP/4 WH/5 YT/6
Block 2 1.24 1.62 8.46 0.06 166.20 82899
Water deficit (D) 1 83.10** 178.51** 90.76** 0.14ns 2.70ns 6917934*
Error a 2 0.48 1.57 1.89 0.15 105.70 114677
Genotype (G) 4 6.28** 37.96ns 8.74ns 0.40** 191.36ns 128171ns
D x G 4 0.45ns 9.45ns 3.27ns 0.02ns 91.00ns 63920ns
Error b 16 1.39 14.49 2.91 0.04 112.60 65709
CVg (%) 6.2 3.1 12.1 12.4 7.7 8.0
CVa (%) 4.7 1.9 16.8 9.3 21.7 26.4
CVb (%) 8.1 5.9 20.9 10.6 22.4 20.0
Col 72, the decreases were not significant. The WH and SP were less affected, and although they presented positive RI values for most genotypes, their means were pooled into a single class to compare the water regimes per genotype. Water deficit period longer than 35 days caused decreased plant growth, although it did not prevent growth (Correia & Nogueira 2004). Water deficits decreased photosynthesis and plant growth and affected grain formation and development, which directly affected production.
The highest RIs were observed for parameters related to grain production, such as PP, which varied from 25.5 % for the inbred line Col 72 to 44.8 % for Col 82. The RI for YT was higher than 47 % for all genotypes, with cultivar IAC Tatu ST being the most sensitive to water deficit conditions with an RI of 68 % (Table 2). Similar results were reported by Junjittakarn et al. (2014), who observed that water deficits at the end of the peanut growth cycle affected
Figure 2.Dry weight (DW) at 35, 47, 54 and 70 days after emergence (DAE) of peanut genotypes IAC Tatu ST, BR1, BRS Havana, Col 72 and Col 82 grown with or without water deficit conditions (Londrina, PR, Brazil, 2012/2013).
Positive RI values were observed for all evaluated parameters for most genotypes, which indicates that
water deficits caused physiological changes in plants,
particularly on the parameters PP and YT, which were
reduced (Table 2). The production component most
affected by water deficit was the number of pods,
although in the BRS Havana cultivar and inbred line
DW
(kg ha
-1)
DW
(kg ha
-1)
DW
(kg ha
-1)
DW
(kg ha
-1)
DW
(kg ha
yield-related characteristics, such as pod DW and the harvest index.
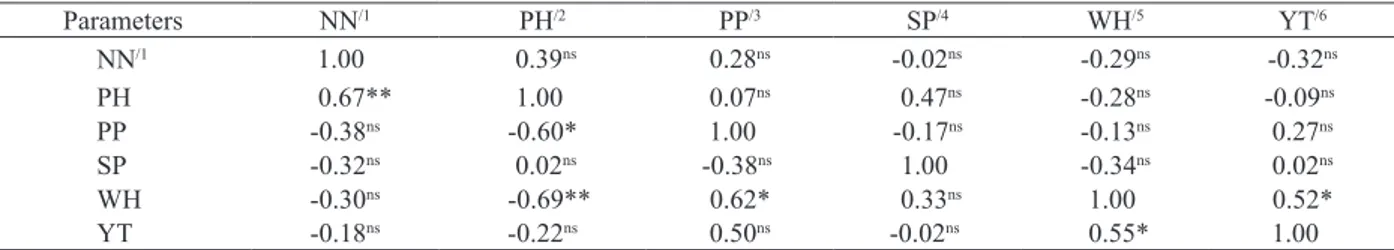
The YT and WH (0.52) were significantly positively correlated in the water deficit treatment
(p < 0.05) (Table 3). For plants grown without a water
deficit, significant positive correlations (p < 0.01 or
p < 0.05) were observed between the NN and PH (0.670), PP and WH (0.62) and YT and WH (0.55).
Plant height was significantly negatively correlated
with PP (-0.60) and WH (-0.69) (Table 3). The WH contributed most to the YT and was positively correlated with YT in treatments with and without a water deficit, indicating that this parameter is associated and can therefore be used to select plants with high productivity.
Based on the YT without water deficit and RI value for the YT, the evaluated genotypes were classified into four categories (Figure 4):
1) low drought tolerance and high production potential (quadrant I): cultivar IAC Tatu ST (RI value of 68 %) was included in this quadrant;
2) low drought tolerance and low production potential (quadrant II): none of the evaluated genotypes was included in this quadrant;
3) drought-tolerant and low production potential (quadrant III): inbred line Col 72 and cultivar BR1 were included in this quadrant, with BR1 presenting the lowest RI; however, these genotypes present lower YT than the other evaluated genotypes;
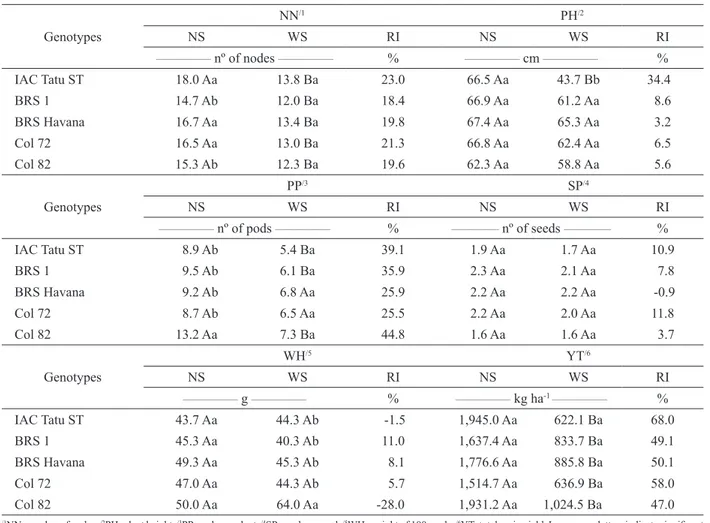
Table 2. Averages for the evaluated parameters and their respective reduction indexes (RIs) for five peanut genotypes grown without (NS) or with water stress (WS). (Londrina, PR, Brazil, 2012/2013).
/1NN: number of nodes; /2PH: plant height; /3PP: pods per plant; /4SP: seeds per pod; /5WH: weight of 100 seeds; /6YT: total grain yield. Lower case letters indicate significant
differences between plants of different genotypes grown under the same water regime. Upper case letters indicate significant differences between plants of the same genotype grown under different water regimes according to the Scott-Knott test (p < 0.05).
Figure 4. Relation between total grain yield without water deficit conditions and the reduction index for grain yield of the five studied
peanut genotypes. Quadrant I: low drought tolerance and high production potential; quadrant II: low drought tolerance and low production potential; quadrant III: drought-tolerant and low production potential; quadrant IV: drought-tolerant and high production potential. (Londrina, PR, Brazil, 2012/2013).
Genotypes
NN/1 PH/2
NS WS RI NS WS RI
______________ nº of nodes ______________ % ______________ cm ______________ %
IAC Tatu ST 18.0 Aa 13.8 Ba 23.0 66.5 Aa 43.7 Bb 34.4
BRS 1 14.7 Ab 12.0 Ba 18.4 66.9 Aa 61.2 Aa 8.6
BRS Havana 16.7 Aa 13.4 Ba 19.8 67.4 Aa 65.3 Aa 3.2
Col 72 16.5 Aa 13.0 Ba 21.3 66.8 Aa 62.4 Aa 6.5
Col 82 15.3 Ab 12.3 Ba 19.6 62.3 Aa 58.8 Aa 5.6
Genotypes
PP/3 SP/4
NS WS RI NS WS RI
______________ nº of pods ______________ % ____________ nº of seeds ____________ %
IAC Tatu ST 8.9 Ab 5.4 Ba 39.1 1.9 Aa 1.7 Aa 10.9
BRS 1 9.5 Ab 6.1 Ba 35.9 2.3 Aa 2.1 Aa 7.8
BRS Havana 9.2 Ab 6.8 Aa 25.9 2.2 Aa 2.2 Aa -0.9
Col 72 8.7 Ab 6.5 Aa 25.5 2.2 Aa 2.0 Aa 11.8
Col 82 13.2 Aa 7.3 Ba 44.8 1.6 Aa 1.6 Aa 3.7
Genotypes
WH/5 YT/6
NS WS RI NS WS RI
______________ g ______________ % ______________ kg ha-1 ______________ %
IAC Tatu ST 43.7 Aa 44.3 Ab -1.5 1,945.0 Aa 622.1 Ba 68.0
BRS 1 45.3 Aa 40.3 Ab 11.0 1,637.4 Aa 833.7 Ba 49.1
BRS Havana 49.3 Aa 45.3 Ab 8.1 1,776.6 Aa 885.8 Ba 50.1
Col 72 47.0 Aa 44.3 Ab 5.7 1,514.7 Aa 636.9 Ba 58.0
4) drought-tolerant and high production potential (quadrant IV): cultivar BRS Havana and inbred line Col 82 were included in this quadrant.
Pereira et al. (2012) also observed tolerance to drought and ability to manage prolonged drought conditions for cultivars BR1 and BRS Havana. The genotypes with tolerance to drought have the potential for cultivation in regions with frequent drought during summers.
CONCLUSIONS
1. The plant growth parameters dry weight and leaf area are negatively affected by water deficits. The intensity of the damage varies depending on the genotypes and is directly related to the duration of the period of water suppression.
2. Water deficits decreases total grain yield, pods per plant, seeds per pod and weight of 100 seeds. 3. Cultivar BRS Havana and inbred line Col 82 have moderate drought tolerance and high grain yield potential and may be used in breeding programs to obtain drought-tolerant cultivars.
REFERENCES
ANJUM, S. A. et al. Morphological, physiological and biochemical responses of plants to drought stress.African Journal of Agricultural Research, Victoria Island, v. 6, n. 9, p. 2026-2032, 2011.
CATIVELLI, L. et al. Drought tolerance improvement in crop plants: an integrated view from breeding to genomics.
Field Crops Research,Amsterdam, v. 105, n. 1, p. 1-14, 2008.
CHAVES, M. M.; OLIVEIRA, M. M. Mechanisms underlying plant resilience to water defecits: prospects for water-saving agriculture. Journal of Experimental Botany, Lancaster, v. 55, n. 407, p. 2365-2384, 2004.
CHAVES, M. M. et al. How plants cope with water stress
in the field. Annals of Botany, Exeter, v. 89, n. 6, p. 907-916, 2002.
COMPANHIA NACIONAL DE ABASTECIMENTO (Conab). Acompanhamento da safra brasileira de grãos. 2014. Disponível em: <http://www.conab.gov.
br/OlalaCMS/uploads/arquivos/14_03_12_08_41_24_ boletim_graos_marco_2014.pdf>. Acesso em: 24 fev. 2015.
CORREIA, K. G.; NOGUEIRA, R. J. M. C. Avaliação do crescimento do amendoim (Arachis hypogaea L.)
submetido a déficit hídrico. Revista de Biologia e Ciências da Terra, Campina Grande, v. 4, n. 2, p. 1-7, 2004.
CRUZ, C. D. GENES: a software package for analysis in experimental statistics and quantitative genetics.Acta Scientiarum, Maringá, v. 35, n. 3, p. 271-276, 2013.
DUARTE, E. A. A. et al. Características agronômicas e índice de colheita de diferentes genótipos de amendoim submetidos a estresse hídrico. Revista Brasileira de Engenharia Agrícola e Ambiental, Campina Grande, v. 17, n. 8, p. 843-847, 2013.
FARIA, R. T.; MADRAMOOTOO, C. A. Simulation of
soil moisture profiles for wheat in Brazil. Agricultural
Water Management,Amsterdam, v. 31, n. 1, p. 35-49,
1996.
FOOD AND AGRICULTURE ORGANIZATION (FAO).
Year book. 2013. Disponível em: <http//www.fao.org/
inicio.html>. Acesso em: 25 out. 2013.
GONÇAVES, J. A. et al. Componentes de produção de amendoim em diferentes arranjos espaciais no Recôncavo Baiano. Revista Brasileira de Oleaginosas e Fibrosas, Campina Grande, v. 8, n. 2/3, p. 801-812, 2004.
GRACIANO, E. S. A. Estudos fisiológicos e bioquímicos
de cultivares de amendoim (Arachis hypogaea L.) submetidas à deficiência hídrica.2009. 66 f. Dissertação (Mestrado em Botânica) - Universidade Federal Rural de Pernambuco, Recife, 2009.
Table 3. Correlations between the evaluated phenotypic characters in five peanut genotypes in treatments with (upper diagonal) and without a water deficit (lower diagonal). (Londrina, PR, Brazil, 2012/2013).
ns: not significant; *, **: significant according to the t-test with n-2 degrees of freedom, at p < 0.05 and p < 0.01, respectively. NN/1: number of nodes at the main stem;
PH/2: plant height; PP/3: pods per plant; SP/4: seeds per pod; WH/5: weight of 100 seeds; YT/6: total grain yield.
Parameters NN/1 PH/2 PP/3 SP/4 WH/5 YT/6
NN/1 1.00 0.39ns 0.28ns -0.02ns -0.29ns -0.32ns
PH 0.67** 1.00 0.07ns 0.47ns -0.28ns -0.09ns
PP -0.38ns -0.60* 1.00 -0.17ns -0.13ns 0.27ns
SP -0.32ns 0.02ns -0.38ns 1.00 -0.34ns 0.02ns
WH -0.30ns -0.69** 0.62* 0.33ns 1.00 0.52*
INSTITUTO AGRONÔMICO DO PARANÁ (Iapar).
Cartas climáticas do Estado do Paraná. Londrina: Iapar, 1994.
JUNJITTAKARN J. et al. Response of root characteristics and yield in peanut under terminal drought condition.
Chilean Journal of Agricultural Research,Chillán, v. 74, n. 3, p. 249-256, 2014.
LARCHER, W. Ecofisiologia vegetal.São Carlos: RIMA, 2006.
NAKAGAWA, J.; ROSOLÉM, C. A. O amendoim: tecnologia de produção. Bauru: Fepaf, 2011.
PEREIRA, J. W. L. et al. Mudanças bioquímicas em genótipos de amendoim submetidos a déficit hídrico
moderado. Revista Ciência Agronômica, Fortaleza, v. 43, n. 4, p. 766-773, 2012.
PIMENTEL-GOMES, F. Curso de estatística experimental. 14. ed. Piracicaba: Nobel, 2000.
SHEFFIELD, J. et al. Little change in global drought over the past 60 years. Nature, London, v. 491, n. 7424, p. 435-438, 2012.
TEIXEIRA, E. I. et al. Global hot-spots of heat stress on agricultural crops due to climate change. Agricultural and
Forest Meteorology, Amsterdam, v. 170, n. 1, p. 206-215,
2013.