Diagnostic performance of various cephalometric
parameters for the assessment of vertical growth pattern
Maheen Ahmed1, Attiya Shaikh2, Mubassar Fida3
Introduction: Multiple cephalometric analyses are used to diagnose vertical skeletal facial discrepancy. A multitude of times, these pa-rameters show conflicting results, and a specific diagnosis is hard to reach. Objective: Hence, this study aimed to identify the skeletal analysis that performs best for the identification of vertical skeletal pattern in borderline cases. Methods: The sample consisted of 161 subjects (71 males and 90 females; mean age = 23.6 ± 4.6 years). Y-axis, Sella-Nasion to mandibular plane angle (SN.MP), maxillary plane to mandibular plane angle (MMA), Sella-Nasion to Gonion-Gnathion angle (SN.GoGn), Frankfort to mandibular plane angle (FMA), R-angle and facial height ratio (LAFH.TAFH) were used to evaluate vertical growth pattern on lateral cephalograms. The sub-jects were divided into three groups (hypodivergent, normodivergent and hyperdivergent groups), as indicated by the diagnostic results of the majority of parameters. Kappa statistics was applied to compare the diagnostic accuracy of various analyses. To further validate the results, sensitivity and positive predictive values (PPV) for each parameter were also calculated. Results: SN.GoGn showed a substantial interclass agreement (k = 0.850). In the hypodivergent group, MMA showed the highest sensitivity (0.934), whereas FMA showed the highest PPV (0.964). In the normodivergent group, FMA showed the highest sensitivity (0.909) and SN.GoGn had the highest PPV (0.903). SN.GoGn showed the highest sensitivity (0.980) and PPV (0.87) in the hyperdivergent group. Conclusions:
SN.GoGn and FMA were found to be the most reliable indicators, whereas LAFH.TAFH is the least reliable indicator in assessing facial vertical growth pattern. Hence, the cephalometric analyses may be limited to fewer analyses of higher diagnostic performance.
Keywords: Divergence. Cephalometry. Vertical dimension.
1 Resident in Orthodontics, The Aga Khan University Hospital, Section of
Dentistry, Department of Surgery, Karachi, Pakistan.
2 Consultant Orthodontist/Assistant Professor, Program Coordinator
Orthodontics Residency Program, The Aga Khan University Hospital, Section of Dentistry, Department of Surgery, Karachi, Pakistan.
3 Consultant Orthodontist/Associate Professor, Program Director Orthodontics
Residency Program, The Aga Khan University Hospital, Section of Dentistry, Department of Surgery, Karachi, Pakistan.
Contact address: Maheen Ahmed
The Aga Khan University Hospital, P.O Box 3500, Stadium Road, Karachi 74800, Pakistan - Email: [email protected]
DOI: http://dx.doi.org/10.1590/2177-6709.21.4.041-049.oar
How to cite this article: Ahmed M, Shaikh A, Fida M. Diagnostic performance of various cephalometric parameters for the assessment of vertical growth pattern. Dental Press J Orthod. 2016 Jul-Aug;21(4):41-9.
DOI: http://dx.doi.org/10.1590/2177-6709.21.4.041-049.oar
Submitted: August 09, 2015 - Revised and accepted: December 17, 2015
» The authors report no commercial, proprietary or financial interest in the products or companies described in this article.
Introdução: diferentes análises cefalométricas são utilizadas para se diagnosticar a discrepância esquelética vertical da face. Muitas vezes, essas análises revelam resultados conflitantes, tornado complicado obter um diagnóstico preciso. Objetivo: o objetivo do presente estudo foi identificar a melhor análise esquelética para identificação do padrão esquelético vertical em casos limítrofes. Métodos: a amostra con-sistiu em 161 indivíduos (71 homens e 90 mulheres, com idade média de 23,6 ± 4,6 anos). Para avaliar o padrão de crescimento vertical em telerradiografias de perfil, foram utilizados: o eixo Y, o ângulo formado entre a linha sela-násio e o plano mandibular (SN.MP), ângulo formado pelos planos maxilar e mandibular (MMA), ângulo formado pelas linhas sela-násio e gônio-gnátio (SN.GoGn), ângulo formado pelo plano de Frankfort e o plano mandibular (FMA), o ângulo R, e a proporção de altura facial (AFAI.AFAT). Os indivíduos foram divididos em três grupos (hipodivergente, neutro e hiperdivergente), em acordo com os resultados diagnósticos da maioria dessas medidas. A análise estatística Kappa foi empregada para comparar a precisão diagnóstica das diferentes análises. Para uma validação adicional dos resultados, também foram calculados, para cada medida, a sensibilidade e os valores preditivos positivos (VPP). Resultados: o SN.GoGn apresentou um valor alto de concordância interclasses (k = 0,850). No grupo hipodivergente, o MMA apresentou a maior sensibilidade (0,934), enquanto o FMA apresentou o VPP mais alto (0,964). No grupo neutro, o FMA apresentou a maior sensibilidade (0,909), en-quanto o SN.GoGn apresentou o VPP mais alto (0,903). No grupo hiperdivergente, o SN.GoGn apresentou a maior sensibilidade (0,980) e o valor mais alto de VPP (0,87). Conclusões: constatou-se que, para avaliação do padrão de crescimento facial vertical, o SN.GoGn e o FMA foram os indicadores mais confiáveis, enquanto o AFAI.AFAT foi o indicador menos confiável. Sendo assim, a análise cefalométrica pode se limitar às análises com maior desempenho diagnóstico.
INTRODUCTION
Facial vertical growth pattern plays a vital role in
achieving facial balance.1 Variations in vertical growth
are common and have certain orthodontic implications. A long or a short face may be due to abnormal hard or sot tissues that form the face. Growth excess in the verti-cal dimension may result in gingival smile, incompetent
lips and a long face.2 On the contrary, a deiciency in
ver-tical growth may lead to inadequate display of incisors,
overclosure of lips and a short face.3 Both facial types are
considered unesthetic and are included in the orthodon-tic problem list. Treatment of such problems is usually carried out by functional jaw orthopedics in growing patients and by orthognathic surgery in adults. The suc-cess of a treatment plan in Orthodontics is not only de-pendent on understanding where growth occurs, but also
when it ends.4 As the vertical component of growth is the
last to end, failure to control it may lead to complex
treat-ment, compromised results and relapse ater treatment.5,6
This mandates a thorough assessment and an accurate di-agnostic evaluation of such discrepancies in the vertical facial pattern to ensure treatment success.
Lateral cephalometry has made the assessment of vertical skeletal problems an easy and accurate process.
Downs,7 in 1948, used Frankfort horizontal (FH) plane
as the reference line on lateral cephalograms to assess the mandibular diversion pattern, using Y-axis and the Frankfort mandibular plane angle (FMA).
Stein-er8 postulated Sella-Nasion to mandibular plane angle
(SN.MP) to assess vertical growth pattern using the
anterior cranial base as the reference plane. Schwartz,9
using the palatal plane, proposed the maxillary/mandib-ular planes angle (MMA) to assess intermaxillary rela-tionship in the vertical dimension. Later, linear param-eters, which included Jarabak’s ratio and facial height ratio (LAFH.TAFH) were also used to assess the facial
vertical growth of an individual.10
There are various linear and angular analyses for eval-uating vertical skeletal growth of an individual. The com-monly used angular analyses include Sella-Nasion to Go-nion-Gnathion plane angle (SN.GoGn), Sella-Nasion to Gonion-Menton plane angle (SN.MP), Frankfort to mandibular plane angle (FMA), maxillary/mandibular
planes angle (MMA) and Y-axis.7,8,9,11 The linear
param-eters used to determine vertical growth pattern include
Jarabak’s ratio and facial height ratio (LAFH.TAFH).10
A literature review showed that all of the aforementioned
parameters have some shortcomings in terms of
identi-fying the landmarks.12,13 Paranhos et al,12 in their study,
reported the Y-axis to be inadequate to assess vertical dysplasia, as the position of Gnathion (Gn) varies with sagittal malocclusion. Similarly, FMA was considered to be less reliable, as landmarks forming the FH plane are
diicult to identify.13 To overcome the aforementioned
shortcomings, new cephalometric analyses, such as the
R-angle,are still being introduced.14
Apart from potential errors in landmark identiica-tion, the cephalometric norms established by the previ-ous studies may not serve adequately for other popu-lation groups. A survey of the pertinent literature also showed that variation within the norms may occur due
to ethnic diferences. Shaikh and Alvi,15 in their study
on a sample of Pakistani population, showed a difer-ence in facial height ratio, as compared to Caucasians. In contrast, another study reported a normal facial
height of 50-55 % in Pakistani subjects.16 Because of
these inherited discrepancies, the norms could only be used as a reference and not as absolute values.
Previously, many studies have reported the
corre-lation between various skeletal analyses,17,18 but only a
few have compared the diagnostic accuracy and the
ap-plicability of the various analyses.19 Moreover, during
cephalometric analysis, certain cases present with a wide range of readings and not all the parameters used to as-sess vertical growth indicate a speciic pattern. Hence, this study aimed to identify the skeletal analysis that per-forms best for the identiication of vertical facial pattern in borderline cases. Thus, unnecessary analysis can be eliminated, leading to an eicient treatment plan.
MATERIAL AND METHODS
A cross sectional study was conducted with the data collected from the diagnostic records of patients visit-ing the dental clinics of the authors. Keepvisit-ing a power of
study (β) as 80%, α = 0.05, and using the correlation value
(r) = 0.168, as reported by Asad and Naeem,18 sample size
was calculated to be 126. This number was inlated by 10%, which showed that we needed at least 135 subjects.
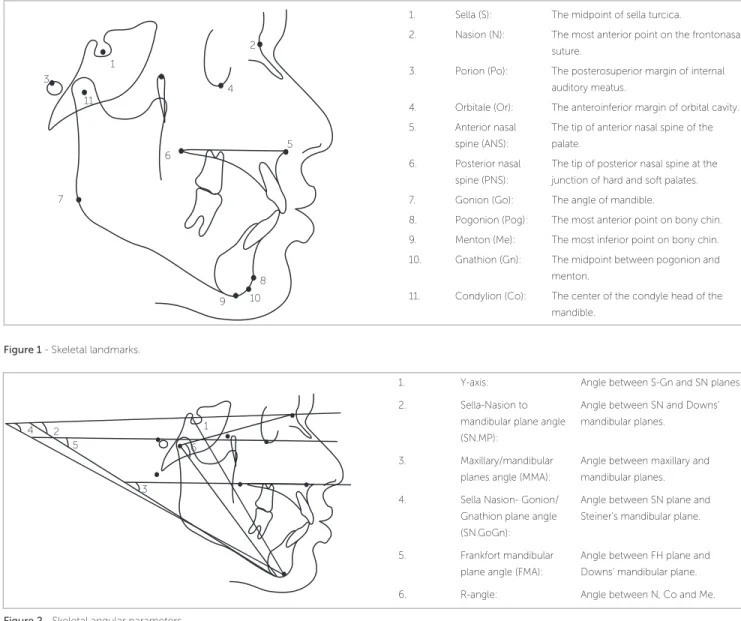
Figure 1 - Skeletal landmarks.
Figure 2 - Skeletal angular parameters.
1. Sella (S): The midpoint of sella turcica.
2. Nasion (N): The most anterior point on the frontonasal suture.
3. Porion (Po): The posterosuperior margin of internal auditory meatus.
4. Orbitale (Or): The anteroinferior margin of orbital cavity. 5. Anterior nasal
spine (ANS):
The tip of anterior nasal spine of the palate.
6. Posterior nasal spine (PNS):
The tip of posterior nasal spine at the junction of hard and soft palates. 7. Gonion (Go): The angle of mandible.
8. Pogonion (Pog): The most anterior point on bony chin. 9. Menton (Me): The most inferior point on bony chin. 10. Gnathion (Gn): The midpoint between pogonion and
menton.
11. Condylion (Co): The center of the condyle head of the mandible.
1. Y-axis: Angle between S-Gn and SN planes. 2. Sella-Nasion to
mandibular plane angle (SN.MP):
Angle between SN and Downs’ mandibular planes.
3. Maxillary/mandibular planes angle (MMA):
Angle between maxillary and mandibular planes. 4. Sella Nasion- Gonion/
Gnathion plane angle (SN.GoGn):
Angle between SN plane and Steiner’s mandibular plane.
5. Frankfort mandibular plane angle (FMA):
Angle between FH plane and Downs’ mandibular plane. 6. R-angle: Angle between N, Co and Me. 1
3
6
9 2
5
8 4
7
10 11
1 2
6 4
3 5
Figure 3 - Skeletal linear parameters.
1. Total anterior facial height (TAFH):
Linear distance between N and Me.
2. Lower anterior facial height (LAFH):
Linear distance between ANS and Me.
3. Upper anterior facial height (UAFH):
Linear distance between N and ANS.
Facial height ratio (LAFH/TAFH): Ratio of LAFH/TAFH.
1 2
Pretreatment lateral cephalograms were used to evalu-ate vertical skeletal patterns. The distance from the imag-ing device to the midsagittal plane of the patient was kept constant at 60 cm, and the distance from the ilm to the midsagittal plane was kept at 15 cm. Cephalograms were traced by hand on matte acetate paper, with a 0.5-mm lead pencil, over an illuminator, by the main investiga-tor using the conventional method. Skeletal landmarks were identiied (Fig 1). Measurements were taken with the help of a millimeter ruler and a protractor.
The angular parameters were measured as described bellow (Fig 2):
» Y-axis: The angle between S-Gn and SN planes.
» Sella-Nasion to mandibular plane angle (SN.MP):
Angle between SN and Downs’ mandibular planes.
» Maxillary/mandibular planes angle (MMA): The
angle between maxillary and mandibular planes.
» Sella-Nasion to Gonion-Gnathion angle (SN.GoGn):
The angle between SN and Steiner’s mandibular planes.
» Frankfort mandibular plane angle (FMA): The angle
between FH and Downs’ mandibular plane.
» R-angle: The angle between N, Co and Me.
The skeletal linear parameters were the following (Fig 3):
» Total anterior facial height (TAFH): Linear
dis-tance between N and M.
» Lower anterior facial height: (LAFH): Linear
dis-tance between ANS and Me.
» Facial height ratio (LAFH.TAFH): The ratio of
LAFH/TAFH.
The cephalometric norms of each skeletal analysis pre-viously established in the literature were used in the study (Table 1). On the basis of norms of each parameter, the subjects were labeled as hypodivergent, normodivergent and hyperdivergent. Nineteen subjects were shown to have the same facial pattern by all the parameters and thus were eliminated based on a clear-cut diagnosis. Each of the re-maining 161 subjects had at least one cephalometric analy-sis giving conlicting diagnoanaly-sis of the vertical facial pattern. The inal diagnosis of vertical growth pattern of these sub-jects was based on the results of the majority of parameters, which enabled us to divide our sample into hypodivergent, normodivergent or hyperdivergent. Thus, the division of our sample resulted in the following groups:
» Low angle: 46. » Normal angle: 66. » High angle: 49.
The cases in which diagnosis of a particular cephalometric parameter matched the final diagno-sis were regarded as the correctly diagnosed cases. The number of correctly diagnosed cases was used to assess the diagnostic performance of each of the cephalometric parameters.
To assess intraexaminer reliability, 30 radiographs were randomly selected and reanalyzed by the main in-vestigator. The intraclass correlation coeicient denoted that the original and the repeated measurements showed a high correlation (Table 2).
Data were analyzed by means of SPSS for Win-dows (version 20.0, SPSS Inc. Chicago, USA). Vari-ous vertical skeletal parameters were correlated by means of Pearson Correlation. Correlations among various skeletal parameters were also determined separately for males and females. Kappa statistics was applied to assess the level of agreement between the diagnostic interpretation of cephalometric parameters and the final diagnosis made from the majority factor. Positive predictive value (PPV) and the sensitivity of each cephalometric analysis were calculated from the
two-by-two tables. A p-value of < 0.05 was taken as
statistically significant.
RESULTS
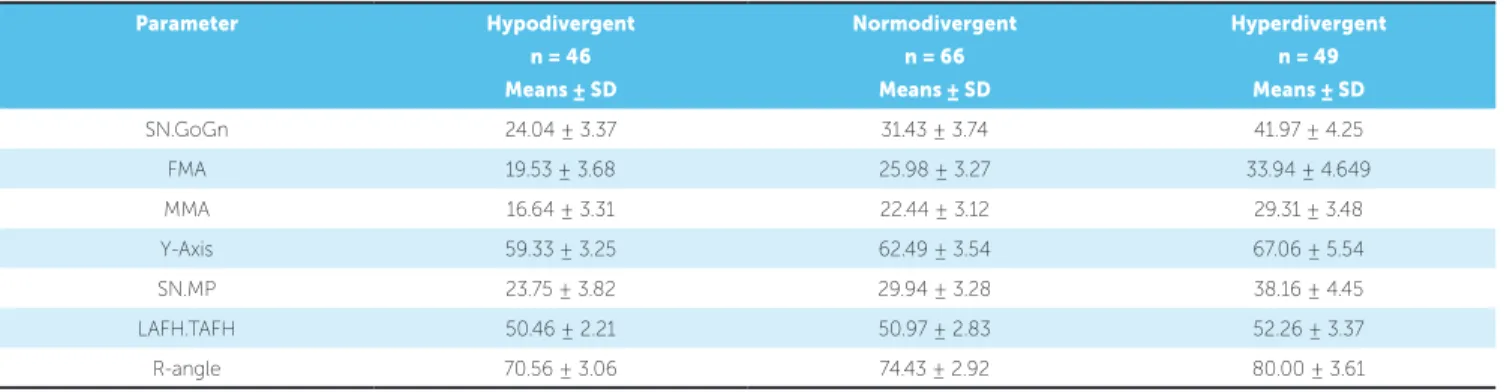
The sample consisted of 161 subjects that includ-ed 90 females (mean age = 24.65 ± 4.08 years) and 61 males (mean age = 22.48 ± 4.89 years). The subjects were divided into hypodivergent, normodivergent and hyperdivergent groups. The means and standard de-viation of each cephalometric parameter are shown in Table 3. The groups were statistically matched on the basis of chronological age and sagittal relationship.
Pearson Correlation was used to determine the correlation between various skeletal analyses. A strong correlation was present between SN.GoGn and FMA (r = 0.874), SN.GoGn and SN.MP (r = 0.852), and SN.GoGn and MMA (r = 0.811). A moderate positive correlation was present between FMA and R-angle (r = 0.724), FMA and SN-GoMn (r = 0.769), FMA and MMA (r = 0.776) and R-angle and MMA (r = 0.675) (Table 4).
Parameter Hypodivergent Normodivergent Hyperdivergent
SN.GoGn8 < 28° 28°-36° >36°
FMA7 < 21° 21°-29° >29°
MMA9 < 21° 21°-29° >29°
Y-Axis8 <61° 61°-68° >68°
SN.MP7 < 28° 28°-36° > 36°
Facial height ratio (LAFH.TAFH)16 < 50% 50-55 % > 55%
R-angle14 < 70.5° 70.5°-75.5° > 75.5°
Table 1 - Cephalometric norms of skeletal analyses.
Table 2 - Intraclass correlation coefficient.
ICC: Intraclass correlation coefficient. n = 30.
Measurements 1
st reading 2nd reading
ICC
(n = 30) (n = 30)
SN.GoGn 28.90 ± 8.49 29.10 ± 8.29 0.997
FMA 25.17 ± 6.61 25.33 ± 6.33 0.994
MMA 21.63 ± 5.98 21.86 ± 6.02 0.996
Y-axis 66.60 ± 4.56 66.66 ± 4.59 0.995
SN.MP 27.83 ± 7.07 27.86 ± 7.12 0.997
ANS-Me 68.10 ± 6.68 68.36 ± 6.62 0.997
Na-Me 52.51 ± 3.71 52.48 ± 3.90 0.990
R-angle 72.53 ± 4.06 72.36 ± 4.11 0.994
Kappa statistics assessed the agreement among diag-nostic criteria of various cephalometric analyses. A sub-stantial agreement was present between SN.GoGn and
the inal group (k = 0.850, p < 0.01) (Table 7).
Positive predictive value (PPV) and sensitivity of each diagnostic parameter were also calculated for each group separately. In the hypodivergent group, MMA showed the highest sensitivity (0.934), whereas FMA showed the highest PPV (0.964). In the normodiver-gent group, FMA showed the highest sensitivity (0.909) and SN.GoGn had the highest PPV (0.903). SN.GoGn showed the highest sensitivity (0.980) and PPV (0.87) in the hyperdivergent group (Table 8).
DISCUSSION
In orthodontic diagnosis and treatment planning, it is essential to accurately assess an individual’s facial skeletal pattern in all three dimensions, i.e. transverse, vertical and sagittal. The vertical facial pattern forms an impor-tant aspect in Orthodontics during the process of diag-nosis and treatment planning by deining the variability in treatment planning, mechanics as well as in facial
pro-portions.11 Tweed20 has related the stability of mandibular
Table 6 - Correlation among various skeletal analyses to assess vertical growth pattern in females.
n = 90; Pearson correlation: weak correlation (± 0.01 < r < ± 0.5); moderate correlation (± 0.5 < r < ± 0.8); strong correlation (± 0.8 < r < ± 1). *p < 0.05; ** p < 0.01.
Y-axis FMA SN.GoGn R-angle SN.MP MMA LAFH.TAFH
Y-axis 1 0.585** 0.570** 0.599** 0.376** 0.419** 0.050
FMA 1 0.850** 0.669** 0.657** 0.640** 0.119
SN.GoGn 1 0.744** 0.806** 0.782** 0.190
R-angle 1 0.604** 0.650** 0.187
SN.MP 1 0.736** 0.041
MMA 1 0.148
LAFH.TAFH 1
Table 3 - Mean value of cephalometric parameters.
SD: standard deviation. n = 161.
Parameter Hypodivergent
n = 46 Means ± SD
Normodivergent
n = 66 Means ± SD
Hyperdivergent
n = 49 Means ± SD
SN.GoGn 24.04 ± 3.37 31.43 ± 3.74 41.97 ± 4.25
FMA 19.53 ± 3.68 25.98 ± 3.27 33.94 ± 4.649
MMA 16.64 ± 3.31 22.44 ± 3.12 29.31 ± 3.48
Y-Axis 59.33 ± 3.25 62.49 ± 3.54 67.06 ± 5.54
SN.MP 23.75 ± 3.82 29.94 ± 3.28 38.16 ± 4.45
LAFH.TAFH 50.46 ± 2.21 50.97 ± 2.83 52.26 ± 3.37
R-angle 70.56 ± 3.06 74.43 ± 2.92 80.00 ± 3.61
n = 161; Pearson correlation: weak correlation (± 0.01 < r < ± 0.5); moderate correlation (± 0.5 < r < ± 0.8); strong correlation (± 0.8 < r < ± 1). *p < 0.05; ** p < 0.01. Table 4 - Correlation among various skeletal analyses to assess vertical growth pattern.
Y-axis FMA SN.GoGn R-angle SN.MP MMA LAFH.TAFH
Y-axis 1 0.592** 0.595** 0.622** 0.489** 0.475** -0.033
FMA 1 0.874** 0.724** 0.769** 0.776** 0.208**
SN.GoGn 1 0.776** 0.852** 0.818** 0.222**
R-angle 1 0.678** 0.675** 0.243**
SN.MP 1 0.811** 0.131
MMA 1 0.179*
LAFH.TAFH 1
Table 5 - Correlation among various skeletal analyses to assess vertical growth pattern in males.
n = 71; Pearson correlation: weak correlation (± 0.01 < r < ± 0.5); moderate correlation (± 0.5 < r < ± 0.8); strong correlation (± 0.8 < r < ± 1). *p < 0.05; ** p < 0.01.
Y-axis FMA SN.GoGn R-angle SN.MP MMA LAFH.TAFH
Y-axis 1 0.634** 0.644** 0.670** 0.658** 0.570** -0.144
FMA 1 0.901** 0.802** 0.862** 0.877** 0.298*
SN.GoGn 1 0.821** 0.898** 0.854** 0.260*
R-angle 1 0.779** 0.720** 0.292*
SN.MP 1 0.875** 0.232
MMA 1 0.217
Table 8 - Assessment of agreement among diagnostic criteria of skeletal analyses. Table 7 - Assessment of agreement among diagnositic criteria of skeletal analyses.
Positive predictive value; Sensitivity. n = 161.
n = 161; Kappa Statistics.
Parameter Hypodivergent (n = 46) Normodivergent (n = 66) Hyperdivergent (n = 49)
Correctly
diagnosed cases
Positive
predictive value
Sensitivity Correctly
diagnosed cases
Positive
predictive value
Sensitivity Correctly
diagnosed cases
Positive predictive
value
Sensitivity
SN.GoGn 40 0.816 0.869 56 0.903 0.848 43 0.980 0.871
MMA 43 0.741 0.934 50 0.649 0.757 26 0.961 0.530
Y-axis 42 0.381 0.913 18 0.428 0.272 11 0.888 0.224
FMA 27 0.964 0.586 60 0.714 0.909 44 0.897 0.897
SN-GoMn 41 0.914 0.891 50 0.694 0.757 32 0.914 0.653
LAFH/TAFH 11 0.222 0.239 39 0.649 0.590 8 0.961 0.163
R-angle 25 0.892 0.50 47 0.648 0.712 40 0.711 0.816
eicient treatment planning, it is of utmost signiicance to prevent relapse ater the corrected malocclusion.
There are various skeletal parameters used to assess the vertical growth pattern of an individual. A multi-tude of times diferent parameters show conlicting re-sults, and a speciic diagnosis is hard to reach. Hence, this study focused on evaluating the diagnostic accuracy of various parameters so that the process of diagnosis may be limited to a minimal number of analyses.
In the present study, a inal diagnosis of vertical growth pattern was made on the basis of the results of the majority of analyses. The results of this inal diag-nosis were treated as the gold standard and were used to compare the diagnostic performance of the seven analy-ses using sensitivity, positive predictive value as well as Kappa statistics. The groups statistically matched well on the basis of age and sagittal patterns.
Correlation between various skeletal parameters has
already been reported in the literature.17,18,19 In our study,
all skeletal analyses showed a signiicant correlation with each other. A strong correlation was present between SN.GoGn and all the other skeletal analyses, except fa-cial height ratio (LAFH.TAFH). MMA showed a mod-erate correlation with other skeletal analyses. Our re-sults are in concordance with another study conducted
by Asad and Naeem.18
SN.MP and SN.GoGn showed a strong
correla-tion in both males (r = 0.898, p < 0.01) and females
(r = 0.806). In contrast, Bahrou et al17 reported a
mod-erate correlation between MMA and facial height ra-tio (LAFH.TAFH) in males (r = 0.550) and females (r = 0.497). The heterogeneity in results might be due to a diference in sample size. It is worth mentioning that any value of correlation does not relate to the diag-nostic accuracy of any analysis.
Hence, in the present study, to compare the diag-nostic agreement between skeletal analyses and the i-nal diagnosis, Kappa statistics was applied. A substantial
Parameter Hypodivergent Normodivergent Hyperdivergent n =161
n = 46 n = 66 n = 49 Kappa P-value
SNGoGn 49 62 50 0.850** 0.000
MMA 58 77 26 0.590** 0.000
YAxis 110 42 9 0.152** 0.001
FMA 28 84 49 0.711** 0.000
SNGoMn 54 72 25 0.639** 0.000
LAFH/TAFH 50 87 24 0.046* 0.0401
agreement was present between SN.GoGn and the inal group (k = 0.850). Kappa statistics accounts whether a certain parameter indicates a speciic vertical pattern simply by chance and provides more information than a
simple correlation between two parameters.21
To evaluate validity of diagnostic indicators in iden-tifying the vertical skeletal pattern, sensitivity was also calculated in each group separately. MMA showed a high sensitivity in the hypodivergent group (0.934), whereas FMA showed the highest sensitivity in normo-divergent (0.909) and hypernormo-divergent groups (0.897).
To further clarify whether a certain parameter can truly diagnose the vertical pattern, this study reports the positive predictive values (PPV) of all cephalometric parameters used in the present study. FMA yielded the highest PPV in the hypodivergent group (0.964), whereas SN.GoGn yielded the highest PPV in nor-modivergent (0.903) and hyperdivergent (0.897) groups. Thus, despite lesser sensitivity values, FMA and SN.GoGn proved to be more valid indicators in deter-mining vertical skeletal pattern.
Multiple parameters can be used to evaluate the vertical growth pattern of an individual. In the pres-ent study, only the analyses commonly used during orthodontic diagnosis, indicating a specific growth pattern of the jaws in reference to the cranial base, were included. Other analyses, such as facial axis and facial depth angle, were excluded, as they in-dicate only chin position with respect to the
cra-nial base.22 As new parameters are being proposed,
analyses, such as R-angle, were also included in the study to check their reliability against commonly
used analyses.14
With advances in digital imaging and tridimen-sional (3D) imaging technique, using the two-dimensional imaging technique (lateral cephalo-gram) to evaluate skeletal jaw relationship may be
a potential limitation of this study.23,24 A survey of
the current literature showed that although CBCT-generated images are better at evaluating skeletal jaw discrepancy, manual and digital lateral cephalograms are still reliable and valid for scientific research with
the added advantage of a lower radiation dose.25,26,27
CONCLUSIONS
1. A strong correlation was found between SN.GoGn and other skeletal vertical analyses, except facial height ratio (LAFH.TAFH).
2. SN.GoGn and FMA were found to be the most reliable indicators in assessing facial vertical growth pattern.
3. Facial height ratio (LAFH.TAFH) was found to be the least reliable indicator in assessing facial vertical growth pattern.
Hence, the number of cephalometric analyses to evaluate vertical skeletal jaw discrepancy may be re-duced to a few analyses with higher diagnostic per-formance. This may result in accurate diagnosis and efficient treatment plan based on an individual’s facial soft tissue pattern.
Acknowledgements
1. Janson GR, Metaxas A, Woodside DG. Variation in maxillary and mandibular molar and incisor vertical dimension in 12-year-old subjects with excess, normal, and short lower anterior face height. Am J Orthod Dentofacial Orthop. 1994 Oct;106(4):409-18.
2. Schendel SA, Eisenfeld J, Bell WH, Epker BN, Mishelevich DJ. The long face syndrome: vertical maxillary excess. Am J Orthod. 1976 Oct;70(4):398-408. 3. Opdebeeck H, Bell WH. The short face syndrome. Am J Orthod. 1978
May;73(5):499-511.
4. Bishara SE, Jakobsen JR. Changes in overbite and face height from 5 to 45 years of age in normal subjects. Angle Orthod. 1998 Jun;68(3):209-16.
5. Enoki C, Telles CS, Matsumoto MA. Dental-skeletal dimensions in growing individuals with variations in the lower facial height. Braz Dent J. 2004;15(1):68-74.
6. Cook AH, Sellke TA, BeGole EA. Control of the vertical dimension in Class II correction using a cervical headgear and lower utility arch in growing patients. Part I. Am J Orthod Dentofacial Orthop. 1994 Oct;106(4):376-88.
7. Downs WB. Variations in facial relationships; their signiicance in treatment and prognosis. Am J Orthod. 1948 Oct;34(10):812-40.
8. Steiner CC. Cephalometrics for you and me. Am J Orthod. 1953 Oct;39(10):720-55.
9. Schwartz AM. Roentgenostatics. Am J Orthod. 1961 Aug;47(8):561-85. 10. Horn AJ. Facial Height Index. Am J Orthod Dentofacial Orthop.
1992 Aug;102(2):180-6.
11. Ricketts RM. Planning treatment on the basis of the facial pattern and an estimate of its growth. Angle Orthod. 1957 Jan;27(1):14-37.
12. Paranhos LR, Brando TM, Kaieda AK, Ramos AL, Torres FC. The inadequacy of the Y-axis of growth (SNGn) for the vertical pattern assessment in patients with sagittal discrepancies. J Contemp Dent Pract. 2014 Mar 1;15(2):169-73. 13. Jacobson A. Radiographic cephalometry. How reliable is cephalometric
prediction? Chicago: Quintessence; 1995.
14. Rizwan M, Mascarenhas R. A new parameter for assessing vertical skeletal discrepancies: the R angle. Rev Latinoam Ortodon Odontop. 2013 June;16:1-7. 15. Shaikh AJ, Alvi AR. Comparison of cephalometric norms of esthetically pleasing
faces. J Coll Physicians Surg Pak. 2009 Dec;19(12):754-8.
REFERENCES
16. Sukhia H, Sukhia RH. Lower facial height treatment changes in bi-maxillary protrusion orthodontic cases. Pak Oral Dent J. 2013 Apr;33(1):65-70.
17. Bahrou S, Hassan AA, Khalil F. Facial proportions in diferent mandibular rotations in Class I individuals. Int Arab J Dent. 2014;5(1):9-18.
18. Asad S, Naeem S. Correlation between various vertical dysplasia assessment parameters. Pak Oral Dent J. 2009 Dec;1(2):28-33.
19. Rizwan M, Mascarenhas R, Hussain A. Reliability of the existing vertical dysplasia indicators in assessing a deinitive growth pattern. Rev Latinoam Ortodon Odontop. 2011 Dec;16:1-5.
20. Tweed CH. The Frankfort-mandibular plane angle in orthodontic diagnosis, classiication, treatment planning, and prognosis. Am J Orthod Oral Surg. 1946 Apr;32:175-230.
21. Viera AJ, Garrett JM. Understanding interobserver agreement: the kappa statistic. Fam Med. 2005 May;37(5):360-3.
22. Ricketts RM. Cephalometric analysis and synthesis. Angle Orthod. 1961 July;31(3):141-56.
23. Kusnoto B, Kaur P, Salem A, Zhang Z, Galang-Boquiren MT, Viana G, et al. Implementation of ultra-low-dose CBCT for routine 2D orthodontic diagnostic radiographs: Cephalometric landmark identiication and image quality assessment. Semin Orthod. 2015;21(4):233-47.
24. Park JH, Tai K, Owtad P. 3-Dimensional cone-beam computed tomography superimposition: a review. Semin Orthod. 2015 Dec;21(4):263-73.
25. Huerta JVR, Sosa JGO, Ledesma AF. Comparative study between cone-beam and digital lateral head ilm cephalometric measurements. Rev Mex Ortodon. 2015 Apr-Jun;3(2):84-7.
26. Navarro RL, Oltramari-Navarro PV, Fernandes TM, Oliveira GF, Conti AC, Almeida MR, et al. Comparison of manual, digital and lateral CBCT cephalometric analyses. J Appl Oral Sci. 2013 Mar-Apr;21(2):167-76. 27. Cassetta M, Altieri F, Di Giorgio R, Silvestri A. Two-dimensional and