Rev Saúde Pública 2004;38(3) www.fsp.usp.br/rsp
Psycometrics properties of subjetive indicator
in children
Christiane Alves Ferreira, Carlos Alfredo Loureiro and Vânia Eloísa Araújo
Centro de Pós-Graduação São Leopoldo Mandic. Campinas, SP, Brasil
Correspondence to:
Christiane Alves Ferreira
Rua Vitório Magnavaca, 263 Apto 303 Bl 2, Buritis
30455-730 Belo Horizonte, MG, Brasil E-mail: [email protected]
Received on 9/1/2003. Reviewed on 30/9/2003. Approved on 4/9/2003.
Keywords
Oral health. Health conditions. Dental health surveys. DMF index. Students. Psychometrics.
Abstract
Objective
To evaluate the psychometric properties of the Oral Heath Impact Profile (OHIP-14) to measure oral health in children.
Methods
The OHIP-14 questionnaire was applied to 312 schoolchildren aged 12 years residing in Sabará, Brazil, in 2001. OHIP-14’s reliability was evaluated using Cronbach’s alpha and correlation intraclass coefficient. For examining content validity, Pearson’s correlation and logistic regression analysis were applied. For construct validity, Student’s t-test and Tukey-Kramer test were used.
Results
Tooth loss among the subjects was low in this study (between 85% and 100%). Caries prevalence was very low and not detectable in 59.0% of the sample. The logistic regression model showed high predictive values for reporting treatment need and intermediate values for dental caries perception. The comparison between different OHIP average scores, according to the DMF-S index’s three categories of decayed, missing, filled surfaces, indicated significant difference only for the categories social disability and deficit.
Conclusions
The study results indicated that the adolescents did not report high prevalence of oral conditions. The OHIP was associated with perceived treatment need, reporting of dental caries and increased DMF-S index. These results suggest that the OHIP has good psychometric properties when applied to children and could be a promising instrument for screening priority care groups.
INTRODUCTION
Indicators associating oral conditions to individu-als’ quality of life have been developed because of the need of understanding subjectively perceived health conditions as well as determining the impact of health conditions on quality of life.6,19 The concept of
per-ceived health need has arisen from the health promo-tion movement started in 1974, when the nopromo-tion of health was dissociated from absence of disease. Health and disease have been then considered two distinct
multidimensional entities and thus not measurable in a linear unidimensional scale. Health has been defined as a quality of life component.10
Rev Saúde Pública 2004;38(3) www.fsp.usp.br/rsp Propriedades psicométricas do OHIP-14
Ferreira CA et al
children to be interviewed and the confidential report of findings. The utilization of the present study data has been previously authorized by the municipality’s Dentistry Division and consisted of reports of oral car-ies examinations as well as questionnaires on perceived need (OHIP-14) applied to 312 public school boys and girls aged 12 years old from seven different areas. Other OHIP studies found variation coefficients (δ/µ) rang-ing between 0.63 and 2.46 for dentate people and be-tween 1.00 and 3.46 for edentulous people. In order to detect a 15% difference in mean scores for a category with a variation coefficient of 1.0, it was estimated that 251 people would be necessary for a type I error equal to 0.05 and a type II error equal to 0.20.
A simplified OHIP-14 questionnaire comprising 14 items was used as a measurement instrument. OHIP reliability was assessed using Cronbach’s alpha coef-ficient and intraclass correlation coefcoef-ficient (ICC). The ICC was used as an estimate of the total variabil-ity given by the sum of the natural variabilvariabil-ity and the measurement error variability.
Content validity was evaluated through two glo-bal scores: perception of treatment need and percep-tion of dental caries. The correlapercep-tion of OHIP with the global scores was assessed through Pearson’s linear correlation. Univariate logistic regression analysis was applied to determine the association between the global scores, considered independent variables, and OHIP components.
To evaluate the construct’s validity the sample was grouped according to the three categories of the DMF-S index (measuring the sum of decayed, missing, and filled surfaces): 0 to 5, 6 to 10, and above 10. DMF-S 0 to 5 was set as reference for allowing the comparing of the two other categories. A mean OHIP-14 was ob-tained for each one of the three groups. Means were then compared using Student’s t-test for non-paired samples. Non-paired Student’s t-test was applied to test the null hypothesis that OHIP means of the stud-ied groups were equal.2,3 The Tukey-Kramer test was
also used for different size groups for allowing multi-ple comparisons (simultaneous inferences), particu-larly for all comparisons among DMF-S groups.
To assess item redundancy for each OHIP compo-nent a Kendall’s non-parametric ordinal correlation analysis was carried out.
RESU LTS
The study sample consisted mostly of females (160;
*Technical report presented to the State Health Department of Sabará. Data to be published. information adds up to conventional indicators of
oral epidemiology of clinical diseases providing thus a profile of “disease impact” on people and the effec-tiveness of health services in reducing these impacts. Originally, the OHIP comprises seven components and 49 items arranged in a questionnaire format and a 5-choice Lickert-like scale ranging from never to often is used in the answers. Data consolidation can be performed using a discrete scale or by scoring each scale interval from 0 to 4.18
Traditionally, perceived need indicators have been designed for adults and elderly. Still, Broder et al4
(2000) have conducted a study among urban teenag-ers of New Jteenag-ersey, US, aged 12 to 14 years, comparing an objective indicator, DMF-T index (index compris-ing the sum of decayed, missed and filled teeth) and two subjective indicators (RAND-36-Item Health sur-vey which measures general health similarly to the OHIP and comprises eight health concepts – physi-cal health problems, role limitations caused by emo-tional or mental problems, energy/fatigue, emoemo-tional well-being, social functioning, pain, and general health perceptions – and the OHIP-49). The authors noted that subjective indicators, OHIP in particular, could be a valuable sensitive screening instrument for identifying those people in a community under high impact of oral health conditions.
The OHIP has been designed in English for a par-ticular cultural background. Hence, for adapting the indicator into Portuguese and the Brazilian cultural background, Almeida et al1 (2001) carried out a
two-step cross-cultural translation. In the first two-step, the semantic validation of the cross-culturally translated instrument was carried out piloting it among users of the Brazilian Unified Health System’s (SUS) health clinics from different age groups. In the second step, the instrument’s psychometric properties were tested in samples of adult and elder populations.
Since OHIP semantic and psychometric validation had been carried out only in adult and elder popula-tions and had not been before assessed in children and adolescents, this study aimed at evaluating OHIP psychometric properties in young people.
M ETH O D S
Secondary data from an epidemiological survey con-ducted by the Sabará’s Health Department in 2001*
!
Rev Saúde Pública 2004;38(3) www.fsp.usp.br/rsp
Propriedades psicométricas do OHIP-14 Ferreira CA et al
51.3%). When evaluated for a global subjective score, most (171; 55.5%) reported they needed oral treat-ment. Regarding their perception of dental caries, when asked, “do you think you have any cavities?”, almost half were positive (124; 46.1%). This outcome had a high concordance with the occurrence of den-tal caries measured by both the DMF-S (45.2%) and DMF-T (41.01%) indexes.
Table 1 show the reliability assessment for OHIP’s seven components.
The results of Cronbach’s alpha coefficient were considered low ranging from 0.55 to 0.26. For all com-ponents together, a significant value of 0.8575 was found. Overall, ICC was similar to Cronbach’s alpha.
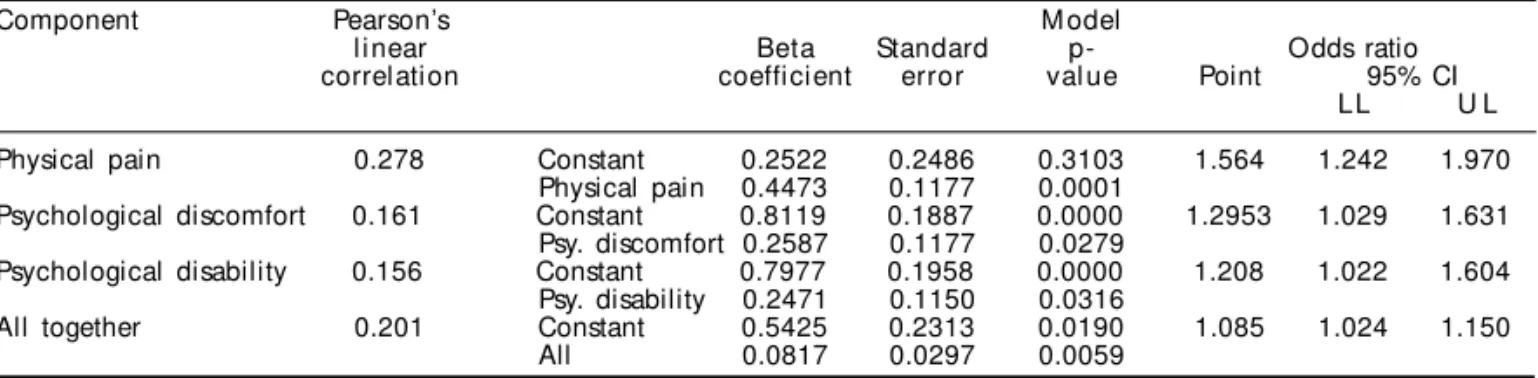
Table 2 shows Pearson’s correlation and regression analysis of three significant OHIP components and all components together.
The Pearson’s test between OHIP components and reported perception of oral treatment revealed a posi-tive though weak correction, ranging between 0.156 and 0.278. The difference between mean scores of each OHIP subscale, divided into those subjects re-porting they needed treatment and those rere-porting did not need treatment, was significant only for the
components pain, psychological discomfort, and psy-chological disability. The odds ratio ranged between 1.208 and 1.564, i.e., subjects who reported pain in the OHIP were about 1.5 times more likely to report treatment need when compared to subjects who did not report pain in the OHIP.
Data relating to each component were disposed into 2x2 tables where the lines show the two classifications of predictive variables, perception of treatment need and perception of having cavities and OHIP compo-nents. As the classifications were independent, odds ratio was calculated using the following equation:
OR = (a*d) / (b*c)
Odds ratio yielded point and interval values in-dicating the likelihood of a group of experiencing impacts when compared to other group (percep-tion of treatment need and percep(percep-tion of having dental caries).
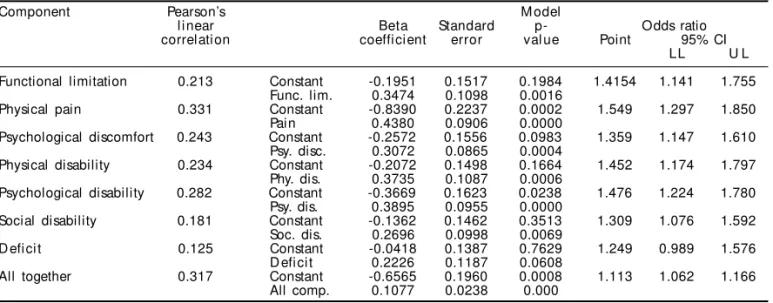
Table 3 shows the correlation and univariate regres-sion analysis between each of the seven OHIP compo-nents and all of them together and reporting dental caries. The Pearson’s linear correlation linear between OHIP components and the reported perception of den-tal caries showed a positive though weak correlation.
Table 1 - Internal consistency of the Oral Health Impact Profile (OHIP) seven components in a sample of 312 children and
adolescents, Sabará, Brazil, 2001.
Internal consistency – mixed effect model
Component Cronbach’s alpha Simple intra** correlation
Value 95% CI Value 95% CI
Functional limitation 0.2688 (0.0666; 0.4272) 0.1553 (0.0345; 0.2716) Physical pain 0.3914 (0.2253; 0.5219) 0.2433 (0.1270; 0.3531) Psychological discomfort 0.4657 (0.3186; 0.5810) 0.3035 (0.1895; 0.4095) Physical disability 0.5302 (0.4017; 0.6311) 0.3607 (0.2513; 0.4610) Psychological disability 0.4823 (0.3410; 0.5933) 0.3178 (0.2056; 0.4218) Social disability 0.5548 (0.4333; 0.6503) 0.3839 (0.2766; 0.4818) D efi ci t 0.5355 (0.4079; 0.6356) 0.3657 (0.2562; 0.4659)
All together 0.8575 (0.8295; 0.8826) 0.3006 (0.2580; 0.3494)
*Cronbach’s alpha: average measure of intraclass correlation **Simple measure of intraclass correlation
CI = Confidence interval
Table 2 - Pearson’s correlation and univariate logistic regression analysis of the association between OHIP components and
perception of treatment need.
Component Pearson’s M odel
l i near Beta Standard p- Odds ratio
correlation coefficient error val ue Point 95% CI LL U L
Physical pain 0.278 Constant 0.2522 0.2486 0.3103 1.564 1.242 1.970 Physical pain 0.4473 0.1177 0.0001
Psychological discomfort 0.161 Constant 0.8119 0.1887 0.0000 1.2953 1.029 1.631 Psy. discomfort 0.2587 0.1177 0.0279
Psychological disability 0.156 Constant 0.7977 0.1958 0.0000 1.208 1.022 1.604 Psy. disability 0.2471 0.1150 0.0316
All together 0.201 Constant 0.5425 0.2313 0.0190 1.085 1.024 1.150 All 0.0817 0.0297 0.0059
" Rev Saúde Pública 2004;38(3) www.fsp.usp.br/rsp Propriedades psicométricas do OHIP-14
Ferreira CA et al
The difference between mean scores for each OHIP subscale, divided into those subjects reporting hav-ing dental caries and those reporthav-ing not havhav-ing car-ies was significant for all components, except for deficit (p<0.06). The odds ratio ranged between 1.113 and 1.549. There were recorded two global percep-tions regarding the subjects’ oral health: need of oral treatment and perception of dental caries.
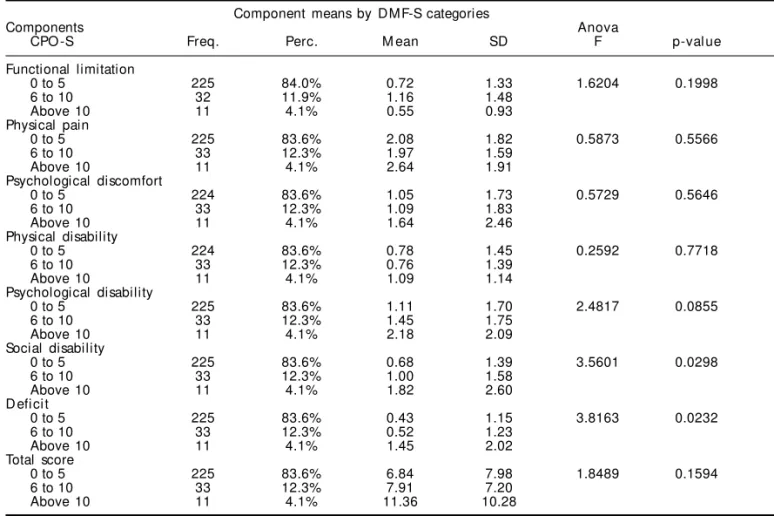
Table 4 exhibits the results of OHIP components according to the three DMF-S cut-off values: 0 to 5; 6 to 10, and above 10.
The comparison table among different mean OHIP scores according to DMF-S categories using ANOVA showed a significant difference for the components social disability and deficit.
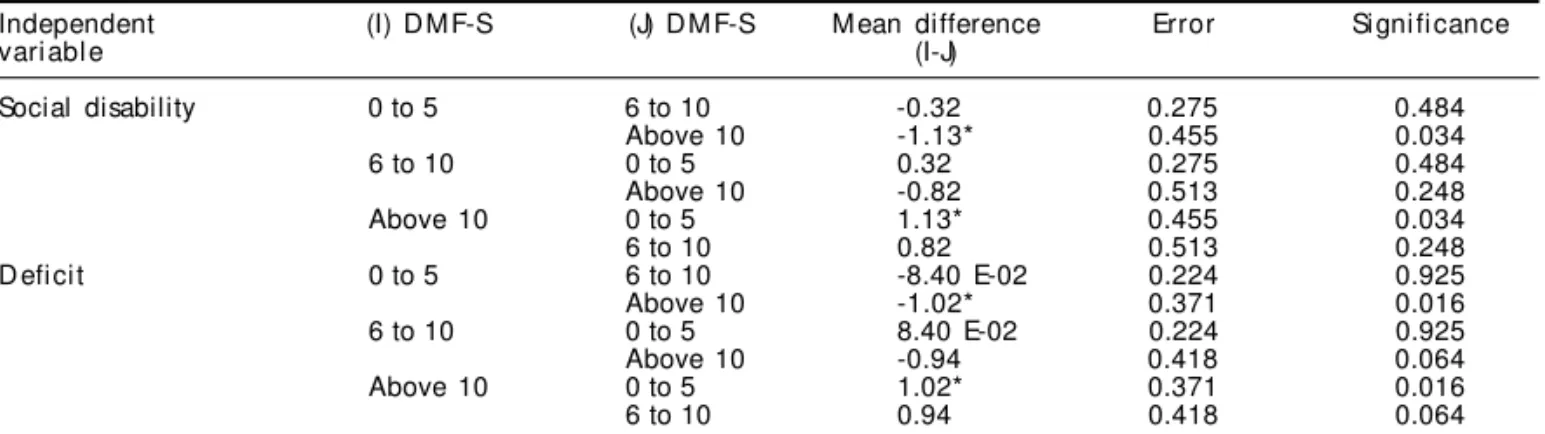
Table 5 shows the results of the multiple comparisons.
The contrasts among DMF-S categories, arranged as dummy variables, indicated that, for the compo-nent social disability, the variable DMF-S 0 to 5 showed to be significantly different when compared to variable DMF-S above 10. For the component defi-cit, the variable DMF-S 0 to 5 had a significant dif-ference when compared to the variable DMF-S above 10. All other comparisons were not significant.
D ISCU SSIO N
The study sample consisted of 312 children aged 12 years from public schools in the municipality of Sabará, Brazil. The original study* with an active search had a high global response rate that varied per item studied. Regarding length of residency,
missed answers were only 4.0% while for percep-tion of treatment need 26.0% were either “do not know” or not answered. There was a higher response compared to 75% response rate reported for a ques-tionnaire sent by mail by Slade et al13 (1995), 57.6%
by Hunt et al7 (1995), and 74.4% by Slade et al15
(1996). These authors also noted that after review-ing several studies they found a response rate be-tween 71% and 86% for the OHIP sent by mail. The average response rate was better than 86.8% reported by Miotto & Barcellos11 (2001), and similar to
94.92% by Silva12 (2001), both adopting the same
search strategy as the present study.
OHIP-14 reliability was assessed through the inter-nal consistency method of coefficient correlation using Cronbach’s alpha coefficient. The measured reliability was low to moderate. Similar intraclass correlation coefficients (ICC) were obtained though they were systematically lower when compared to Cronbach’s alpha coefficients. These results were lower to those previously reported by Slade & Spen-cer16 (1994) who obtained Cronbach’s alpha
coeffi-cients ranging between 0.70 and 0.83 for six subscales and similar to 0.37 obtained in the deficit subscale. The present study showed lower results than those previously reported by Slade & Spencer17 (1994) that
were between 0.42 and 0.77 for six subscales, and higher than 0.08 for social disability. These findings are lower than those reported by Locker & Slade9
(1993) who found values ranging between 0.80 and 0.90 for all components. They are also lower than 0.96 Cronbach’s alpha coefficient obtained by Slade et al15 (1996) and 0.88 obtained by Slade19 (1997).
Silva12 (2001) described an internal consistency
meas-ured using Cronbach’s alpha coefficient ranging
be-*Data not yet published.
Table 3 - Logistic regression of OHIP components on the perception of having dental caries in a sample of 312 children and
adolescents in Sabará, Brazil, 2001.
Component Pearson’s M odel
l i near Beta Standard p- Odds ratio
correlation coefficient error val ue Point 95% CI LL U L
Functional limitation 0.213 Constant -0.1951 0.1517 0.1984 1.4154 1.141 1.755 Func. lim. 0.3474 0.1098 0.0016
Physical pain 0.331 Constant -0.8390 0.2237 0.0002 1.549 1.297 1.850 Pain 0.4380 0.0906 0.0000
Psychological discomfort 0.243 Constant -0.2572 0.1556 0.0983 1.359 1.147 1.610 Psy. disc. 0.3072 0.0865 0.0004
Physical disability 0.234 Constant -0.2072 0.1498 0.1664 1.452 1.174 1.797 Phy. dis. 0.3735 0.1087 0.0006
Psychological disability 0.282 Constant -0.3669 0.1623 0.0238 1.476 1.224 1.780 Psy. dis. 0.3895 0.0955 0.0000
Social disability 0.181 Constant -0.1362 0.1462 0.3513 1.309 1.076 1.592 Soc. dis. 0.2696 0.0998 0.0069
D efi ci t 0.125 Constant -0.0418 0.1387 0.7629 1.249 0.989 1.576 D efi ci t 0.2226 0.1187 0.0608
#
Rev Saúde Pública 2004;38(3) www.fsp.usp.br/rsp
Propriedades psicométricas do OHIP-14 Ferreira CA et al
tween 0.6138 for psychological disability and 0.7720 for psychological discomfort assessed using the sim-ple intraclass correlation coefficient. The obtained values ranged from 0.4427 for psychological disabil-ity to 0.6292 for psychological discomfort.
Some of the following factors could have contrib-uted to the study results: method used, cross-cultural translation, fewer items in the questionnaire, and re-spondents’ various schooling. Slade et al13 (1995)
reported that when a standard interview was applied instead of a questionnaire sent by mail, OHIP-49 showed a lower internal consistency. Slade19 (1997)
noted that in studies where the OHIP had been trans-lated into other languages such as French and Span-ish, some questions and categories could not be prop-erly translated and thus affecting the instrument’s re-liability. In the OHIP-14’s cross-cultural translation process, difficulties were reported concerning the translation of some terms into Portuguese.1
Shorten-ing the number of OHIP-49 items which gave rise to the OHIP-14 could have contributed to the instru-ment’s lower reliability. In the OHIP-14 study, most result comparisons were carried out using the com-plete instrument. A general psychometry principle states that “the lower the number of items the lower the scale consistency”. The OHIP-14 has a third less items than the original instrument, which could ex-plain the low reliability seen in the present study.
Aiming at assessing whether there were potential redundancies in the questionnaire, internal correlations of OHIP items for each component were conducted. The Kendall’s correlation showed concordance among the items, i.e., the OHIP-14 items captured different aspects including the contents of each component.
The Pearson’s test between OHIP components and reported perception of oral treatment yielded a posi-tive though very weak correlation. However, the dif-ference between mean scores of each OHIP subscale, divided into subjects who reported treatment need and those reporting dental caries, was statistically significant for pain, psychological discomfort, and psychological disability. The odds ratio showed that subjects who reported pain in the OHIP were about 1.5 times more likely to report treatment need when compared to those who did not report pain. This find-ing suggests the good validity of OHIP’s contents concerning the global indicator of reported percep-tion of oral treatment need.
In the analysis of predictability using a logistic model, the likelihood of a subject to report pain as well as oral treatment need was high, suggesting a good validity of OHIP’s content to predict the need for oral treatment. This finding shows that the OHIP has a good predictive value for reporting oral treatment need and the component pain had the highest predictive value.
Table 4 - Component means by DMF-S categories in a sample of 312 children and adolescents in Sabará, Brazil, 2001.
Component means by DMF-S categories
Components Anova
CPO -S Freq. Perc. M ean SD F p-val ue
Functional limitation
0 to 5 225 84.0% 0.72 1.33 1.6204 0.1998
6 to 10 32 11.9% 1.16 1.48
Above 10 11 4.1% 0.55 0.93
Physical pain
0 to 5 225 83.6% 2.08 1.82 0.5873 0.5566
6 to 10 33 12.3% 1.97 1.59
Above 10 11 4.1% 2.64 1.91
Psychological discomfort
0 to 5 224 83.6% 1.05 1.73 0.5729 0.5646
6 to 10 33 12.3% 1.09 1.83
Above 10 11 4.1% 1.64 2.46
Physical disability
0 to 5 224 83.6% 0.78 1.45 0.2592 0.7718
6 to 10 33 12.3% 0.76 1.39
Above 10 11 4.1% 1.09 1.14
Psychological disability
0 to 5 225 83.6% 1.11 1.70 2.4817 0.0855
6 to 10 33 12.3% 1.45 1.75
Above 10 11 4.1% 2.18 2.09
Social disability
0 to 5 225 83.6% 0.68 1.39 3.5601 0.0298
6 to 10 33 12.3% 1.00 1.58
Above 10 11 4.1% 1.82 2.60
D efi ci t
0 to 5 225 83.6% 0.43 1.15 3.8163 0.0232
6 to 10 33 12.3% 0.52 1.23
Above 10 11 4.1% 1.45 2.02
Total score
0 to 5 225 83.6% 6.84 7.98 1.8489 0.1594
6 to 10 33 12.3% 7.91 7.20
$ Rev Saúde Pública 2004;38(3) www.fsp.usp.br/rsp Propriedades psicométricas do OHIP-14
Ferreira CA et al
The correlation analysis between OHIP components and the reported perception of dental caries also showed a positive though weak correlation. Despite that, the difference between mean scores and odds ratios of each OHIP subscale, divided into subjects who reported having dental caries and those who reported not hav-ing caries, was significant for all components.
The predictive logistic model applied to determine the effect of reporting in an OHIP component as well as reporting dental caries was moderate to low, indi-cating a moderate content validity of OHIP to predict the reported dental caries. These results indicate that, as expected for this age group, while reported pain had the highest predictive value of perception of den-tal caries, the predictive value of a positive reporting in the OHIP was only moderate for perceived caries.
To assess validity properties of the OHIP’s construct the DMF-S index was divided into three categories: 0 to 5; 6 to 10; above 10. The comparison between different mean OHIP scores, according to the DMF-S categories and using ANOVA, showed a significant difference concerning social disability and deficit. In order to determine the categories in which differ-ences were seen, the Tukey’s test was used and a sig-nificant difference was found only in the ends of DMF-S for social disability and deficit. These results are similar to those reported by Slade & Spencer17
(1994), who found high impact in patients showing high values in objective indicators. They also cor-roborate what found Coates et al5 (1996) that
HIV-positive patients who had many oral conditions re-ported a significant high impact. Moreover, they con-firm the findings of Slade et al14 (1997) that oral
con-ditions such as missing teeth, retained root fragments, and periodontal pockets among others were associ-ated with high impact. It also partially corroborates Locker & Jokovic8 (1996) study when no significant
association between subjective and objective indi-cators was found. Also, it agrees with Slade’s19 (1997)
research showing that higher OHIP scores were seen in individuals with less favorable oral-medical con-ditions (more missing teeth, more root fragments, more untreated caries, deeper periodontal pockets, and more periodontal recesses).
The statistical significance verified only in three components contrasts with the results reported by Broder et al4 (2000), who found a significant
differ-ence for all OHIP components while evaluating ado-lescents. Most probably this difference could be due the different epidemiological profile of the studied groups in Sabará and New Jersey. While in Sabará the mean DMF-S was 2.24 and 54.8% of the sample had DMF-S zero, in New Jersey the mean DMF-S was 8.8 and only 5% of the sample was DMF-S zero. As the frequency of individuals with DMF-S above 10 was very low in the present study, the statistical power of the sample was affected for rejecting the null hypoth-esis in some components. Overall, the frequencies found in the OHIP were much lower than those re-ported in other studies, including among adolescents.
The study results indicate that the prevalence of perceived dysfunction, discomfort and disability as an impact resulting of oral health conditions in chil-dren aged 12 years in Sabará, measured using the OHIP-14 instrument, was very low. The study results allow for reaching the conclusion that the OHIP in-strument has good content validity for selecting groups of patients who perceive treatment need and only moderate validity for identifying patients re-porting dental caries. The OHIP-14 has good crite-ria validity for the components social disability, deficit, and psychological disability when compar-ing the association of the instrument’s scores with DMF-S index.
*The mean difference is statistically significant at p=0.05
Table 5 - Multiple comparisons for three levels of DMF-S using Tukey’s test in a sample of 312 children and adolescents in
Sabará, Brazil, 2001.
Independent (I) D M F-S (J) D M F-S M ean difference Error Si gni fi cance
vari abl e (I-J)
Social disability 0 to 5 6 to 10 -0.32 0.275 0.484
Above 10 -1.13* 0.455 0.034
6 to 10 0 to 5 0.32 0.275 0.484
Above 10 -0.82 0.513 0.248
Above 10 0 to 5 1.13* 0.455 0.034
6 to 10 0.82 0.513 0.248
D efi ci t 0 to 5 6 to 10 -8.40 E-02 0.224 0.925
Above 10 -1.02* 0.371 0.016
6 to 10 0 to 5 8.40 E-02 0.224 0.925
Above 10 -0.94 0.418 0.064
Above 10 0 to 5 1.02* 0.371 0.016
%
Rev Saúde Pública 2004;38(3) www.fsp.usp.br/rsp
Propriedades psicométricas do OHIP-14 Ferreira CA et al
REFEREN CES
1. Almeida A, Loureiro CA, Araújo VE. Tradução transcultural do indicador de necessidade percebida perfil do impacto de saúde bucal (OHIP). Rev CROMG 2001 [no prelo].
2. Altman DG. Practical statistics for medical research. London: Chapman and Hall; 1991.
3. Armitage P, Berry G. Statistical methods in medical research. 2nd ed. London: Blackwell; 1994.
4. Broder HL, Slade G, Caine R, Reisine S. Perceived impact of oral heath conditions among minority adolescents. J Public Health Dent 2000;3:189-92.
5. Coates E, Slade GD, Goss AN, Gorkic E. Oral conditions and their social impact among HIV. Aust Dent Serv 1996;41:33-6.
6. Cohen LK, Jago JD. Toward the formulation of sociodental indicators Int J Health Serv 1976;6:681-98.
7. Hunt RJ, Slade GD, Strauss RP. Differences between racial groups in the impact of oral disorders among older adults in North Carolina. J Public Health Dent 1995;55:205-9.
8. Locker D, Jokovic A. Using subjective oral health status indicators to screen for dental care needs in older adults. Commun Dent Oral Epidemiol 1996;24:398-402.
9. Locker D, Slade GD. Oral health and the quality of life among older adults: the oral health impact profile. J Can Dent Assoc 1993;59:830-8.
10. Locker D. Subjective indicators of oral health status. In: Slade GD, editor. Measuring oral health and quality of life. Chapel Hill: University of North Carolina. Dental Ecology 1997;15:3-7.
11. Miotto MHMB, Barcellos LA. Uma revisão sobre o indicador subjetivo de saúde bucal “ Oral Health Impact Profile” OHIP. UFES Rev Odontol 2001;3:32-8.
12. Silva NS. Avaliação do efeito das condições sociode-mográficas e utilização de serviços odontológicos sobre o perfil do impacto da saúde bucal sobre a qualidade de vida na população adulta idosa de Cuiabá-MT [dissertação de mestrado]. Campinas: Universidade Camilo Castelo Branco; 2001.
13. Slade GD, Brennan D, Spencer AJ. Methodological aspects of a computer-assisted telephone interview survey of oral health. Aust Dent J 1995;40:306-10.
14. Slade GD, Gansky SA, Spencer AJ. Two-year incidence of tooth loss among South Australians aged 60+ years. Commun Dent Oral Epidemiol
1997;25:429-37.
15. Slade GD, Hoskin GW, Spencer AJ. Trends and flutuations in the impact of oral conditions among older adults during a one year period. Commun Dent Oral Epidemiol 1996;24:317-21.
16. Slade GD, Spencer AJ. Development and evaluation of the oral health impact profile. Commun Dent Health 1994;11:3-11.
17. Slade GD, Spencer AJ. Social impact of oral conditions among older adults. Aust Dent J 1994;39:358-64.
18. Slade GD, Strauss RP, Atchinson KA, Kressin NR, Locker D, Reisine ST. Conference summary: assessing oral health outcomes-measuring health status and quality of life. Commun Dent Health 1998;15:3-7.