Resumo
Objetivo: o padrão espacial de distribuição de renda do município de São Paulo, frequentemente generalizado como sendo “radial”, tem sido muito questionado pela literatura recente. São Paulo tem uma complexa distribuição de características sociais e demográficas entre seus distritos, o que dificulta a análise por meio de modelos estatísti-cos que permitam a inclusão somente de algumas variáveis de cada vez, como as regressões lineares. O presente estudo objetiva identificar os distritos do município que possam ser considerados como “comparáveis” pelo uso da metodologia estatística conhecida como propensity score matching. Meto-dologia: os 96 distritos do município de São Paulo foram analisados separadamente; foram incluídas 16 variáveis no modelo, sendo o índice de Gini a variável que permitiu a separação de distritos en-tre expostos (alta desigualdade) ou não expostos (baixa desigualdade). Do total de distritos, 27 foram considerados comparáveis com algum outro, isto é, possuíram valores de propensity score com uma dis-tância menor de 0,1 de outro com tipo de exposição diferente. Resultados: das 16 variáveis incluídas, 9 apresentaram diferenças estatisticamente significa-tivas entre os distritos incluídos e excluídos, o que é esperado pela metodologia. Dos 17 pares de distritos formados, apenas 3 foram compostos por distritos de uma mesma região administrativa e apenas 1 por
Alexandre Dias Porto Chiavegatto Filho
PhD in Public Health. Assistant Professor, Faculty of Public Health, Universidade de São Paulo.
Address: Av. Dr. Arnaldo, 715, CEP 01246-904, São Paulo, SP, Brasil. E-mail: [email protected]
Sabina Léa Davidson Gotlieb
PhD in Public Health. Retired Professor, Faculty of Public HealthU-niversidade de São Paulo.
Address: Av. Dr. Arnaldo, 715, CEP 01246-904, São Paulo, SP, Brasil. E-mail: [email protected]
Samuel Luna de Almeida
Master’s in Public Health. Researcher in the Faculty of Public Health Environmental Health Department , Universidade de São Paulo. Address: Av. Dr. Arnaldo, 715, CEP 01246-904, São Paulo, SP, Brasil. E-mail: [email protected]
Ichiro Kawachi
PhD in Public Health. Professor, Harvard School of Public Health, Harvard University.
Address: Huntington Avenue, 677, 02115, Boston, MA, Estados Unidos.
E-mail: [email protected]
1 Financial support: CAPES (processo 1276-09-3)
How to include the characteristics of the
distritos
of the Municipality of São Paulo in
epidemiologic studies? An income inequality
analysis using the propensity score matching
approach
1
distritos que faziam fronteira entre si. Conclusão: a análise da diferença no padrão de distribuição das variáveis, permitida pelo uso do propensity score matching, indica a dificuldade de dividir a cidade segundo regiões. Para entender São Paulo é preciso considerar suas particularidades e suas complexas distribuições espaciais.
Palavras-chave: Saúde urbana; Epidemiologia; Bioestatística; Medicina social; Fatores socioeco-nômicos; Ambiente social.
Abstract
Objectives. The spatial pattern of income distribu-tion in the Municipality of São Paulo, considered to be of a “radial” type, has been challenged by recent studies due to the complex distribution of social and
demographic characteristics between its distritos.
This demands an in-depth analysis that takes into consideration a multitude of variables in order to control for local heterogeneity. This study aims
to identify the distritos of São Paulo that can be
defined as “comparable” to another one, by using a statistical methodology known as propensity score
matching. Methodology. The 96 distritos of the
Mu-nicipality of São Paulo were analyzed separately. 16 variables were included in the model, and the Gini coefficient was used to define “exposure” (high ine-quality) and “non-exposure” (low ineine-quality). Of the
distritos, 27 were considered “comparable”. Results.
Of the 16 variables inserted in the model, nine pre-sented a statistically significant difference between
included and excluded distritos, which is expected
by this methodology. Of the 17 pairs of distritos
con-sidered to be comparable, only three were composed of distritos situated in the same administrative
region, and only one was composed of bordering
dis-tritos. Conclusion. The complex spatial distribution of the propensity score in the Municipality of São Paulo indicates that it is very difficult to divide the city according to its geographical regions. In order
to understand how the distritos of São Paulo affect
the health of its residents, it is important to take into consideration its many particularities and how they are spatially distributed.
Introduction
The Metropolitan Region of São Paulo has a higher number of households living on less than a quarter of a minimum wage per capita than the total popula-tion of de Porto Alegre (Marques and Torres, 2004). Although it contains 47% of the population of the state of São Paulo, it contains 55% of the state’s poor, in contrast to the national trend for higher concentrations of poverty in rural regions (Marques and Torres, 2004).
One of São Paulo’s most established characteris-tics is its high level of segregation, even compared with other Brazilian cities, such as Rio de Janeiro (Scalon and Oliveira, 2007). Although the popula-tion on a low income has decreased proporpopula-tionally since the 1990s, their concentration has increased in the poorer areas of the study, which explains the growing segregation (Torres, 2004). For Caldeira (2000), São Paulo is the city which best represents modern Brazil with all its paradoxes: industry, favelas, sophisticated metros, high rates of infant mortality and skyscrapers.
In the city of São Paulo, the historical pattern of distribution of income is radial, with the rich occupying the central regions and increases in po-verty as one travels towards the periphery (Singer, 1977). But recent studies have indicated that strong heterogeneity exists, even within the different income bands (Marques and Torres, 2004; Torres et al., 2003). Marques and Torres (2004) divided the richest areas into three types, the middle class areas into four and the poor areas into three, noting “the existence of fairly complex peripheral spaces, leading us to highlight the existence of peripheries rather than a periphery” (p. 7).
In contrast to the periphery, the central region of São Paulo contains small favelas, located on the edges of streams and in small areas of remnants of public works (Saraiva and Marques, 2004). Even so, living near to the center means being closer to the job market and having greater access to information about jobs and courses (Gomes and Amitrano, 2004). The upper middle class region of Morumbi is where the Paraisópolis favela can be found, with more than 80,000 inhabitants, whose physical proximity to rich surroundings means more non-governmental
organizations and greater presence of the job ma-rket (Almeida and D’Andrea, 2004). The stigma of the presence of a favela is significant for health, not only concerning the sensation of inferiority its inhabitants may feel, but also for the adverse effects (possibly stressors) in the rich surrounding area. In qualitative research by Caldeira (2000), it was verified that many middle class Paulistanos – inhabitants of the city of São Paulo - considered favelas to be synonymous with criminality and lack of character, especially when situated close to a rich region.
The variables which define social exclusion in the districts of the municipality of São Paulo vary according to length of occupation, presence of the authorities and characteristics of the physical sur-roundings. The most commonly used methodology in the area of public health is multivariate regres-sion, which runs the risk of not detecting evidence of statistical significance due to the large number of variables which need to be entered into the model. One suggestion, which is being increasingly used in the area of social epidemiology, is propensity score matching, a statistical analysis initially used in cardiology studies, and which has recently began to be used by the whole epidemiology area (Oakes and Johnson, 2006).
Methodology
Propensity ScoreThe concept of the propensity score (PS) was first presented in the literature by Rosenbaum and Rubin (1983), who defined it as the conditional probability of exposure taking into account a set of variables.
PS aims to identify the regions which are most similar to each other, taking into account a set of variables and an exposition factor (Austin, 2008a). It is calculated using logistic regression, the values of which vary between 0 and 1. Thus, the final result is the probability of exposure and not obtaining statistical significance due to an excess of variables is not a problem when using this model.
summarizes a set of variables into a scalar function, the model enables it to be identified whether the two groups (exposed and non-exposed,) are intercalated enough to allow a comparison with lower variability between them. The same PS value signifies equal possibility of exposure, according to the variables selected. Between individuals or locations with si-milar PS, some will be exposed and some will be non--exposed, which enables a comparison to be made. This analysis can be defined as a randomization after exposure (Yue, 2007). A technique which is frequently used to test if the propensity scores found in the model have high predictive power is the ROC (Receiver Operating Characteristic) curve, which represents the probability of the regions having a propensity score consistent with their exposure (in this case, exposed regions having higher propensity scores and vice-versa)(Hanley and McNeil, 1982).
After calculating the PS, the most common sequence is matching, in which each location or individual is paired with another with the same PS value but with different exposition(Austin, 2010). The matching process begins by identifying the exposure with the lowest PS value, which will be paired with a non-exposed, if they are located within a maximum difference in value (caliper width). The caliper width most commonly used in the literature is 0.01 (Austin, 2008b). So, for example, an exposed location or individual who has a PS of 0.670 can be grouped with non-exposed ones who have a PS value between 0.660 and 0.680. In this analysis, propensi-ty score matching with replacement was used, which means that each exposed individual or location can be paired with more than one non-exposed, if they are within the caliper width. Individuals or loca-tions which are not grouped are excluded from the subsequent analyses.
São Paulo
Currently, the municipality of São Paulo is compo-sed of 96 administrative districts, grouped into 31 boroughs. These districts are the smallest areas for which health care data are available through the TabNET System, of the Program for Improving Mor-tality Information - Programa de Aprimoramento das Informações de Mortalidade (PRO-AIM).
For this analysis, the local relative inequality of income was used as an exposure factor. In other
words, we aimed to identify administrative districts with similar characteristics, but with different inco-me distributions. The sainco-me analysis can be carried out for other exposure factors, such as absolute income, smoking, vaccination and medicine use, among others (Shah et al., 2005).
The data on income inequality were taken from census tracts for the municipality of São Paulo (13,278 in total) (IBGE, 2003). Per capita income of all residents (including households where the head of the household had income equal to zero) was used in the calculation, with the census tracts used as the unit of analysis. Inequality of income was measured using the Gini coefficient, which is calculated based on the Lorenz curve through the area formed by the distance between real distribution and perfectly egalitarian distribution of income (Sen, 1973).
The Gini coefficient values for the districts va-ried from 0.12 (Jaguará) to 0.55 (Vila Andrade). In this study, a district was considered exposed if it had a Gini coefficient of 0.25 or higher (high inequality) and non-exposed if the indicator was below 0.25 (low inequality). As there is no consensus in the litera-ture on what Gini value can be considered as high, it was decided to define this limit as 0.25, as it was close to the median value of the Gini indices for the paulistano districts.
The variables chosen for the propensity score matching concerned absolute characteristics of the districts. They were selected by the authors as they dealt with important social, demographic and edu-cational characteristics which could affect health besides income inequality.
ma-jority of the data were taken from the 2000 Census (IBGE, 2003). The number of teachers per student was obtained from the 2001 Educational Census and the incidence of AIDS from the Municipal Epidemio-logical Bulletin - Boletim Epidemiológico Municipal (CEM, 2002; SMSP, 2003). The overall coefficients of mortality were standardized by age and refer to the 1998 to 2002 period (annual values calculated using population data from the 2000 Census).
Results
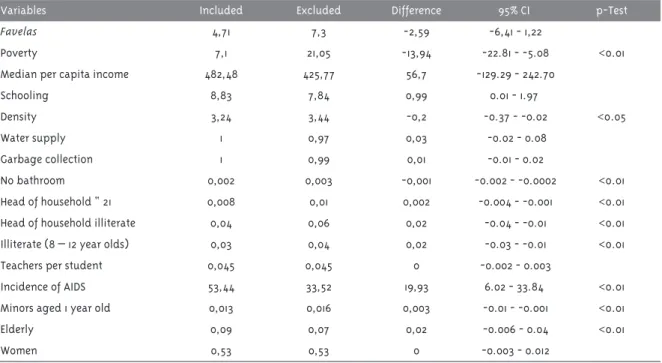
The PS values varied from 0 (Marsilac district) to 1 (Vila Andrade), with a median value equal to 0.63. The area below the ROC curve, or c-statistic, was 0.907, which indicates high predictive power (high sensitivity). In other words, the exposed districts had consistently higher PS values, which is what was ex-pected given the methodology (Stürmer et al., 2006). Of the 96 districts, only 27 had a PS which sa-tisfied the caliper width limit of 0.01 in relation to another district with different exposure included in the analysis. The differences observed between the
included and excluded districts are shown in Table 1. In this case, it was expected that there would be significant difference between them, as the metho-dology was applied to exclude the districts which did not have at least one other district with similar cha-racteristics, i.e., possible outliers. Of the 16 variables selected, 9 had statistically significant differences between the included and excluded (p ≤ 0.05).
Analysis of the relationship between the coeffi-cient of annual mortality adjusted for age and the Gini coefficient in the 96 districts showed that re-gions on the periphery of São Paulo, in general, had a higher coefficient of mortality, with the exception of the districts in the center (Map 1). The eastern zone and the extreme south of the city had the lowest Gini indices (i.e., they are the most equal); on the other hand, they are poorer than the other zones. All of the 14 districts with the lowest median income had Gini indices above the median for the municipality (0.25).
More central regions in the city had higher propensity score values, in consequence of the distribution of the variables and higher income ine-quality (Map 2). It is, however, possible to verify the
Table 1 - Distribution of percentages and number of subjects for each variable and its respective differences according to the distritos (included and excluded)*, Municipality of São Paulo, 2000
Variables Included Excluded Difference 95% CI p-Test
Favelas 4,71 7,3 -2,59 -6,41 - 1,22
Poverty 7,1 21,05 -13,94 -22.81 - -5.08 <0.01 Median per capita income 482,48 425,77 56,7 -129.29 - 242.70
Schooling 8,83 7,84 0,99 0.01 - 1.97
Density 3,24 3,44 -0,2 -0.37 - -0.02 <0.05 Water supply 1 0,97 0,03 -0.02 - 0.08
Garbage collection 1 0,99 0,01 -0.01 - 0.02
No bathroom 0,002 0,003 -0,001 -0.002 - -0.0002 <0.01 Head of household < 21 0,008 0,01 0,002 -0.004 - -0.001 <0.01 Head of household illiterate 0,04 0,06 0,02 -0.04 - -0.01 <0.01 Illiterate (8 – 12 year olds) 0,03 0,04 0,02 -0.03 - -0.01 <0.01 Teachers per student 0,045 0,045 0 -0.002 - 0.003
Incidence of AIDS 53,44 33,52 19,93 6.02 - 33.84 <0.01 Minors aged 1 year old 0,013 0,016 0,003 -0.01 - -0.001 <0.01 Elderly 0,09 0,07 0,02 -0.006 - 0.04 <0.01 Women 0,53 0,53 0 -0.003 - 0.012
Map 1 - Distribution of the age-adjusted total mortality coefficients by Gini coefficient, Municipality of São Paulo, 1998-2002
Map 2 - Distribution of the propensityusing score values by Gini coefficient, Municipality of São Paulo, 2000
existence of some districts with high PS and more equality in the central regions of the municipality, which increases the possibility of matching.
Map 3 shows the spatial results of the matching using the propensity score methodology. Of the 96 districts included in the analysis, after matching, 27 were considered “comparable” according to the 16 selected variables, resulting in a total of 17 pairs. Two districts were matched four times (Vila Mariana and Saúde) and the district of Santana was matched twice. Taking into consideration the nine official ad-ministrative zones of the municipality of São Paulo (northwest, northeast, west, center-south, center, southeast, south, east 1, east 2), only 3 of the 17 pairs belonged to the same administrative zone (Santana--Casa Verde, Santo Amaro-Vila Mariana and Campo Limpo-Cidade Ademar). And of all the pairs, only one shared a common border: Santana-Casa Verde.
Discussion
This study allowed the analysis of the complexities of the differences between districts in the munici-pality of São Paulo, using income distribution cal-culated by the Gini coefficient. Of the 96 districts in the city, only 27 were deemed comparable with some other, taking into consideration the 16 variables selected. Only one of the 17 pairs was of districts which shared a common border. The difficulty in pinpointing a pattern of spatial distribution of de-mographic and residential characteristics points to the need for a new approach in analyzing the health of the paulistas.
Map 3 - Visual identification of the included distritos using propensity score matching, Municipality of São Paulo, 2000
propensity score was used to control for absolute differences between districts, no statistically signi-ficant association was found between coefficients of mortality adjusted for age and poverty (measured by the proportion of individuals with income below one minimum wage), proportion of favelas, or Gini coefficient.
Comparing patterns of mortality in the paulis-tano districts based on only one of the countless possible variables which influences health is an error which affects the validity of the results. One cannot talk about comparing poor regions with rich ones without taking into consideration the comple-xity of the city’s social distribution. Some districts in São Paulo have a high proportion of poor and a high median income. An example of this situation is Morumbi, which has the third highest median income of the 96 districts and, at the same time, 10% of its residents live on less than one minimum wage
per month. On the other hand, there are districts which are extremely egalitarian, but which have a high proportion of favelas. The district of Pedreira has a Gini coefficient value below the median for the municipality, despite having the second highest proportion of residents living in favelas (38%).
However, a limitation of the methodology is not being able to control for variables not included in the model, in contrast to what happens in traditional randomized studies (Luellen et al., 2005). Moreover, it is difficult to use in smaller cities, due to the need for a large initial sample (in this study, only 27 of the 96 districts were included in the final analysis).
São Paulo continues to be a city of great con-trasts. Analyzing it using direct comparisons be-tween districts, or by administrative regions, means assuming a uniformity of characteristics which simply does not exist. This study indicates the need for the introduction of other methodologies which enable a large number of variables to be included.
References
ALMEIDA, R.; D’ANDREA, T. Pobreza e redes sociais em uma favela paulistana. Novos Estudos, São Paulo, v. 68, n. 1, p. 94-106, 2004.
AUSTIN, P. C. A critical appraisal of propensity-score matching in the medical literature between 1996 and 2003. Statistics in Medicine, Malden, v. 27, n. 12, p. 2037-2049, 2008a.
AUSTIN, P. C. Primer on statistical interpretation or methods report card on propensity-score matching in the cardiology literature from 2004 to 2006. Circulation: Cardiovascular Quality and Outcomes, Boston, v. 1, n. 1, p. 62-67, 2008b.
AUSTIN, P. C. Statistical criteria for selecting the optimal number of untreated subjects matched to each treated subject when using many-to-one matching on the propensity score. American Journal of Epidemiology, Baltimore, v. 172, n. 9, p. 1092-1097, 2010.
CALDEIRA, T. P. R. Cidade de muros: crime, segregação e cidadania em São Paulo. São Paulo: EdUSP, 2000.
CEM - CENTRO DE ESTUDOS DA METRÓPOLE. Bases de dados georreferenciadas da região metropolitana de São Paulo, a partir do censo escolar de 2001. São Paulo, 2002. Disponível em: <http://www.centrodametropole.org.br/cd/escolas/ ESC2001.rar>. Acesso em: 25 abr. 2012.
GOMES, S.; AMITRANO, C. Local de moradia na metrópole e vulnerabilidade ao (emprego e) desemprego. In: MARQUES, E.; TORRES, H. São Paulo: segregação, pobreza e desigualdades sociais. São Paulo: Senac, 2004. p. 169-194.
HANLEY J. A.; MCNEIL, B. J. The meaning and use of the area under a receiver operating characteristic (ROC) curve. Radiology, Boston, v. 143, n. 1, p. 29-36, 1982.
IBGE - INSTITUTO BRASILEIRO DE GEOGRAFIA E ESTATÍSTICA. Censo demográfico 2000: resultados do universo: agregados de setores censitários: São Paulo, Região Metropolitana. Brasília, DF, 2003. 1 CD-ROM.
LUELLEN J. K.; SHADISH, W. R.; CLARK, M. H. Propensity scores: an introduction and experimental test. Evaluation Review, Thousand Oaks, v. 29, n. 6, p. 530-558, 2005.
MARQUES, E. C.; TORRES, H. G. Pobreza e distribuição espacial de grupos sociais na metrópole de São Paulo. São Paulo: CEM, 2004. Disponível em: <http://www.fflch.usp.br/ centrodametropole/antigo/v1/pdf/Adenauer%20 ed%20har.pdf>. Acesso em: 19 set. 2013.
OAKES, J. M.; JOHNSON, P. J. Propensity score matching for social epidemiology. In: OAKES, J. M.; KAUFMAN, J. S. Methods in social
epidemiology. San Francisco: Jossey-Bass; 2006. p. 370-392.
ROSENBAUM, P. R.; RUBIN, D. B. The central role of the propensity score in observational studies for causal effects. Biometrika, Oxford, v. 70, n. 1, p. 41-55, 1983.
SARAIVA, C.; MARQUES, E. A dinâmica social das favelas da região metropolitana de São Paulo. In: MARQUES, E.; TORRES, H. São Paulo: segregação, pobreza e desigualdades sociais. São Paulo: Senac, 2004. p. 143-168.
SEN, A. K. On economic inequality. Oxford: Clarendon, 1973.
SHAH, B. R. et al. Propensity score methods gave similar results to traditional regression modeling in observational studies: a systematic review. Journal of Clinical Epidemiology, Amsterdam, v. 58, n. 6, p. 550-559, 2005.
SINGER, P. Desenvolvimento econômico e evolução urbana. São Paulo: Companhia Editora Nacional, 1977.
SMSP - SECRETARIA MUNICIPAL DA SAÚDE DE SÃO PAULO. DST/Aids na cidade de São Paulo. Boletim Epidemiológico de Aids do Município de São Paulo, São Paulo, v.7, p. 28-31, dez. 2003.
STÜRMER, T. et al. A review of the application of propensity score methods yielded increasing use, advantages in specific settings, but not substantially different estimates compared with conventional multivariable methods. Journal of Clinical Epidemiology, Amsterdam, v. 59, n. 5, p. 437-447, 2006.
TORRES, H. Medindo a segregação. In: MARQUES, E.; TORRES, H. São Paulo: segregação, pobreza e desigualdades sociais. São Paulo: Senac, 2004. p. 81-100.
TORRES, H. G. et al. Pobreza e espaço: padrões de segregação em São Paulo. Estudos Avançados, São Paulo, v. 17, n. 47, p. 97-128, 2003.
YUE, L. Q. Statistical and regulatory issues with the application of propensity score analysis to nonrandomized medical device clinical studies. Journal of Biopharmaceutical Statistics, New York, v. 17, n. 1, p. 1-13, 2007.