D. Hanumantha Rao
[email protected] MVSR Engineering College Mechanical Engineering Department 501512 Hyderabad, A.P, India
G. R. N. Tagore
[email protected] National Institute of Technology Mechanical Engineering Department 506008 Warangal, A.P, India
G. Ranga Janardhana
[email protected] JNTU College of Engineering Mechanical Engineering Department 533001 Kakinada, A.P, India
Evolution of Artificial Neural Network
(ANN) Model for Predicting Secondary
Dendrite Arm Spacing in Aluminium
Alloy Casting
Extensive solidification simulations are conducted using finite difference method on an aluminium alloy casting. Orthogonal experimental array layout is considered for running experimental simulations. Microstructural parameter Secondary Dendrite Arm Spacing (SDAS) at three different locations was predicted as response variable, through solidification simulations by varying the process parameters. The input process variables are pouring temperature, insulation on riser and chill volume heat capacity. An Artificial Neural Network (ANN) model was developed to predict the response variable for varied input process variables. Through sensitivity analysis the influence of input process variables on output response was obtained. The results obtained from solidification simulations and ANN model are validated experimentally.
Keywords: casting, secondary dendrite arm spacing, simulation, artificial neural networks
Introduction
1
Aluminium alloy castings are widely used in many industries such as the automotive and aerospace industries. Because of their low density as compared to ferrous alloys, aluminium alloys are very useful where lightweight and moderate strength are required of castings. The chemical, mechanical, and physical properties of cast and wrought metal products are greatly determined by the microstructure formed during solidification. The secondary dendrite arm spacing has been observed to have a significant impact upon the yield strength, ultimate tensile strength and elongation of cast products (Zhang et al., 2005). Knowledge of the effects of the SDAS on the characteristics of a cast product has allowed the aluminium casting industry to effectively troubleshoot, develop and improve different alloys.
Modelling of solidification behavior is becoming an important tool for predicting the properties of the cast components (Sasikumar, 1990). Numerical Heat transfer models based on the Finite Difference Method (FDM) present general method for simulating the solidification behavior of castings and checking for quality control parameters like cooling rate, porosity, solidification time and fraction solid (Karlson, 1997a). Virtual Casting (N.d.) is such program used in the present work that solves heat transfer equations with 3D finite difference method. The importance of Artificial Neural Networks (ANN) is that they offer a very powerful and very general framework for representing non-linear mappings from several input variables to several output variables, where the form of the mapping is governed by a number of adjustable parameters (Skapura, 1995a).
Determining Secondary Dendrite Arm Spacing (SDAS)
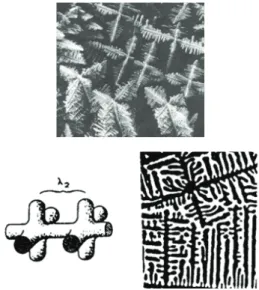
SDAS – Secondary Dendrite Arm Spacing measurements have become quality control tool in foundries producing high strength castings (Campbell, 1991). The spacing of the boundaries, i.e., the SDAS, is determined by local solidification time. This spacing determines the next growth node, during the growth of dendrites; the arm spacing distance for branching is shown in Fig.1.
Paper accepted January, 2010. Technical Editor: Anselmo Eduardo Diniz
Figure 1. Secondary dendrite arm spacing.
During the fractal growth of dendrites the arm spacing distance for branching may be calculated as (Kurz and Fisher, 1984) and (Xu and Liu, 2005):
( )
3 2= Mt.f
λ (1)
) C C )( k ( m
) C / C ln( D . M
eut o
o eut d
− − =
1
166 Γ (2)
where tf [s] is local solidification time, Ceut is eutectic composition
wt%, Co is the initial composition wt%, M is coarsening constant, Г
is the Gibbs-Thomson coefficient C-m, Dd is the diffusion
coefficient m2 s-1, m is the slope of the liquidus 100 C and k is the partition coefficient. For an Al-7%Si-0.3%Mg (A356) aluminium alloy, the coarsening constant M is equal to 680 µm3/s (ASM, 1992).
solidification time is obtained to find out the secondary dendrite arm spacing at any select locations within the casting.
Modelling Solidification Heat Transfer
A complete understanding of the phase change during solidification of casting involves the analysis of the various processes that accompany it. The most important of these processes from a macroscopic point of view is the heat transfer process. This is complicated by the release or absorption of the latent heat of fusion at the solid/liquid interface (Karlson et al., 1997b).
In metal casting heat transfer by conduction can be considered within the metal and the mould and this is governed by the equation:
(
K T)
Q .t T
C ⎟=∇ ∇ +
⎠ ⎞ ⎜ ⎝ ⎛ ∂ ∂
ρ (3)
where Q is the amount of heat released/generated in the system and
K is the thermal conductivity (W/m k), C is the specific heat
capacity (J/kg k ) and ρ is the density (kg/m3).
The rate of latent heat released during solidification is given by
t T T f L t f
L s s
∂ ∂ ∂ ∂ = ∂
∂ (4)
where L is the latent heat per unit mass. The latent heat can be added to the transient term on the left hand side of Eq. 3 to arrive at the following energy equation:
(
k T . t Tc~ ⎟=∇ ∇ ⎠ ⎞ ⎜ ⎝ ⎛ ∂ ∂
ρ
)
(5)where
T f L c
c~ s
∂ ∂ −
= (6)
is termed as the apparent heat capacity. Thus, the phase change problem is simply converted into a heat transport problem with temperature dependent heat capacity.
An explicit finite difference method has been used to solve the heat transfer equations. An eight-node brick element aligned along the three orthogonal cartesian axes was used for meshing (Virtual Casting, N.d.). Through solidification simulations the local solidification times can be obtained to calculate the SDAS values at desired locations.
Experimental Simulations
The objectives of the experimental simulations are to obtain the necessary preliminary data for developing the ANN with SDAS at three locations as response variables. The component considered in the present investigation for experimental simulations is an A356 Aluminium-Silicon hypoeutectic alloy stepped block, as shown in the Fig. 2.
Figure 2. Detail drawing and solid model of the component.
Orthogonal Arrays or OA’s greatly simplify the estimation of individual factor effects even when several factors are varied simultaneously (Antony, 2003). A four-factor three level L27 orthogonal array is used for planning the experimental simulations. The process parameters, which are considered for developing the ANN model, are pouring temperature, insulation on riser and chill volume heat capacity (Hanumantha Rao et al., 2007; Zhang et al., 2005). The details of the factors and their levels considered for simulations are shown in Table 1.
Table 1. Factors and their levels.
S. No. Factor Level 1 Level 2 Level 3
1. Pouring Temperature (PT) 725 °C 750 °C 775 °C
2. Riser Insulation (RI) No Insulation (0) 8 mm thick 12 mm thick
3. Chill Thickness (CT) No chill (0) 8 mm thick 11 mm thick
4. Chill Contact Area (CCA) 100 mm2 75 mm2 50 mm2
The main objective of experimental simulations is to obtain the local solidification times to calculate the corresponding secondary dendrite arm spacing values at location, as shown in Fig. 2. The chill material considered for simulation is mild steel having density of 7.85 g/cm3, thermal conductivity of 45.06 w/m-k and specific heat
Table 2. Data summary showing ANN for SDAS.
Input parameters
No. of hidden layers
No. of data sets for training
No. of data sets for cross validation
No. of data sets for production
Network output
1. Pouring Temperature (PT) 2. Riser Insulation (RI) 3. Chill Thickness (CT) 4. Chill Contact area (CCA)
02 22 03 03
1. SDAS 1 2. SDAS 2 3. SDAS 3
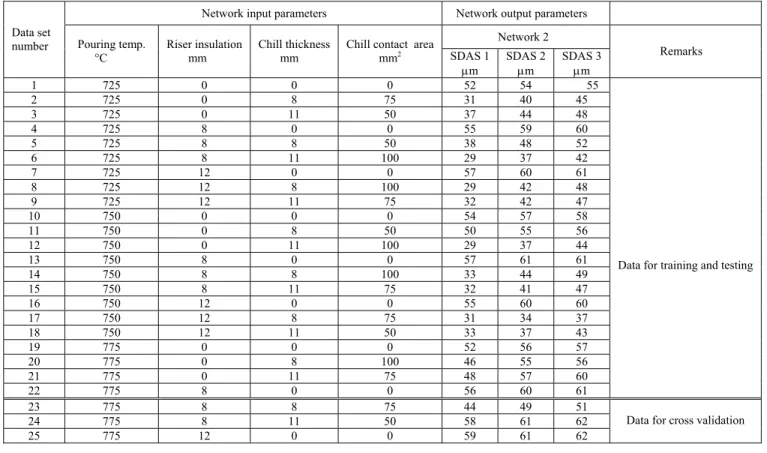
Table 3. Data sets used for training and cross validation of ANN.
Network input parameters Network output parameters
Network 2 Data set
number Pouring temp.
°C
Riser insulation mm
Chill thickness mm
Chill contact area
mm2 SDAS 1
μm
SDAS 2 μm
SDAS 3 μm
Remarks
1 725 0 0 0 52 54 55
2 725 0 8 75 31 40 45
3 725 0 11 50 37 44 48
4 725 8 0 0 55 59 60
5 725 8 8 50 38 48 52
6 725 8 11 100 29 37 42
7 725 12 0 0 57 60 61
8 725 12 8 100 29 42 48
9 725 12 11 75 32 42 47
10 750 0 0 0 54 57 58
11 750 0 8 50 50 55 56
12 750 0 11 100 29 37 44
13 750 8 0 0 57 61 61
14 750 8 8 100 33 44 49
15 750 8 11 75 32 41 47
16 750 12 0 0 55 60 60
17 750 12 8 75 31 34 37
18 750 12 11 50 33 37 43
19 775 0 0 0 52 56 57
20 775 0 8 100 46 55 56
21 775 0 11 75 48 57 60
22 775 8 0 0 56 60 61
Data for training and testing
23 775 8 8 75 44 49 51
24 775 8 11 50 58 61 62
25 775 12 0 0 59 61 62
Data for cross validation
Development of ANN Model
The ANN model is developed for secondary dendrite arm spacing as response variable, at three different locations in the casting as SDAS 1, SDAS 2 and SDAS 3 in a multilayer perceptron network (Skapura, 1995b). The training options are with error correction learning. The developed multilayer perceptron network consists of four input processing elements, two hidden layers, and two output processing elements. Table 2 shows the data summary used for development of network. The details of data sets used for training and cross validation of the ANN are presented in Table 3.
The multi output network was tested for its accuracy with the training data sets for all the three output responses, SDAS1, SDAS2 and SDAS3. The comparison between desired output from simulations and output from testing of the network for SDAS1 is presented in Fig. 3.
0 10 20 30 40 50 60 70
1 2 3 4 5 6 7 8 9 10 11 1213 14 1516 1718 1920 21 22
Tr aining Data s e ts
S
D
A
S
1
Desired
ANN output
Figure 3. Comparison of desired SDAS values with ANN predicted SDAS values.
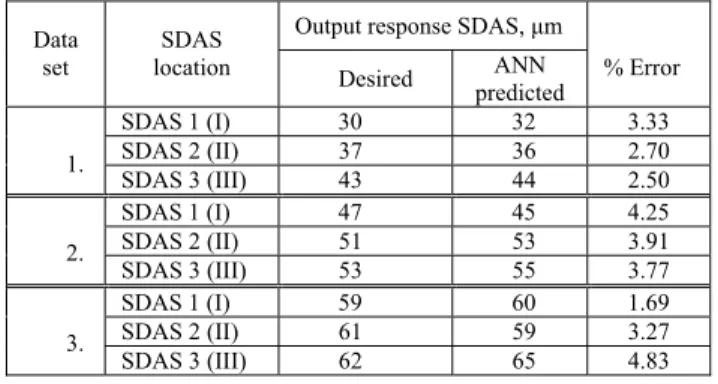
The errors obtained from training and cross validation of the ANN are presented in Table 4 for SDAS. After completion of the testing phase of the network with cross validation data and training data, the model is used to obtain all SDAS values as the response variables, for a new set of data, which are not in either training or validation datasets.
Table 4. Errors obtained from ANN models for porosity.
S.No. Description MSE Final MSE
1. Training phase 0.00292062 0.0029312
2. Cross validation 0.0771134 0.092412
Sensitivity analysis is performed for the developed network model about mean output. The results from sensitivity analysis for varied input process parameters for all the SDAS values are shown in Fig. 4.
Table 5. Details of input variables for production of SDAS.
Input process variables Data set
number Pouring temp 0
C
Riser insulation,
mm
Chill thickness
mm
Chill contact area, mm2
1. 750 12 11 100
2. 775 12 8 50
3. 775 12 0 0
Table 6. Comparison of simulation and ANN predicted values for SDAS.
Output response SDAS, μm Data
set
SDAS
location Desired ANN
predicted
% Error
SDAS 1 (I) 30 32 3.33
SDAS 2 (II) 37 36 2.70
1.
SDAS 3 (III) 43 44 2.50
SDAS 1 (I) 47 45 4.25
SDAS 2 (II) 51 53 3.91
2.
SDAS 3 (III) 53 55 3.77
SDAS 1 (I) 59 60 1.69
SDAS 2 (II) 61 59 3.27
3.
SDAS 3 (III) 62 65 4.83
Table 7. Process parameters used for test castings.
Test casting sample number
Pouring temperature
oC
Riser insulation
mm
Chill thickness
mm
Chill contact
area, mm2
1 750 12 11 100
2 775 0
(No insulation)
0
(No chill) 0
3 750 12 0
(No chill) 0
0 0.1 0.2 0.3 0.4 0.5 0.6 0.7 0.8 0.9
Pouring Temperature
Riser Insulation Chill thickness Chill contact area
Input Process Param eters
S
e
n
s
it
iv
it
y
S D A S 1
S D A S 2
S D A S 3
Figure 4. Output from sensitivity analysis.
Experimental Validation
Necessary experimentation is carried out for validation of solidification simulations and developed neural network model. Three different test castings are made as per the selected process parameters of A356 aluminium alloy. The process parameters used for the three test castings are shown in Table 7. Figure 5 shows the typical casting with gating and riser of the cast component. Similarly, Fig. 6 shows the typical cast component after machining to obtain metallurgical samples.
Figure 6. Component after machining.
Measurement of SDAS
Secondary dendrite arm spacing can be measured with microscope using the image analysis system with appropriate magnification and calibration. The linear line intercept method can be used to measure the dendrite arm spacing with different orientations at required locations. A line along the dendrite arm is drawn and the number of arms crossing this line is then counted (Crepeau et al., 1989). Measurements of secondary dendrite arm spacing were carried out near the locations in the sample castings, from where the SDAS values are determined from simulation. The images of microstructures are analyzed for SDAS values using MiC V2.0.0 microstructure characterization program. Linear intercept method is used for measurement of SDAS in four different orientations on each micrograph and the average SDAS values are recorded. Length of a line along the center of secondary dendrite arm spacing is measured. Figure 7 shows typical microstructure with line drawn for measurement of SDAS.
Figure 7. Measurement of SDAS.
Total nine different samples are prepared from all the three test castings to compare the results obtained from solidification simulations and ANN. The optical micrographs of sample 1, with 50X magnification are shown in Fig. 8. Similarly, six different optical micrographs are obtained from other two test castings.
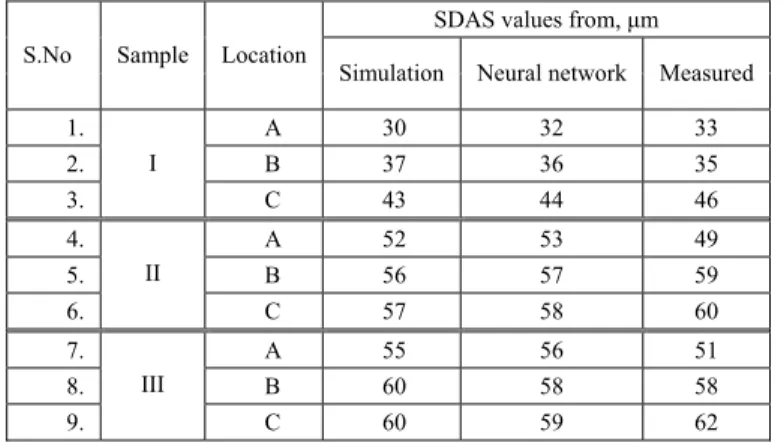
The results from SDAS measurements are shown in Table 8. The measured values of SDAS from test castings compared with the results obtained from solidification simulations and neural network predicted are shown in Table 9. The comparisons of these results are shown in Fig. 9.
50 X 50 X 50 X
Location I Location II Location III
Figure 8. Microstructures at different locations from sample 1.
Table 8. Measured values of SDAS.
Secondary dendrite arm spacing, (SDAS) μm Orientations
S. No. Test casting Location
1 2 3 4 Average SDAS
1. I 35 31 34 32 33
2. II 32 35 33 36 35
3. 1 III 48 44 47 45 46
4. I 46 51 47 52 49
5. II 56 61 57 62 59
6. 2 III 62 59 63 56 60
7. I 47 53 50 54 51
8. II 59 61 57 55 58
Table 9. SDAS values obtained from measurements, simulation and ANN predicted.
SDAS values from, μm
S.No Sample Location
Simulation Neural network Measured
1. A 30 32 33
2. B 37 36 35
3. I
C 43 44 46
4. A 52 53 49
5. B 56 57 59
6. II
C 57 58 60
7. A 55 56 51
8. B 60 58 58
9. III
C 60 59 62
25 30 35 40 45 50 55 60 65
0 1 2 3 4 5 6 7 8 9
Sample Number
S
D
A
S
v
a
lu
e
s
Simulation ANN predicted Measured
Figure 9. SDAS values obtained from simulation, ANN and measurements from castings.
Conclusions
An Artificial Neural Network model was developed through solidification simulations and validated experimentally. Predicting the SDAS values reveals mechanical behavior of the cast component, which reduces tedious, cut and trail methods. Sensitivity analysis that represents the chill thickness and insulation on riser are more sensitive rather than pouring temperature and chill contact area in controlling the desired SDAS. Through solidification simulations and experimentation, it was observed that the chills are to be provided with maximum contact area and excessive pouring temperature was leading to coarser SDAS. ANN models can be used to successfully model complex behavior of highly non-linear relationship among casting process variables. Hence, a novel manufacturing system is proposed in the present investigation to improve the quality of cast components.
Acknowledgements
The authors wish to thank Dr. S. Sundarrajan, Chairman, R&D centre, Institute of Indian Foundrymen (IIFM), Dr. Roshen
Sasikumar of Regional Research Laboratories, Trivandrum and authorities of IIFM, Hyderabad chapter for their valuable assistance and encouragement.
References
Antony, J., 2003, “Design of Experiments for Engineers and Scientists”, Butterworth Heinemann, pp.34-39.
ASM, 1992, “Properties and selection of non-ferrous alloys and special purpose materials”, Metals Handbook, ASM, Vol. 2, pp. 164-166.
Bencomo, A., et al., 2008, “Simulation of the aluminum alloy A356 solidification cast in cylindrical permanent molds” Revista Matéria, Vol. 13, No. 2, pp. 294-303.
Campbell, J., 1991 “Castings”, Butterworth-Heinemann, London, pp 131-134. Crepeau, P.N., Gokhalr, A.M. and Mcyers, C.W., 1989, “Quantitative analysis of cast microstructure”, Journal of Metals, Vol. 41. No. 2, pp. 16-21.
Groll, T.A., 2004, “Effect of solidification rate on cast microstructure”, Padnos College of Engineering and Computing Grand Valley State University.
http://www.eod.gvsu.edu/~grollt/EGR%20367/Lab%205/Lab%205%20-%20report.pdf
HanumanthaRao, D., Tagore, G.R.N., and Rangajanardhana, G., 2007, “Estimation of porosity in aluminium alloy casting through solidification simulations and artificial neural networks”, Intl. Journal of Manufacturing Technology and Research, Vol. 3, No. 1/2, pp. 79-85.
Karlson, L., 1997a, “Modelling in Welding, Hot Powder Forming and Casting”, ASM International, 165 p.
Karlson, L. et al., 1997b, “Modelling in Welding, Hot Powder Forming and Casting”, ASM International, 175 p.
Kurz, W. and Fisher, D.J., 1984, “Fundamentals of Solidification”, Trans Tech Publications Ltd, pp. 214-216.
Sasikumar, R., 1990, “Computer simulation of microstructural evolution in columnar castings”, Cast Metals, Vol. 2, 214 p.
Skapura, D.M., 1995a, “Building Neural Networks”, Addision-Wesly Publishing Company, pp. 6-7.
Skapura, D.M., 1995b, “Building Neural Networks”, ACM Press, Addision-Wesly Publishing Company, pp. 31-32.