Erick de Moraes Franklin
[email protected] Campinas State University – Unicamp Faculty of Mechanical Engineering 13083-860 Campinas, SP, Brazil
Initial Instabilities of a Granular Bed
Sheared by a Turbulent Liquid Flow:
Length-Scale Determination
The transport of granular matter by a fluid flow is frequently found in nature and in industry. When the shear stresses exerted by the fluid flow on a granular bed are bounded to some limits, a mobile granular layer known as bed-load takes place, in which the grains stay in contact with the fixed part of the granular bed. Under these conditions, an initially flat granular bed may be unstable, generating ripples and dunes, such as those observed in deserts, but also in pipelines conveying sand. There are evidences that these forms have a typical length correlated to their initial wavelength. So, the length-scale of the initial linear instabilities is a key point to understand the typical structures observed. This paper presents a theoretical study of the initial instabilities on a granular bed sheared by a turbulent liquid flow without free-surface effects, when bed-load is present. This study consists of a linear stability analysis, taking into consideration fluid flow, relaxation and gravity effects, and it is compared to published experimental data. It is proposed here, differently from many previous studies, that the initial wavelength of bed-forms varies with flow conditions when the fluid is a liquid.
Keywords: two-phase flow, granular bed, bed-load, instabilities, pattern formation
Introduction
1
The transport of solid particles entrained by a fluid flow is frequently found in nature and in industry. It is present, for example, in the erosion of river banks, in the displacement of desert dunes and in hydrocarbon pipelines conveying sand. When shear stresses exerted by the fluid flow on the granular bed are able to move some grains, but are relatively small compared to the grains weight, the flow is not able to transport grains as a suspension. Instead, a mobile layer of grains known as bed-load takes place in which the grains stay in contact with the fixed part of the granular bed. The thickness of this mobile layer is of a few grain diameters (Bagnold, 1941; Raudkivi, 1976).
Under the fluid flow, a flat granular bed may become unstable and give rise to bed-forms. These forms are initially two-dimensional, but they may grow and generate patterns such as dunes. For instance, such instabilities give rise to the migrating aeolian dunes observed in nature, which are one of the mechanisms of the expansion of deserts (Bagnold, 1941). The aquatic dunes observed on the bed of some rivers are another example. These forms create a supplementary friction between the bed and the water, affecting the water depth and being related to flood problems. In cases where their size is comparable to the water depth, water flows can experiment strong depth variations, seriously affecting navigation (Engelund and Fredsoe, 1982). In industry, examples are mostly related to closed-conduit flows conveying grains, such as hydrocarbon pipelines conveying sand. In such cases, the bed-forms generate not only supplementary pressure loss, but also pressure and flow rate transients (Kuru et al., 1995; Franklin, 2008).
The stability of a granular bed is given by the balance between local grains erosion and deposition. If there is erosion at the crests of the granular bed, the amplitude of initial bed undulations decreases and the bed is stable. Otherwise, the bed is unstable. If there is neither erosion nor deposition at the crests, there is neutral stability.
The regions of erosion and deposition can be found from the mass conservation of grains. The mass conservation implies that there is erosion in regions where the gradient of the flow rate of grains is positive and deposition where it is negative, so that the phase lag between the flow rate of grains and the bed-form is a
Paper accepted March, 2010. Technical Editor: Francisco Ricardo Cunha.
stability criterion. If the maximum of the flow rate of grains is upstream a crest, there must be deposition at the crest and the bed is unstable, otherwise the bed is stable. To answer the stability question, the mechanisms creating a phase lag between the shape of the granular bed and the flow rate of grains need to be known. They are three: the fluid flow perturbation by the shape of the bed, the relaxation effects related to the grains and the gravity effects. The fluid flow perturbation is known to be the unstable mechanism (Jackson et al., 1975; Hunt et al., 1988 and Weng et al., 1991), and the relaxation and the gravity effects are the stable mechanisms (Valance and Langlois (2005) and Charru (2006) in the case of viscous flows).
A “hydrodynamic stability” approach (Drazin and Reid, 2004) may be employed to address the stability of a sheared granular bed if some assumptions are made (described in the following sections). Many works on the stability of granular beds sheared by a fluid were made in the last decades using this approach (Kennedy, 1963; Engelund, 1970; Richards, 1980; Elbelrhiti et al., 2005 and Claudin and Andreotti, 2006, for instance). A remarkable overview of this kind of work can be found in Engelund and Fredsoe (1982).
It must be noted that the granular matter in itself is one of the challenging problems in physics today, so that our knowledge about it is confined to fundamental physics (Duran, 1999). As with any fundamental problem of this kind, the interest here is in finding correlations and tendencies between the relevant parameters, both theoretically and experimentally. Determination of the precise values of wavelength, growth rate and celerity as observed in nature is not possible yet.
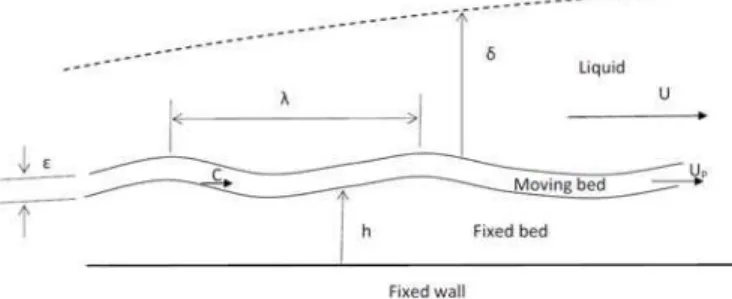
Figure 1. Granular bed sheared by a fluid flow. U is the mean velocity of the fluid, UP is the mean velocity of grains, h is the height of the fixed bed,
is thickness of the moving bed, c is the celerity of the bed-forms, λ is the wavelength of the bed-forms and is the boundary-layer thickness. In the present paper, c << UP << U, << h, Re = u*/ ν > 102 and, if η is the
amplitude of the bed-forms, η/λ << 1 and η/ << 1. u* is the friction velocity
(defined in the following sections) and ν is the kinematic viscosity.
The next two sections present a linear stability analysis for a granular bed sheared by a turbulent liquid flow (without free-surface effects). The obtained wavelengths are compared in the following section to some published experimental data. A conclusion section follows.
Nomenclature
A = constant
B = constant
c = phase velocity, m.s-1 d = mean grain diameter, m g = acceleration of gravity, m.s-2 H = channel height, m
h = local height of the granular bed, m i = imaginary number
k = wave-number, m-1 L = length-scale, m
Q = volumetric flow rate of grains by unit of width, in the basic state, m2.s-1
q = local volumetric flow rate of grains by unit of width, m2.s-1 u = fluid velocity, m.s-1
*
u = shear velocity, m.s-1 US = grain settling velocity, m.s-1 Up = mean grain velocity, m.s
-1
Re = Reynolds number
(
Re=HUν)
Reδ = friction Reynolds number ⎟ ⎠ ⎞ ⎜
⎝ ⎛ =
ν δ δ u*
Re
Rep = particle Reynolds number ⎟ ⎠ ⎞ ⎜
⎝
⎛ =
νμ τ
2
d Rep
Res = settling Reynolds number ⎟ ⎠ ⎞ ⎜
⎝ ⎛ =
ν
S S dU
Re
t = time, s
x = horizontal (longitudinal) coordinate, m y = vertical coordinate, m
y0 = rugosity height, m
Greek Symbols
= boundary-layer thickness, m = thickness of the moving bed, m
η = amplitude of the initial instabilities, m = von Kármán constant
= wavelength of the initial instabilities, m µ = dynamic viscosity, Pa.s
ρ = density, kg.m-3 = growth rate, s-1 = shear stress, Pa = kinematic viscosity, m2.s-1
= integration variable, m
ω = frequency, s-1
Subscripts
d relative to deposition drag relative to the inertial scale dune relative to a dune
g relative to the acceleration of gravity k relative to the Fourier space
max relative to the most unstable (amplified) mode 0 relative to the basic state
p relative to grains s relative to settling
sat relative to the saturated regime x relative to the real space
Superscripts
^ perturbation
Linear Stability Model
This paper presents a stability analysis of the initial bed-forms on a granular bed under a turbulent liquid flow, without free-surface effects. The analysis presented here is two-dimensional, which is justified by taking into consideration the Squire’s Theorem for parallel flows (Drazin and Reid, 2004): the most unstable modes in parallel flows are two-dimensional.
A granular bed is not a continuum media, limiting the definition of small perturbations (undulations) on the bed surface and the employment of a continuum spectrum of normal modes (which are the basis of linear hydrodynamic stability analysis, Drazin and Reid (2004)). This limitation can be handled by supposing that the granular bed undulations need only to be smaller than some fluid flow scales (as the flow depth or the logarithmic layer of a turbulent boundary-layer, for example), as done by many authors (Kennedy, 1963; Engelund, 1970; Richards, 1980; Elbelrhiti et al., 2005 and Claudin and Andreotti, 2006). The same assumption is made here. To proceed with the analysis, the equations describing the problem are first presented.
Fluid Flow Perturbation
An undulation on a granular bed, such as a ripple or a dune, perturbs the fluid flow. The perturbation of a turbulent boundary-layer by a hill with small aspect ratio was analytically found by Jackson and Hunt (1975) and by Hunt et al. (1988). Their results were later applied to forms with higher aspect ratio by Weng et al. (1991). Jackson and Hunt (1975), Hunt et al. (1988) and Weng et al. (1991) found that the perturbed shear stress is shifted upstream the dune crest. Sauermann (2001) and Kroy et al. (2002) simplified the results of Weng et al. (1991) and obtained an expression containing only the dominant physical effects of this perturbation, making clear the reasons for this upstream shift. For a hill with a height h, a surface rugosity y0 and a length 2L between the half-heights (total length ≈ 4L), they showed that the perturbation of the longitudinal shear stress (dimensionless) is
⎟⎟ ⎠ ⎞ ⎜⎜
⎝ ⎛
∂ + − ∂
= ∫ d B h x
h A
ˆx x ξ x
ξ π
τ 1
(1)
where is an integration variable and A and B are considered as constants, as they vary with the logarithm of L/y0 (the variable used in the Jackson and Hunt (1975) gauge functions). Variations in three orders of magnitude of L/y0, L/y0 = 10
3
, L/y0 = 10 4
and L/y0 = 10 5
(keeping the same rugosity) by three orders of magnitude have small effect in both A and B, which maintain the same order of magnitude. For a fixed bed, y0 = d/30. For a moving bed, y0≈ d in the case of gases and y0≈ d/10 in the case of liquids (Raudkivi, 1976).
The first term in the RHS of Eq. (1), the convolution product, is symmetric, similar to the potential solution of the flow perturbation by a hill. It comes from the pressure perturbations caused by the hill. The second term in the RHS of Eq. (1), which takes into account the local slope, is anti-symmetric. It comes from the non-linear inertial terms of the turbulent flow and can be seen as a second order correction of the potential solution, with minor changes in the magnitude of the first order solution, but causing an upstream shift. The perturbed fluid flow is then the unstable mechanism. The perturbation of a turbulent boundary-layer was experimentally measured by Sauermann et al. (2003) in the aeolian case and by Franklin (2008) in the aquatic case, and it agrees with Eq. (1). In the Fourier space, Eq. (1) may be written as (dimensionless)
(
k iBk)
Ah
ˆk = +
τ (2)
where k = -1 is the longitudinal wave-number ( is the wavelength) and i is the imaginary number. If the perturbation is supposed small compared to a basic flow, the fluid flow over the bed can be written as a basic flow, unperturbed, plus a flow perturbation. For the shear stress on the bed surface
(
τ)
τ
τ = 01+ˆ (3)
where 0 is the shear stress caused by the basic flow on the bed and
τ
ˆ
is the shear stress (without dimension) caused on the bed by the perturbation of the fluid flow. For a developed turbulent liquid flow over a granular bed, the basic flow is a rough turbulent boundary-layer, which has the well known logarithmic profile⎟ ⎠ ⎞ ⎜ ⎝ ⎛ =
0
y y log u
u *
κ (4)
where is the Kármán constant, y0 is the rugosity height, u(y) is the unperturbed velocity profile and u* is the friction velocity, defined
as 12 12
0
− =τ ρ
*
u . The shear stress of the basic flow 0 is obtained from Eq. (4) and the perturbation
τ
ˆ
from Eq. (1) or (2).Saturated Flow Rate of Grains
In a steady state regime, and without spatial variations, the fluid flow and the flow rate of grains are in equilibrium. The fluid flow entrains a certain amount of grains, which gets momentum from the fluid and dissipate it by shearing and by impacts with the fixed part of the granular bed. The fluid flow capability to transport grains is limited by this feed-back mechanism, and equilibrium is reached if there is enough length (or time) to the development of this interaction. The flow rate of grains in this equilibrium situation is known as “saturated flow rate of grains”. Bagnold (1941) showed that, far from the incipient motion of grains,
2 3
τ
~
qsat (5)
where qsat is the volumetric flow rate of grains by unit of width. If the fluid flow perturbation is given by Eq. (3) (from Jackson and Hunt, 1975; Hunt et al. 1988 and Weng et al., 1991)
(
1 τˆ)
32~ Q q
sat
sat + (6)
where Qsatis the volumetric flow rate of grains by unit of width over a flat surface (basic state). A linear expansion can be made in Eq. (6), as suggested by Andreotti et al. (2002)
(
Ahk iBk)
~Q q
sat
sat + +
2 3
1 (7)
Relaxation Effects
In the case of a fluid flow over an undulated bed, the shear stress caused by the fluid on the bed is always changing. The flow rate of grains will lag some distance (or time) with respect to the fluid flow, being then a stable mechanism. This distance is usually called “saturation length”, Lsat.
A simplified expression taking into account this relaxation effect can be obtained from the erosion-deposition model of Charru et al. (2004):
sat sat x
L q q
q= −
∂ (8)
Equation (8), describing the relaxation of the flow rate of grains in varying fluid flow, is similar to the one obtained by dimensional considerations by Andreotti et al. (2002). A different equation was found by Sauermann et al. (2001), based on their continuum saltation model (not shown here).
Hersen et al. (2002), Andreotti et al. (2002), Kouakou and Lagrée (2005), Valance and Langlois (2005), Elbelrhiti et al. (2005) and Claudin and Andreotti (2006) consider that the saturation length has an inertial origin and is proportional to the traveling distance of individual grains, given by Ldrag = d ρp/ρ, where ρpis the density of one grain. Parteli et al. (2007) found that, in the case of aeolian sand
transport, −2
* drag
sat ~L u
L . In these expressions, Ldragis an inertial
length-scale obtained when the density of the grain material is many times larger than the density of the fluid, ρp >>ρ. It is then pertinent when the fluid is a gas. When the fluid is a liquid, however, ρp≈ρ and it was argued by Charru (2006) and Franklin (2008) that this length-scale can no longer be applied. Instead, a relaxation length based on the deposition of an individual grain must be used, Ld :
⎟ ⎠ ⎞ ⎜ ⎝ ⎛ =
S * d
sat ~L d u U
L (9)
Gravity Effects
Gravity weakens the transport of grains over positive slopes (upstream the crests) and facilitates it over negative slopes (downstream the crests), being inversely proportional to the slope of the bed. It is another stable mechanism. Gravity effects are felt by the flow rate of grains (which is proportional to the shear stress) and for this reason they are modeled here by computing an effective shear stress perturbation, even if weight and friction have different natures (the weight is a body force and the fluid friction is a surface force). This is a manner to take into account the effects of gravity without the need of an extra equation. The effective shear stress perturbation is given by.
h B h B d x
h A
ˆ x x g x
x ,
eff ⎟⎟− ∂
⎠ ⎞ ⎜⎜
⎝
⎛ + ∂
− ∂
= ∫ ξ
ξ π
where Bg is a coefficient taking into account the weight of grains and the friction between them (it is different from B, from which comes turbulent terms and accounts for the fluid friction). Equation (10) can be written as
⎟⎟ ⎠ ⎞ ⎜⎜ ⎝ ⎛ + ∂ − ∂
= ∫ d B h
x h A
ˆ x e x
x ,
eff π ξ ξ
τ 1 (11)
where Be = B – Bg/A. The order of magnitude of Bg is 0.1 (Charru, 2006).
Mass Conservation
The two-dimensional mass conservation of grains is
0
= ∂ +
∂th xq (12)
This equation, known as Exner equation, links the height of the bed to the flow rate of grains.
Normal Modes and Solution
Given the small character of perturbations, the solutions of the preceding equations are plane waves. The bed height h and the flow rate of grains q can be decomposed in their normal modes
ikx t i t e H ) t , x (
h = σ− ω+ (13)
ikx t i t sat e Q Q ) t , x (
q =1+ σ−ω + (14)
where is the growth rate and ω is the frequency. Inserting Eqs. (13) and (14) into Eqs. (7), (8), (11) and (12), a 2 equation system is obtained
(
σ−iω)
H+ikQQsat =0 (15)(
+ikLsat)
Q=(
Ak+iBek)
H2 3
1 (16)
The growth rate and the frequency ω of initial instabilities are obtained from the non-trivial solution of the system of Eqs. (15) and (16)
(
)
(
)
(
2)
2 1 2 3 sat sat e sat kL L k A B k Q + − =
σ (17)
(
)
(
)
(
1 2)
2 3 sat sat e sat kL L k B A k k Q + + =
ω (18)
and the phase velocity c=ω/k of initial instabilities is
(
)
(
)
(
2)
1 2 3 sat sat e sat kL L k B A k Q c + +
= (19)
The most unstable (or amplified) mode is the one for which instabilities grow faster, corresponding to =0
∂ ∂
k
σ . From Eq. (17)
(
)
(
)
[
2 3]
03Qsat Bek−ALsatkk + kLsat 2 = (20)
and, neglecting
(
)
2sat
kL (its order of magnitude is 0.1, as shown in
Figs. 2, 3 and 4)
sat e max L A B k 1 3 2
≈ (21)
With the wave-number of the most unstable mode kmax, and noting that the orders of magnitude of A and B are respectively 1 and 0.1, the wavelength max, the growth rate max and the phase velocity cmax can be obtained for this mode:
sat e max L B A 2 3 ≈
λ (22)
(
)
22 3 1 2 9 2 sat sat max L Q A A B − ≈
σ (23)
sat sat max L Q A B
c ≈ 1 (24)
Results From the Stability Analysis
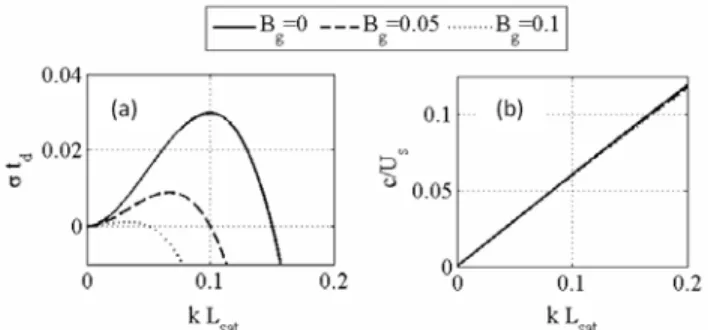
Solutions of equations (17) and (19) can be computed with the known values of coefficients A and B. The values of Bg, d and u* are directly linked to gravity effects, relaxation effects (considering Eq. (9)) and fluid flow, so that they will be used here as parameters to be varied. The variation of these parameters is able to show the influence of the three physical mechanisms on the wavelength, growth rate and celerity of the initial instabilities.
Examples of such solutions can be seen in Figs. 2, 3 and 4, using typical values of A = 4, B = 0.6 (typical for bed-forms under water, Franklin (2008)). The typical settling velocity of a grain US and the typical settling time td = d/USare used in dimensionless variables. 2 1 1 3 4 ⎥ ⎥ ⎦ ⎤ ⎢ ⎢ ⎣ ⎡ ⎟⎟ ⎠ ⎞ ⎜⎜ ⎝ ⎛ − = ρ ρ ρp D S gd C U (25)
The value of the drag coefficient CD depends on the level of free stream turbulence and on the turbulence generated by the particle itself. In the case of a turbulent free stream, Raudkivi (1976) suggests the use of the classical Schiller-Neuman correlation (valid for ReS= USd/ < 80)
(
1 0150 0687)
24 .
S S
D Re . Re
C = + (26)
For grains with d ≈ 0.25 mm and ρp ≈ 2500 kg/m 3
(corresponding to usual sand), Eqs. (25) and (26) show that the order of magnitude of US is 0.01 m/s.
Figures 2, 3 and 4 show the dimensionless growth rate td and the dimensionless phase velocity c/US of the initial perturbations versus the dimensionless wave-number kLsat. In these three figures, the continuous curves correspond to a baseline, where d = 1 mm and Bg = 0 (no gravity effect), and the dashed and dotted curves correspond to variations in the shear velocity u* (fluid flow effects), in grains diameter d (corresponding to the relaxation effects) and in the Bg coefficient (gravity effects), in Figs. 2, 3 and 4 respectively.
they show a preferential growth rate, allowing the prediction of the most unstable wavelength.
Figure 2 shows the effects of varying friction velocity u*, the dashed curves corresponding to values of u* equal to half of the values used in the continuous curves. Because USand d are the same in both cases, the saturation length varies as Lsat ~ u* , which means that in the dashed curve Lsatis half of the value for the continuous curve. For the most unstable mode, Fig. 2 shows that a decrease in u* by a factor 2 implies a decrease in the wavelength maxand in the growth rate max by a factor 2, and a decrease in the phase velocity cmax by a factor 4.
Figure 2. Dimensionless growth rate σtd and dimensionless phase velocity
c/US of the initial instabilities versus the dimensionless wave-number
kLsat, in the case of fluid flow variation.
Those variations can be obtained from the simplified Eqs. (22), (23) and (24). As Lsat ~u* and Qsat~u*3 (Eq. (5)), one finds
* max~u
λ , σmax~u*, cmax~u*2. The scaling λmax~u* is a consequence of the saturated length inserted in the model:
d max~L
λ . So, differently from previous stability analysis for turbulent regime, it is proposed here that the wavelength of the most unstable mode varies with the fluid flow as τ0−12. The scaling
2
* max~u
c agrees with the Bagnold (1941) expression for a dune displacement:
dune sat
dune Q h
c = (27)
where
c
duneis the displacement velocity of a dune and hdune is the dune height. With qsat given by Eq. (5), Qsat~u*3 and, asH~Lsat, one obtains 2* dune~u
c , just as obtained for cmax. The growth rate of the most unstable mode varies as σmax~u*, as it should be expected from the physics of the problem. The shear stress caused by the fluid flow is the unstable mechanism, so the growth rate shall scale with the shear velocity divided by a typical length.
Figure 3 shows the effects of varying the grains diameter, dashed curves corresponding to values of grains diameter d equal to half of the values used in the continuous curves. This implies a variation of the saturation length Lsat with fixed fluid flow conditions. In order to simplify the analysis of the diagrams, the settling time tdand the settling velocity US were kept constant. As the fluid flow is the same in the two cases, the saturation length varies as Lsat~ d, so in the dashed curve Lsatis half of the value for the continuous curve. The variation Lsat ~ d, without changing the fluid flow conditions, can be seen as an isolation of the relaxation effects.
Figure 3. Dimensionless growth rate σtd and dimensionless phase velocity
c/US of the initial instabilities versus the dimensionless wave-number
kLsat, in the case of variation of grains diameter.
For the most unstable mode, Fig. 3 shows that a decrease in d by a factor 2 decreases the wavelength max by a factor 2. Also, there is an increase in the growth rate max by a factor 4 and an increase in the phase velocity cmaxby a factor 2. As in the case of the fluid flow, those variations can be obtained from the simplified Eqs. (22), (23) and (24). As Lsat ~ d (Eq. (9)), one finds λmax~d, σmax~d−2,
1
−
d ~
cmax . Thus, the relaxation effects, present here in terms of
grains diameter, have a stabilizing effect. In special, they stabilize the small waves and decrease the growth rate as σmax~Lsat−2. The
scaling −1
sat max~L
c is a consequence of the Bagnold equation (Eq. (5)).
Figure 4 shows the effects of varying the coefficient Bg, the dashed curves corresponding to Bg = 0.05 and the dotted curves corresponding to Bg= 0.1. In this case, as the fluid flow and the grains diameter are kept constant, the saturation length Lsat is the same for all the three cases.
Figure 4. Dimensionless growth rate σtd and dimensionless phase velocity
c/US of the initial instabilities versus the dimensionless wave-number
kLsat, in the case of variations of Bg.
As seen in the preceding section, gravity effects were included in the perturbation of the shear stress, given by Eq. (11), via the coefficient Bg. This equation shows that gravity effects will be pronounced wherever the coefficient Bg of the anti-symmetric term varies strongly. This is the case for the growth rate: 3
g max~−B
σ , as
can be seen from Eq. (23). Although gravity tends to stabilize small waves, Fig. 4 shows that its effects are much smaller than the relaxation and fluid flow ones. Gravity effects are mainly related to a strong decrease (as a power of 3 of Bg) in the growth rate.
Valance and Langlois (2005) obtained similar results, but for laminar shear flows. They found that the length-scale of the bed-forms is given mainly by the relaxation effects if particle Reynolds number is relatively large (
νμ τ
2
d
Rep= > 100), having the gravity
with experiences showing that turbulence arises locally for Rep around 5 (Bagnold, 1941) .
In summary, the stability analysis showed the existence of long-wave instability, with the fluid flow conditions, the relaxation effects and the gravity effects playing an important role. It seems that the saturation length-scale Lsat, related to the relaxation effects, is the major responsible for the stabilization of small waves. It also plays a role in the growth rate, which varies as
2
−
sat max~L
σ . On the other hand, gravity seems to play a smaller role in the stabilization of the small waves, but it strongly affects the growth rate. Changes in the fluid flow cause variations in the growth rate proportional to the shear velocity: σmax~u*. Concerning the
wavelength of the most unstable mode, it scales with the fluid flow as λmax~u*. This is a result different from previous stability analysis for turbulent regime, where the wavelength of the most unstable mode was found to be unaffected by the fluid flow conditions.
Comparison to Experimental Data
Due to the technical difficulties in granular instability experiments, experimental uncertainties are very complex to be estimated and are not presented here. Instead, error-bars are presented whenever it is possible, corresponding to measurement deviations.
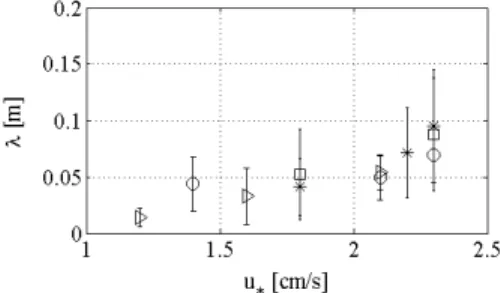
Kuru et al. (1995) presented a theoretical and experimental study of the initial instabilities on a granular bed on a horizontal pipe flow, which is a case without free-surface effects. Their experimental test section was a 31,1 mm diameter pipe, 7m long, and they employed a mixture of water and glycerin as the fluid media and glass beads as the granular media. More details can be found in Kuru et al. (1995). The theoretical work consisted of a linear stability analysis of a clear-layer (a layer containing only fluid) and a suspension-layer concurrent two-phase flow. They did not consider bed-load in their model, although the grains used and the fluid flow conditions are clearly in the bed-load range. They found that instabilities appear because the shear stresses caused by the clear-layer on the interface with the suspension-layer are shifted upstream to undulations on this interface. The wavelength found in their stability analysis overpredicts the experimental measurements, probably because they neglected bed-load transport and its relaxation effects.
Figure 5. Mean wavelength λ of the initial instabilities versus the fluid shear velocity. Circles, asterisks, triangles and squares correspond to d = 0,3 mm and µ = 1 cP, d = 0,3 mm and µ = 2.2 cP, d = 0,1 mm and µ = 1 cP and d = 0,1 mm and µ = 2.1 cP, respectively. Error-bars correspond to deviations from the average value. Figure plotted with the data found in Kuru et al. (1995).
Their experimental results (performed mainly in turbulent regime) show that the initial wavelength scales with the flow rate of the carrier fluid (which indicates that the relaxation length is
not of inertial nature in the case of liquids), as can be seen in Fig. 5. Their linear stability analysis was not able to explain the experimental results.
Coleman et al. (2003) experimentally studied the granular bed instabilities in a closed-conduit turbulent liquid flow (without free-surface effects). Their experimental test section was a 6 m long horizontal closed-conduit of rectangular cross-section (300 mm wide by 100 mm high), and they employed water as the fluid media and glass beads as the granular media. The fluid flow was in the range 26000 < Re < 70000 (
ν
UH
=
Re , H is the channel height). More
details can be found in Coleman et al. (2003). They found that the initial instabilities have a well defined wavelength, which scales with the grains diameters but not with the fluid flow. They proposed the following expression for the initial wavelength (most unstable mode)
75 0
175 ,
max= d
λ (28)
In Eq. (28), there is no correlation between max and the fluid flow, which indicates that the relaxation length would be of inertial nature. However, it should be noted that this equation has a dimensional inconsistency, max being proportional to a diameter at a power 0,75 (so that the numerical constant has a dimension). It is then difficult to imagine Eq. (28) as a universal relation.
Franklin (2008) experimentally studied the initial instabilities on different granular beds under turbulent water flows. His experimental test section was a 6 m long horizontal closed-conduit of rectangular cross-section (120 mm wide by 60 mm high), made of transparent material. He employed water as the fluid media and glass and zirconium beads as the granular media. The fluid flow, in the range 13000 < Re < 24000, was measured by PIV (Particle Image Velocimetry), and the granular bed evolution was measured by a high definition camera. More details can be found in Franklin and Charru (2007), Franklin (2008) and Franklin and Charru (2009). Franklin’s (2008) measurements showed that the initial bed-forms are two-dimensional, as predicted by the Squire’s Theorem. After the initial two-dimensional phase, bed-forms evolve to three-dimensional forms, as seen in Fig. 6.
Figure 6. Evolution of the wavelength λ of initial ripples on a granular bed sheared by a turbulent water flow (top view). Flow direction is from right to left, Re = 19900 and the granular bed is composed of zirconium beads with d = 180 µm. Figure extracted from Franklin (2008).
Figure 7. (a) Mean wavelength λ of the initial ripples as a function of grains diameter d. Symbols and error-bars correspond to experimental data and the line corresponds to Eq. (28). (b) Non-dimensional mean wavelength λ/d of initial ripples as a function of u*. The lozenge, circle, square and asterisk
symbols correspond d=0.12mm, d = 0.20 mm and d = 0.50 mm glass beads and to d = 0.19 mm zirconium beads, respectively. The line corresponds to a linear fit of the mean values. Figure plotted with the data from Franklin (2008).
Figure 7(b) presents the initial wavelengths normalized by the grains diameter /d as a function of the water flow shear velocity u*
.
This figure shows an increase of with the shear velocity, which indicates that the liquid flow conditions shall be taken into account: the deposition length Ld seems to be the correct length-scale.From Figs. 5 and 7, the wavelength of the initial two-dimensional ripples seems to vary with the liquid flow conditions, just as predicted by the stability analysis.
Conclusions
The transport of solid particles entrained by a fluid flow is frequent in nature and in industry. Under some fluid flow conditions, a mobile granular layer known as bed-load takes place, in which the grains stay in contact with the fixed part of the granular bed. In some situations, an initially flat granular bed may become unstable, giving rise to ripples or dunes. The formation of dunes in deserts and in petroleum pipelines conveying sand are some examples. A better knowledge of the instabilities on a granular bed and of their evolution is of great importance to understand nature.
This paper presented a theoretical investigation of the initial instabilities on granular beds sheared by turbulent liquid flows, without free-surface effects, such as those in which the liquid depth is many times greater than the typical height of the bed-forms, or flows in pipes and closed-conduits. The work consisted of a linear stability analysis of the problem, taking into consideration the fluid flow perturbation, the relaxation effects related to the flow rate of grains and the effects of gravity.
The stability analysis showed the existence of long-wave instability, whose behavior is influenced by fluid flow conditions, relaxation effects and gravity effects. The saturation length-scale Lsat, related to relaxation effects, seems to be the major responsible for the stabilization of small waves. It also affects the growth rate as
2
−
sat max~L
σ . On the other hand, gravity seems to play a smaller role in the stabilization of the small waves, but it strongly affects the growth rate. The fluid flow was found to affect the growth rate as
* max~u
σ and the celerity as cmax~u*2. It was also found to affect the wavelength, for which the following scaling is proposed:
* max~u
λ . This scaling is a result different from previous stability analysis for turbulent regime.
The results from the stability analysis were compared to some published experimental data concerning initial ripples in closed-conduit flows, for liquids in turbulent regime. The works of Kuru et al. (1995) and Franklin (2008) showed that the wavelength of the initial ripples vary with the liquid flow conditions. These results agree with the stability analysis presented here.
In summary, differently from previous stability analysis for turbulent regime, it is proposed here that the initial wavelength varies with the flow conditions of the carrier liquid. This explains, for the first time, some previous experimental results.
Acknowledgements
The author is grateful to Petrobras for the financial support to write this article (contract number 0050.0045763.08.4).
References
Andreotti, B., Claudin, P. and Douady, S., 2002, “Selection of dune shapes and Velocities. part 2: A two-dimensional model”, Eur. Phys. J. B, Vol. 28, pp. 341-352.
Bagnold, R.A., 1941, “The physics of blown sand and desert dunes”, Ed. Chapman and Hall, London, United Kingdom, 320 p.
Charru, F., Mouilleron-Arnould, H. and Eiff, O., 2004, “Erosion and deposition of particles on a bed sheared by a viscous flow”, J. Fluid Mech., Vol. 519 pp. 55-80.
Charru, F., 2006, “Selection of the ripple length on a granular bed sheared by a liquid flow”, Physics of Fluids, Vol. 18 (121508).
Claudin, P. and Andreotti, B., 2006, “A scaling law for aeolian dunes on Mars, Venus, Earth, and for subaqueous ripples”, Earth Plan. Sci. Lett., Vol. 252, pp. 20-44.
Coleman, S., Fedele, J. and Garcia, M.H., 2003, “Closed-conduit bed-form initiation and development”, J. Hydraul. Eng., Vol. 129, No. 12, pp. 956-965.
Drazin, P.G. and Reid, W.R., 2004, “Hydrodynamic stability”, Ed. Cambridge University Press, Cambridge, United Kingdom, 605 p.
Duran, J., 1999, “Sands, powders and grains: an introduction to the physics of granular materials”, Ed. Springer, New York, United States of America, 232 p.
Elbelrhiti, H., Claudin, P. and Andreotti, B., 2005, “Field evidence for surface-waveinduced instability of sand dunes”, Nature, Vol. 437 (04058).
Engelund, F., 1970, “Instability of erodible beds”, J. Fluid Mech., Vol. 42, pp. 225-244.
Engelund, F. and Fredsoe, J., 1982, “Sediment ripples and dunes”, Ann. Rev. Fluid Mech., Vol. 14, pp. 13-37.
Franklin, E.M. and Charru, F., 2007, “Dune migration in a closed-conduit flow”, Proceedings of the 6th International Conference on Multiphase
Flow, Leipzig, Germany.
Franklin, E.M., 2008, “Dynamique de dunes isolées dans un écoulement cisaillé”, (in French), Ph.D. Thesis, Université de Toulouse, Toulouse, France, 166 p.
Franklin, E.M. and Charru, F., 2009, “Morphology and displacement of dunes in a closed-conduit flow”, Powder Technology, Vol. 190, pp. 247-251. Hersen, P., Douady, S. and Andreotti, B., 2002, “Relevant length scale of barchan dunes”, Phys. Rev. Lett., Vol. 89 (264301).
Hunt, J. C. R., Leibovich, S. and Richards, K., 1988, “Turbulent shear flows over low Hills”, Quart. J. R. Met. Soc., Vol. 114, pp. 1435 - 1470.
Jackson, P.S. and Hunt, J. C. R., 1975, “Turbulent wind flow over a low hill”, Quart. J. R. Met. Soc., Vol. 101, pp. 929-955.
Kennedy, J.F., 1963, “The mechanics of dunes and antidunes in erodible-bed channels”, J. Fluid Mech., Vol. 16, pp. 521-544.
Kouakou, K. and Lagrée, P., 2005, “Stability of an erodible bed in various shear flows”, Eur. Phys. J. B, Vol. 47, pp. 115-125.
Kroy, K., Sauermann, G. and Herrmann, H.J., 2002, “Minimal model for aeolian sand dunes”, Phys. Rev. E, Vol. 66 (031302).
Parteli, E., Duran, O. and Herrmann, H.J., 2007, “Minimal size of a barchan dune”, Phys. Rev. E, Vol. 75 (011301).
Raudkivi, A.J., 1976, “Loose boundary hydraulics”, Ed. Pergamon, Oxford, United Kingdom, 397 p.
Richards, K.J., 1980, “The formation of ripples and dunes on an erodible bed”, J. Fluid Mech., Vol. 99, pp. 597-618.
Sauermann, G., 2001, “Modeling of wind blown sand and desert dunes”, Ph.D. Thesis, Universitat Stuttgart, Stuttgart, Germany, 179 p.
Sauermann, G., Kroy, K. and Herrmann, H.J., 2001, “Continuum saltation model for sand dunes”, Phys. Rev. E, Vol. 64 (031305).
Sauermann, G, Andrade, J. Maia, L., Costa, U., Araujo, A. and Herrmann, H., 2003, “Wind velocity and sand transport on a barchan dune”, Geomorphology, Vol. 54, pp. 245-255.
Valance, A. and Langlois, V., 2005, “Ripple formation over a sand bed submitted to a laminar shear flow”, Eur. Phys. J. B, Vol. 43, pp. 283-294.