BGD
10, 1635–1683, 2013Insights into mechanisms governing C and N
interactions
R. Q. Thomas et al.
Title Page
Abstract Introduction
Conclusions References
Tables Figures
◭ ◮
◭ ◮
Back Close
Full Screen / Esc
Printer-friendly Version Interactive Discussion
Discussion
P
a
per
|
Dis
cussion
P
a
per
|
Discussion
P
a
per
|
Discussio
n
P
a
per
|
Biogeosciences Discuss., 10, 1635–1683, 2013 www.biogeosciences-discuss.net/10/1635/2013/ doi:10.5194/bgd-10-1635-2013
© Author(s) 2013. CC Attribution 3.0 License.
Open Access
Biogeosciences
Discussions
Geoscientiic Geoscientiic
Geoscientiic Geoscientiic
This discussion paper is/has been under review for the journal Biogeosciences (BG). Please refer to the corresponding final paper in BG if available.
Insights into mechanisms governing
forest carbon response to nitrogen
deposition: a model-data comparison
using observed responses to nitrogen
addition
R. Q. Thomas1,2, G. B. Bonan2, and C. L. Goodale1
1
Department of Ecology and Evolutionary Biology, Cornell University, Ithaca, NY, USA
2
National Center for Atmospheric Research, Boulder, CO, USA
Received: 11 January 2013 – Accepted: 14 January 2013 – Published: 31 January 2013
Correspondence to: R. Q. Thomas ([email protected])
BGD
10, 1635–1683, 2013Insights into mechanisms governing C and N
interactions
R. Q. Thomas et al.
Title Page
Abstract Introduction
Conclusions References
Tables Figures
◭ ◮
◭ ◮
Back Close
Full Screen / Esc
Printer-friendly Version Interactive Discussion
Discussion
P
a
per
|
Dis
cussion
P
a
per
|
Discussion
P
a
per
|
Discussio
n
P
a
per
|
Abstract
In many forest ecosystems, nitrogen (N) deposition enhances plant uptake of carbon dioxide, thus reducing climate warming from fossil fuel emissions. Therefore, accurately modeling how forest carbon (C) sequestration responds to N deposition is critical for understanding how future changes in N availability will influence climate. Here, we use
5
observations of forest C response to N inputs along N deposition gradients and at five temperate forest sites with fertilization experiments to test and improve a global biogeo-chemical model (CLM-CN 4.0). We show that the CLM-CN plant C growth response to N deposition was smaller than observed and the modeled response to N fertiliza-tion was larger than observed. A set of modificafertiliza-tions to the CLM-CN improved the
10
correspondence between model predictions and observational data (1) by increasing the aboveground C storage in response to historical N deposition (1850–2004) from 14 to 34 kg C per additional kg N added through deposition and (2) by decreasing the aboveground net primary productivity response to N fertilization experiments from 91 to 57 g C m−2yr−1. Modeled growth response to N deposition was most sensitive to
15
altering the processes that control plant N uptake and the pathways of N loss. The re-sponse to N deposition also increased with a more closed N cycle (reduced N fixation and N gas loss) and decreased when prioritizing microbial over plant uptake of soil inorganic N. The net effect of all the modifications to the CLM-CN resulted in greater retention of N deposition and a greater role of synergy between N deposition and rising
20
atmospheric CO2 as a mechanism governing increases in temperate forest primary
production over the 20th century. Overall, testing models with both the response to gradual increases in N inputs over decades (N deposition) and N pulse additions of N over multiple years (N fertilization) allows for greater understanding of the mechanisms governing C-N coupling.
BGD
10, 1635–1683, 2013Insights into mechanisms governing C and N
interactions
R. Q. Thomas et al.
Title Page
Abstract Introduction
Conclusions References
Tables Figures
◭ ◮
◭ ◮
Back Close
Full Screen / Esc
Printer-friendly Version Interactive Discussion
Discussion
P
a
per
|
Dis
cussion
P
a
per
|
Discussion
P
a
per
|
Discussio
n
P
a
per
|
1 Introduction
Reactive nitrogen (N) from fossil fuel combustion and agricultural activities influences global climate by altering atmospheric chemistry, aerosols, and greenhouse gas con-centrations (Butterbach-Bahl et al., 2011; Pinder et al., 2012). However, the direction of the climate impact of reactive N primarily depends on the balance of opposing
pro-5
cesses: positive radiative forcing from emissions of N2O, a greenhouse gas, and
neg-ative radineg-ative forcing from altered atmospheric chemistry and carbon dioxide (CO2) storage in N-fertilized forests (Arneth et al., 2010; Pinder et al., 2012). Reactive N de-posited on forest ecosystems can increase primary production if the forest is N-limited (Nadelhoffer et al., 1999; Magnani et al., 2007; Thomas et al., 2010), which results
10
in less CO2 in the atmosphere and consequently reduced climate warming. Recent
estimates show that this CO2 uptake broadly offsets warming from N2O emissions,
in-dicating that the N-induced forest sink of CO2 has an important role in global climate (Zaehle et al., 2011; Butterbach-Bahl et al., 2011; Pinder et al., 2012).
Accurately predicting how carbon (C) storage in forest ecosystems will respond to
15
the changing deposition of reactive N is critical for developing climate change targets for reducing emissions and air pollution. Global biogeochemical models coupled to climate and atmospheric chemistry models are powerful tools for exploring this carbon-nitrogen-climate interface (Sokolov et al., 2008; Thornton et al., 2009; Yang et al., 2009; Zaehle and Friend, 2010), but it is paramount to build confidence in predictions of how
20
C uptake and storage respond to changing N inputs.
Fortunately, a variety of observational and experimental data are available to test and improve the sensitivity of global biogeochemical models to changes in N depo-sition and the resulting C sequestration. Studies have generally shown that elevated N inputs often increase plant growth and soil C sequestration (Magnani et al., 2007;
25
BGD
10, 1635–1683, 2013Insights into mechanisms governing C and N
interactions
R. Q. Thomas et al.
Title Page
Abstract Introduction
Conclusions References
Tables Figures
◭ ◮
◭ ◮
Back Close
Full Screen / Esc
Printer-friendly Version Interactive Discussion
Discussion
P
a
per
|
Dis
cussion
P
a
per
|
Discussion
P
a
per
|
Discussio
n
P
a
per
|
et al., 2007). The current range of estimates quantifying the additional C sequestered per unit of N added (kg C per kg N; or dC/dN) is broad, in part due to the myriad of approaches used to quantify dC/dN. These approaches include N fertilization studies (Hyvonen et al., 2008; Liu and Greaver, 2009), where large inputs of N are added to forests over short time scales, and N deposition gradient studies (Magnani et al., 2007;
5
de Vries et al., 2009; Thomas et al., 2010), where spatial variation in N deposition and forest growth are used to estimate the impact of gradual increases N deposition on C storage over multiple decades. Furthermore, there can be variation among studies in the C pools being measured, as some studies calculate the dC/dN of aboveground stem C (de Vries et al., 2009; Thomas et al., 2010), soil organic matter (Janssens et al.,
10
2010), or net ecosystem production (NEP; Magnani et al., 2007; Sutton et al., 2008). Finally, the observations span regions with very different historical N deposition loads (i.e. the US compared to Western Europe). Successfully using the available data to test and improve global biogeochemical models requires directly accounting for the varia-tion in magnitude and time-scale of N addivaria-tions in the observavaria-tional and experimental
15
data.
Many different approaches have been used to model key processes influencing C and N cycle interactions in terrestrial ecosystems (Zaehle and Dalmonech, 2011). For example, N fixation has been modeled as a function of net primary production (NPP) (Thornton et al., 2007), evapotranspiration (Yang et al., 2009, Zaehle and Friend, 2010)
20
or N demand (Gerber et al., 2010). Similarly, N uptake has been represented as a direct function of photosynthesis and C : N stoichiometric constraints on building plant tissue (Thornton et al., 2002, 2007) or based on allocation of C to plant roots (Gerber et al., 2010; Zaehle and Friend, 2010). Soil and plant buffering of the C cycle to daily to annual changes in N availability also differs among models (Gerber et al., 2010; Zaehle and
25
BGD
10, 1635–1683, 2013Insights into mechanisms governing C and N
interactions
R. Q. Thomas et al.
Title Page
Abstract Introduction
Conclusions References
Tables Figures
◭ ◮
◭ ◮
Back Close
Full Screen / Esc
Printer-friendly Version Interactive Discussion
Discussion
P
a
per
|
Dis
cussion
P
a
per
|
Discussion
P
a
per
|
Discussio
n
P
a
per
|
how the different model structures or parameterizations influence the prediction of how ecosystems respond to N deposition requires isolating key processes that govern C and N interactions. Unfortunately, inter-model comparisons can be limited by broad differences in model structure that make it difficult to isolate particular processes that differ among models. One approach to this problem is to compare different
represen-5
tations of particular C and N cycle processes within the same general model, thereby obtaining a better understanding of which processes influence predictions of how ter-restrial C storage and climate respond to changing N availability.
Here, we explored the influence of alternative approaches to modeling C and N inter-actions on the sensitivity of C storage to N inputs in temperate forest ecosystems. To
10
isolate the alternative approaches, we implemented multiple alternative assumptions about C and N cycling within a single global biogeochemical land surface model (CLM-CN 4.0). We focused on five key assumptions about the N cycle in the CLM-(CLM-CN 4.0: (1) the extent to which the N cycle is open, based on N fixation inputs and N losses relative to internal N cycling, (2) the buffering of the soil inorganic N pool and plant
15
N pool, (3) the representation of plant N uptake, (4) the pathways of N loss, and (5) the canopy scaling of photosynthesis. These alternative assumptions are combined to create a modified version of the CLM-CN 4.0 that is compared to observed ecosystem response to experimental N fertilization and to elevated N inputs across N deposition gradients.
20
2 Methods
2.1 Baseline model description
We used the CLM-CN 4.0 as the baseline model (Lawrence et al., 2011, 2012). The CLM-CN 4.0 is the global land surface model in the Community Earth System Model (Gent et al., 2011) and includes both terrestrial biogeophysical and biogeochemical
25
BGD
10, 1635–1683, 2013Insights into mechanisms governing C and N
interactions
R. Q. Thomas et al.
Title Page
Abstract Introduction
Conclusions References
Tables Figures
◭ ◮
◭ ◮
Back Close
Full Screen / Esc
Printer-friendly Version Interactive Discussion
Discussion
P
a
per
|
Dis
cussion
P
a
per
|
Discussion
P
a
per
|
Discussio
n
P
a
per
|
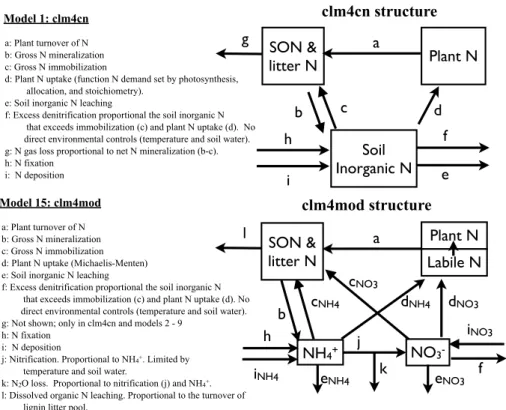
components of the CLM-CN but we focus our model evaluation and improvement on the biogeochemical component (hereafter, referred to as the “clm4cn” model). A de-scription of the key processes that relate to new model modifications are described be-low, while a more thorough description of the biogeochemical component can be found elsewhere (Thornton et al., 2002, 2007, 2009; Thornton and Rosenbloom, 2005).
5
In the clm4cn model, the C and N cycles are coupled through litter and soil organic matter decomposition and through plant dynamics. The primary C and N coupling oc-curs on the 30-min time scale, as plants compete for N with microbial immobilization into soil organic matter, where N comes from a generic soil inorganic N pool (i.e. NH+4 and NO−3 are combined). Plant N demand is based on the N needed to match the
10
demand set by non-N limited photosynthesis and plant tissue C : N stoichiometric con-straints. If the combined N demand exceeds the available N, plant uptake and microbial immobilization are reduced in proportion to the available N and their relative demands. Sources of new N into the clm4cn model include N fixation and N deposition. N losses include denitrification, leaching, fire, and harvest. N fixation is a saturating function of
15
NPP derived from Cleveland et al. (1999). Fixation and deposition are both directly added to the soil inorganic N pool. The clm4cn model includes both denitrification and leaching processes; however, the vast majority of N is lost as N gas in most ecosystems in the model (Table A2). Therefore, the two loss pathways for N gases in the clm4cn model are very important: (1) a constant 1 % of net mineralization is lost as N gas and
20
(2) the soil inorganic N that exceeds plant uptake and immobilization is denitrified at a rate of 50 % per day.
2.2 Modified model description
The overall model modifications (referred to as “clm4mod”) build on recent improve-ments to the calculations of canopy photosynthesis in the clm4cn (Bonan et al., 2011,
25
BGD
10, 1635–1683, 2013Insights into mechanisms governing C and N
interactions
R. Q. Thomas et al.
Title Page
Abstract Introduction
Conclusions References
Tables Figures
◭ ◮
◭ ◮
Back Close
Full Screen / Esc
Printer-friendly Version Interactive Discussion
Discussion
P
a
per
|
Dis
cussion
P
a
per
|
Discussion
P
a
per
|
Discussio
n
P
a
per
|
models, specially models that have alternative approaches to modeling N uptake (O-CN: Zaehle and Friend, 2010; LM3V: Gerber et al., 2010), buffering of plant and soil N availability (O-CN: Zaehle and Friend, 2010; LM3V: Gerber et al., 2010) and less N fixation in temperate and boreal forests than the clm4cn (LM3V; Gerber et al., 2010). An overview of the modifications is found below while a full description is found in the
5
Appendix A.
2.2.1 Internal N cycling
Plant N uptake in the clm4mod model is based on Michaelis-Menten kinetics, where the rate of N uptake depends on a maximum uptake rate per gram of fine root C, as well as the concentration of soil inorganic N in separate NH+4 and NO−3 pools (see
Ap-10
pendix A for detailed information). Plant uptake increases with soil temperature and as the internal plant pool of N decreases relative to a maximum internal pool. The formulation of N uptake is similar to that used in other global biogeochemical models (Gerber et al., 2010; Zaehle and Friend, 2010) and differs from the clm4cn by allowing the N uptake to be decoupled from photosynthesis at short time scales (i.e. seconds to
15
days); longer term N uptake (i.e. at days to years) remains ultimately coupled to photo-synthesis. The maximum internal plant N pool is equal to one year of live plant tissue N turnover (Gerber et al., 2010). In the clm4mod model, the maximum uptake rate is assumed to be equal for NH+4 and NO−3, as implemented in other models (Gerber et al., 2010; Zaehle and Friend, 2010). N uptake occurs any time during the growing season
20
(i.e. when leaves are present on the plant), rather than only during the day within the growing season, as implemented in the clm4cn model. Plant uptake is assumed to be less competitive for N than soil immobilization of N, in that plant uptake occurs after soil microbial immobilization demands are met; in the clm4cn, neither plant uptake nor soil immobilization of N had first access to soil inorganic N, rather they compete based on
25
BGD
10, 1635–1683, 2013Insights into mechanisms governing C and N
interactions
R. Q. Thomas et al.
Title Page
Abstract Introduction
Conclusions References
Tables Figures
◭ ◮
◭ ◮
Back Close
Full Screen / Esc
Printer-friendly Version Interactive Discussion
Discussion
P
a
per
|
Dis
cussion
P
a
per
|
Discussion
P
a
per
|
Discussio
n
P
a
per
|
available for combining with new photosynthate to build plant tissue. The 2 % buffering capacity leads to approximately a two-day turnover time of labile plant N. The clm4cn does not include buffering of labile plant N.
2.2.2 N losses
The clm4mod model introduces a nitrification algorithm, an alternative denitrification
5
algorithm, and a simple algorithm describing the production and hydrologic loss of dissolved organic matter, including dissolved organic N (DON). Nitrification is a func-tion of soil NH+4, soil temperature, soil water, and net mineralization based on Parton et al. (2001) with 2 % of nitrification lost as N2O (Parton et al., 2001). Denitrification is an function of soil NO−3, soil water, and soil heterotrophic activity based on Bradbury
10
et al. (Appendix A5; Bradbury et al., 1993; Yang et al., 2009). To buffer the availability of soil inorganic N and approximate short-term cation exchange processes, 10 % of total soil NH+4 is available for immobilization, plant uptake, nitrification, and leaching (Gerber et al., 2010), and, since NO−3 is highly mobile in soils, 100 % of NO−3 is assumed to be available for soil, plant, and loss processes. Dissolved organic matter is produced at
15
a constant proportion (2 %) of the organic matter transfer between the slow litter pool (lignin-based) and its receiving soil organic matter pool (based on Gerber et al., 2010). Both dissolved organic C and N are lost in proportion to hydrologic export, similar to leaching loss of soil inorganic N in the clm4cn model. The clm4cn does not include separate consideration of NH+4 and NO−3 and cycling, nor does it include DOC and
20
DON losses.
2.2.3 N inputs
In clm4mod N fixation is a function of actual evapotranspiration, based on the central re-lationship in the Cleveland et al. (1999) review of N fixation measurements, rather than a function of NPP, as implemented in clm4cn. In addition, symbiotic and non-symbiotic
25
BGD
10, 1635–1683, 2013Insights into mechanisms governing C and N
interactions
R. Q. Thomas et al.
Title Page
Abstract Introduction
Conclusions References
Tables Figures
◭ ◮
◭ ◮
Back Close
Full Screen / Esc
Printer-friendly Version Interactive Discussion
Discussion
P
a
per
|
Dis
cussion
P
a
per
|
Discussion
P
a
per
|
Discussio
n
P
a
per
|
mid- to late-successional temperate and boreal forests (i.e. when leaf area index (LAI)
>1) and non-symbiotic N fixation increases with actual evapotranspiration (Appendix A6). Both sources of fixation are assumed to occur in grasslands and tropical forests. This N fixation routine reduces the overall N inputs to mid- to late-successional extra-tropical forests (see Table A2 for the magnitude of change in N fixation). A pathway for
5
N fertilization was also added to facilitate the simulation of N fertilization experiments. N deposition in the clm4mod was equal to total N deposition in the clm4cn, except N deposition in the clm4mod was divided into NH+4 and NO−3 based on the N deposition input fields described in Lamarque et al. (2005).
2.2.4 Canopy photosynthesis
10
Finally, the clm4mod model includes changes to the canopy scaling of photosynthesis, maximum photosynthetic rates, radiative transfer, leaf photosynthesis, and stomatal conductance as described in Bonan et al. (2011) and (2012). Bonan et al. (2012) in-troduced a multi-layer canopy scaling approach that solved photosynthesis throughout the canopy rather than using a whole canopy approximation. The model updates in
15
Bonan et al. (2011, 2012) decreased GPP and effectively reduced the photosynthetic potential of shaded leaves, but the impact of the changes on C-N interactions has not been investigated. The clm4mod model also includes specific values of maximum pho-tosynthetic rate for each plant functional type from a synthesis of a plant trait database (Kattge et al., 2009), although these values differed only slightly from the values in the
20
clm4cn model for the temperate broadleaf plant type used in this study (clm4cn, 52; clm4mod, 58; µmol m−2s−1).
2.3 Simulations
The clm4cn and clm4mod models were used to simulate forest biogeochemistry at five sites in North American broadleaf temperate deciduous forests. The five sites were
25
BGD
10, 1635–1683, 2013Insights into mechanisms governing C and N
interactions
R. Q. Thomas et al.
Title Page
Abstract Introduction
Conclusions References
Tables Figures
◭ ◮
◭ ◮
Back Close
Full Screen / Esc
Printer-friendly Version Interactive Discussion
Discussion
P
a
per
|
Dis
cussion
P
a
per
|
Discussion
P
a
per
|
Discussio
n
P
a
per
|
years), long-term N fertilization experiments (10+years), and are contained within the geographic boundaries of the analysis of forest inventory data by Thomas et al. (2010), which estimated how forest C storage has responded to N deposition across the north-eastern US (see below). Basic descriptions of the sites are included in Table 1. Four of the five sites were in Michigan, USA, with each site receiving varying atmospheric
5
deposition and a 3 g N m−2yr−1 experimental addition of N over ten years (Pregitzer et al., 2008; 1995–2005). The other site was at Harvard Forest in Massachusetts, USA (Magill et al., 2004) and included two different 14-yr fertilization additions (5 and 15 g N m−2yr−1; 1988–2002). All data used in this study for the five sites and six N fertilization experiments can be found in Magill et al. (2004) and Pregitzer et al. (2008).
10
We simulated ecosystem response to transient N deposition and N fertilization at each of the five sites using the clm4cn and clm4mod models. The simulations involved running each model from 1850 to 2004 at each of the five sites with different combi-nations of forcing data. The baseline simulation used transient N deposition (NHx and NOy; Lamarque et al., 2005), atmospheric CO2, land use (based on stand age at the 15
five sites), and climate. N deposition and atmospheric CO2trends had reconstructions
covering the entire simulation (1850–2004). A 57-yr meteorological dataset was avail-able to force the model (1948–2004; Qian et al., 2006). We created site-level meteoro-logical data by using the corresponding grid cell in the global gridded data (Qian et al., 2006). We used the data from 1948–1972 for the 1850–1972 simulation years, and the
20
1973–2004 meteorological dataset was used for the 1973–2004 simulation years (as in Randerson et al., 2009 and Bonan and Levis 2010). Each simulation needed initial conditions that were attained by running the model to equilibrium using 1850 values for N deposition and atmospheric CO2and the 1948–1972 time-series for meteorological
data. All wildfire was excluded in the spin-up and other simulations due to uncertainties
25
BGD
10, 1635–1683, 2013Insights into mechanisms governing C and N
interactions
R. Q. Thomas et al.
Title Page
Abstract Introduction
Conclusions References
Tables Figures
◭ ◮
◭ ◮
Back Close
Full Screen / Esc
Printer-friendly Version Interactive Discussion
Discussion
P
a
per
|
Dis
cussion
P
a
per
|
Discussion
P
a
per
|
Discussio
n
P
a
per
|
We isolated the influence of transient N deposition on C cycling at each site by re-peating the baseline simulation described above except for holding N deposition con-stant at 1850 values. We also tested whether C cycle sensitivity was different for larger inputs of N deposition than included in the baseline simulation. The high N deposition simulation used a N deposition trajectory from 1850 to 2004 with 1995–2004 mean
de-5
position levels at the five sites of 2.2 g N m−2yr−1 rather than their actual N deposition rates (1995–2004) that ranged from 0.68–1.18 g N m−2yr−1(Table 1).
Because the NPP response to rising atmospheric CO2is constrained by N
availabil-ity, we tested whether the sensitivity of NPP to rising atmospheric CO2 changed as
a result of the modifications to clm4cn. To test this sensitivity we performed two
ad-10
ditional simulations at the five sites using the clm4cn and clm4mod: a simulation that held both N deposition and atmospheric CO2constant at 1850 levels and a simulation
that held CO2constant at 1850 levels but included 1850–2004 N deposition levels.
Finally, we simulated the six N fertilization experiments (Table 1; four sites with one experiment each and one site with two experiments) by adding N fertilization to the
15
baseline simulation to best approximate the field experiments by specifying the start year, duration, magnitude and intra-annual distribution of N application.
2.4 N fertilization and deposition analysis and observations
The model comparison to observations focused on NPP, net ecosystem productivity (NEP), and annual aboveground net C increment (ACI) in plants because these were
20
the variables measured in the N fertilization experiments and across the N deposition gradients. The model response to N fertilization was assessed by comparing mean annual aboveground NPP (ANPP) in the control and N-fertilized simulations to ANPP data from the corresponding control and fertilized treatments in the field data. In both the models and observations, ANPP corresponded to the sum of mean leaf and stem
25
BGD
10, 1635–1683, 2013Insights into mechanisms governing C and N
interactions
R. Q. Thomas et al.
Title Page
Abstract Introduction
Conclusions References
Tables Figures
◭ ◮
◭ ◮
Back Close
Full Screen / Esc
Printer-friendly Version Interactive Discussion
Discussion
P
a
per
|
Dis
cussion
P
a
per
|
Discussion
P
a
per
|
Discussio
n
P
a
per
|
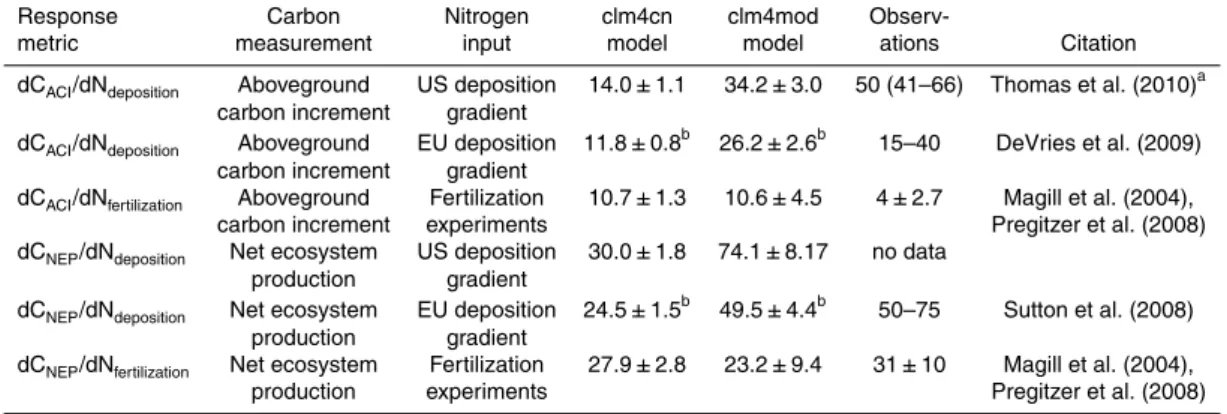
or leaves within a year that are included in NPP measurements. However, ACI includes the losses of C from mortality that are not included in NPP measurements. We report the ACI response to fertilization by dividing by the N added (dCACI/dNfertilization).
We compared the model response to N deposition to observations from the literature. We calculated average ACI between 1994 and 2004 in the simulations with and without
5
transient N deposition (both including transient CO2). The ACI response to N deposition
was expressed as the ACI difference divided by the difference in mean N deposition over the same time period (dCACI/dNdeposition). We also report the difference in NEP
divided by the difference in N deposition (dCNEP/dNdeposition). We compared the above
metrics of N deposition response to the corresponding metrics reported in analyses
10
listed in Table 2.
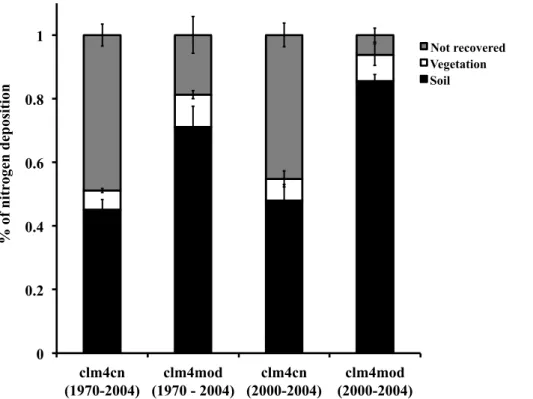
We also assessed the contribution of N retention to the N deposition response in the clm4cn and clm4mod model. The total N deposition retained between 1970 and 2004 and between 2000 and 2004 was calculated to determine the long- and short-term retention of N deposition, respectively. Over each time period, we calculated total
15
deposition retained in the ecosystem and the fate of N deposition into soil organic matter (including litter and coarse woody debris) and vegetation.
In addition, we assessed the relative contribution of CO2 fertilization to how NPP
responds to N deposition for each site using the method developed by Churkina et al. (2009) and Zaehle et al. (2010b). That is, we isolated the pure N deposition
20
(i.e. N deposition enhancement without an interaction with CO2 fertilization), the pure
CO2 fertilization, and the synergistic effect of CO2 fertilization and N deposition on
NPP by calculating the mean NPP (1994–2004) in the simulations with (1) N deposi-tion and atmospheric CO2 at pre-industrial levels, (2) only transient N deposition, (3)
only transient CO2, and (4) both transient N deposition and CO2(i.e. control simulation 25
described above). The pure N deposition response was the difference in NPP between simulations 1 and 2, while the pure CO2 fertilization response was the difference
BGD
10, 1635–1683, 2013Insights into mechanisms governing C and N
interactions
R. Q. Thomas et al.
Title Page
Abstract Introduction
Conclusions References
Tables Figures
◭ ◮
◭ ◮
Back Close
Full Screen / Esc
Printer-friendly Version Interactive Discussion
Discussion
P
a
per
|
Dis
cussion
P
a
per
|
Discussion
P
a
per
|
Discussio
n
P
a
per
|
2.5 Sensitivity analysis to model structure
We explored the sensitivity of the N deposition response (dCACI/dNdeposition) to the
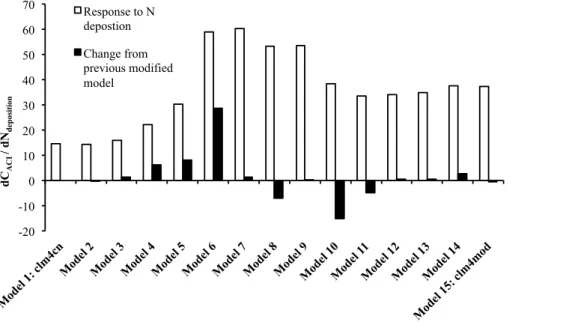
mechanisms and processes that differ between the clm4cn and clm4mod models. We created intermediate models that sequentially step through the 15 model modifications that were included in the shift from the clm4cn to the clm4mod (Table 3; Fig. 3). The
5
sensitivity analysis was sequential in that each intermediate model in Table 3 includes all the modifications in the intermediate models listed above it. To quantify the influence of each process on the N deposition response, we ran simulations with and without transient N deposition using each of the intermediate models at single site (Harvard Forest). The change in dCACI/dNdeposition associated with each modification was used
10
to quantify the sensitivity of N deposition response to assumptions about the structure of the C and N cycles.
In most of the modifications, we were interested in the influence of the model struc-ture on the N deposition response in the absence of altered baseline productivity (the pre-industrial steady-state; see Sect. 2.3). We adjusted the denitrification parameter to
15
maintain the same baseline production so that Model 4 had the same baseline produc-tion as Model 3 and Models 5–14 had the same baseline producproduc-tion as Model 15. To maintain the same baseline production, we altered the proportion excess soil inorganic N (Models 4–10; Table 3) or NO−3 (Models 11–15; Table 3) that is denitrified. A detailed description of the intermediate models can be found in Appendix B.
20
3 Results
3.1 Model response to N fertilization experiments
The clm4mod model better predicted mean ANPP measured at the control plots at the five field sites (i.e. no N additional fertilization added) than the clm4cn model. The mean observed ANPP across the five sites was 464±36 g C m−2yr−1 (1 S.E. across
BGD
10, 1635–1683, 2013Insights into mechanisms governing C and N
interactions
R. Q. Thomas et al.
Title Page
Abstract Introduction
Conclusions References
Tables Figures
◭ ◮
◭ ◮
Back Close
Full Screen / Esc
Printer-friendly Version Interactive Discussion
Discussion
P
a
per
|
Dis
cussion
P
a
per
|
Discussion
P
a
per
|
Discussio
n
P
a
per
|
sites), while the mean in the clm4mod and clm4cn model was 411±28 and 352±
50 g C m−2yr−1(1 S.E.), respectively (Table 4). Both models predicted lower ANPP than observed in the most productive sites (MI-B, MI-C and MI-D; Fig. 1). Neither model was consistently higher or lower than observed ANPP in the two least productive sites (HF and MI-A; Fig. 1a).
5
The clm4mod also better predicted both the mean ANPP in the N fertilized simu-lations and the increase in ANPP over the control simulation than the clm4cn. The fertilized ANPP in the clm4mod model (474±8 g C m−2yr−1) compared better to the
observed fertilized ANPP in the six experiments at the five sites (504±40 g C m−2yr−1) than the clm4cn model (420±41 g C m−2yr−1; Table 4). The mean increase in ANPP in
10
the fertilization experiments was similar between the observations (55±8 g C m−2yr−1)
and the clm4mod (57±18 g C m−2yr−1) with the clm4cn fertilization response 65 % higher (91±19 g C m−2yr−1) than the observed response. On a site-by-site basis, the clm4mod corresponded substantially better to observations from the two N fertilization experiments at Harvard Forest than the clm4cn (Fig. 1c). At the MI-A site, the clm4cn
15
performed better compared to the observations than the clm4mod (Fig. 1c). Both the fertilization responses in the clm4cn and clm4mod models were within the bounds of uncertainty in the observations at MI-B, MI-C, and MI-D (Fig. 1c).
Despite differences in ANPP response to N fertilization, both the clm4cn and clm4mod models predicted similar aboveground C increments per unit N
fer-20
tilizer added (dCACI/dNfertilizer; clm4cn: 10.7±1.3 kg C (kg N) −1
; clm4mod: 10.6±
4.5 kg C (kg N)−1), that was on average 1.5 times larger than the observed dCACI/dNfertilizer (4.0±2.7 kg C (kg N)−1; Table 2). However, the site-to-site variability in
the clm4mod dCACI/dNfertilizerwas larger than the variability in clm4cn, leading to
over-lapping uncertainty with the observations. The mean annual net ecosystem production
25
response to N fertilization (dCNEP/dNfertilizer) across all five sites was 27.9±2.8 and
23.2±9.4 kg C (kg N)−1 for the clm4cn and clm4mod models, respectively (Table 2). The clm4cn compared better to the observed dCNEP/dNfertilizer at the six fertilization
BGD
10, 1635–1683, 2013Insights into mechanisms governing C and N
interactions
R. Q. Thomas et al.
Title Page
Abstract Introduction
Conclusions References
Tables Figures
◭ ◮
◭ ◮
Back Close
Full Screen / Esc
Printer-friendly Version Interactive Discussion
Discussion
P
a
per
|
Dis
cussion
P
a
per
|
Discussion
P
a
per
|
Discussio
n
P
a
per
|
the observational uncertainty. Additionally, both net ecosystem production responses were within the uncertainty (24±8.7 kg C (kg N)−1) reported by Lui and Greaver (2009)
in a meta-analysis of forest NEP response to N fertilization.
3.2 Model response to historical N deposition
The clm4mod model had a 144 % larger response of aboveground C increment to N
5
deposition (dCACI/dNdeposition) than the clm4cn model (Table 2). The dCACI/dNdeposition was 14.0 and 34.2 kg C (kg N)−1 in the clm4cn and clm4mod models, respectively (Ta-ble 2). Both models predicted lower responses than reported for aboveground C incre-ment across the Northeastern US (50 kg C (kg N)−1; adjusted from Thomas et al., 2010 for higher rates of N deposition); however, the bias was substantially reduced in the
10
clm4mod model (Table 2). Adding the belowground vegetation and soil response in-creased average dCNEP/dNdeposition across the five sites to 30.0 and 74.1 kg C (kg N)
−1
in the clm4cn and clm4mod models, respectively.
In the simulations with higher rates of N deposition (1995–2004 mean=
2.2 g N m−2yr−1), the aboveground C increment response to N deposition
15
(dCACI/dNdeposition) decreased in both models (Table 2). The simulations with
a large increase in N deposition were designed to test model sensitivity to N deposition levels larger than typically found in the US but similar to levels found in parts of Western Europe. Comparing the model results to observations from Western Europe, the mean dCACI/dNdeposition across all sites in the clm4mod model (26.2 kg C (kg N)−1)
20
was contained within the range reported from inventory measurements of European forests across a N deposition gradient (Table 2; 15–40 kg C (kg N)−1; DeVries et al., 2009), while the mean clm4cn model result was lower than the reported range (11.8 kg C (kg N)−1). For the NEP response to N, the dCNEP/dNdepositionfor the clm4mod
model (49.5 kg C (kg N)−1) was within the range of values recalculated for European
25
BGD
10, 1635–1683, 2013Insights into mechanisms governing C and N
interactions
R. Q. Thomas et al.
Title Page
Abstract Introduction
Conclusions References
Tables Figures
◭ ◮
◭ ◮
Back Close
Full Screen / Esc
Printer-friendly Version Interactive Discussion
Discussion
P
a
per
|
Dis
cussion
P
a
per
|
Discussion
P
a
per
|
Discussio
n
P
a
per
|
model (24.5 kg C (kg N)−1) was 50 % less than the lower bound reported in Sutton et al. (2008).
3.3 Mechanisms explaining the increased responsiveness of the modified model to N deposition and fertilization
Mean retention of N deposition within the ecosystem was strongly associated with the
5
larger dCACI/dNdeposition in the clm4mod than clm4cn. Across all five sites, the mean
retention of N deposition was higher in the clm4mod model than the clm4cn model (Fig. 2). Ecosystem N retention decreased over time in both models (Fig. 2; sum of N recovery in vegetation and soil), as the four-year retention (2000–2004: clm4cn=55 %, clm4mod=94 %) was larger than the 34-yr retention (1970–2004: clm4cn=51 %;
10
clm4mod=81 %). The fate of N retained in the ecosystem was predominately in soil organic matter in both models and at both time scales (Fig. 2). However, the proportion of N deposition retained in both vegetation and soil was higher in the clm4mod than the clm4cn model (Fig. 2) with particularly large increases in N retained in soil.
The response to N deposition (dCACI/dNdeposition) was most sensitive to the use of 15
a Michaelis-Menten approach to plant N uptake in the clm4mod that describes N up-take as a function of soil inorganic N and fine root C, rather than the approach in clm4cn that represents N uptake as a function of photosynthesis and the N required by stoichiometric constraints (Model 6; Table 3; Fig. 4). Implementing the Michaelis-Menten approach increased the dCACI/dNdeposition by 27 kg C (kg N)
−1
. The next largest
20
sensitivity was associated with the pathway of N loss (Model 10; Table 3; Fig. 4); The removal of the N gas loss process simulated in clm4cn as 1 % of net N mineralization decreased the dCACI/dNdepositionby 15 kg C (kg N)
−1
(Fig. 4). Because we increased the proportion of excess N that was denitrified to maintain the same total N loss at pre-industrial steady-state, the change in dCACI/dNdeposition was associated with modifying
25
BGD
10, 1635–1683, 2013Insights into mechanisms governing C and N
interactions
R. Q. Thomas et al.
Title Page
Abstract Introduction
Conclusions References
Tables Figures
◭ ◮
◭ ◮
Back Close
Full Screen / Esc
Printer-friendly Version Interactive Discussion
Discussion
P
a
per
|
Dis
cussion
P
a
per
|
Discussion
P
a
per
|
Discussio
n
P
a
per
|
The implementation of a less open N cycle with lower N input and outputs increased dCACI/dNdeposition by 6 kg C (kg N)−1 (Model 4; Table 3; Fig. 4). dCACI/dNdeposition in-creased by 8 kg C (kg N)−1 in the simulation that decreased denitrification (Model 5; Table 3; Fig. 4) so that the productivity of the model with a less open N cycle (Model 4) had the same pre-industrial primary productivity as the simulation with
Michaelis-5
Menten plant N uptake (Model 6). In contrast, allowing microbial immobilization to have first access to soil inorganic N (Model 8; Fig. 3; Fig. 4) and implementing a represen-tation of nitrification with separated NH+4 and NO−3 pools (Model 11; Table 3; Fig. 4) decreased dCACI/dNdeposition by 7 and 5 kg C (kg N)
−1
, respectively. All other processes described in Table 3 had little impact on dCACI/dNdeposition (<3 kg C (kg N)
−1
).
10
3.4 Synergy between N deposition and atmospheric CO2
Averaged across all five sites, the clm4mod and clm4cn models predicted similar in-creases in NPP over pre-industrial NPP, attributed to the increase in both N deposition and atmospheric CO2 over the period from 1850 to 2004 (clm4cn=84.1 g C m
−2
yr−1; clm4mod=87.2 g C m−2yr−1; 1994–2004; Fig. 5a). However, the relative contribution of
15
N deposition and CO2 fertilization differed strongly between the two models (Fig. 5b). The increase in NPP predicted by the clm4cn model was comprised of a pure N depo-sition response (46 %) and a pure CO2fertilization response (57 %) that were largely
independent of each other, as the synergy only explained 7 % of the NPP change (Fig. 5b). In contrast, the pure CO2 fertilization response in the clm4mod model was
20
small (12 %) while the majority of the NPP increase was explained by a pure N de-position response (58 %) and a synergy between N dede-position and rising CO2 (30 %;
BGD
10, 1635–1683, 2013Insights into mechanisms governing C and N
interactions
R. Q. Thomas et al.
Title Page
Abstract Introduction
Conclusions References
Tables Figures
◭ ◮
◭ ◮
Back Close
Full Screen / Esc
Printer-friendly Version Interactive Discussion
Discussion
P
a
per
|
Dis
cussion
P
a
per
|
Discussion
P
a
per
|
Discussio
n
P
a
per
|
4 Discussion
Overall, our modifications to the CLM-CN 4.0 substantially improved predictions of C storage in response to historical N deposition. The modifications in the clm4mod model increased the aboveground C increment response to historical N deposition by 144 % compared to the clm4cn model and compared more closely with observations across
5
N deposition gradients in the Northeastern US and Western Europe. Modifications to the representation of plant N uptake and pathways of N losses were the most impor-tant mechanisms that were responsible for the increased aboveground C increment response to N deposition in the clm4mod model. The net effect of the modifications increased ecosystem retention of N deposition and increased synergy between N
de-10
position and fertilization from elevated atmospheric CO2.
4.1 Response to historical N deposition
The response to N deposition was most sensitive to the implementation of a Michaelis-Menten approach to plant N uptake (Model 6; Fig. 4). By adding the Michaelis-Michaelis-Menten uptake, plant N uptake depended on the fine root C stock, the soil inorganic N
concen-15
tration, temperature, and N status of the plant rather than the N demand set by pho-tosynthesis, allocation, and C : N ratios of the allocated tissues. The Michalis-Menten uptake increased the N deposition response by increasing N retention (2000–2004) by 9 %, likely due to greater ability of plants to compete against N loss processes. Michaelis-Menten uptake also increased soil inorganic N stocks necessary to yield the
20
same N uptake as the clm4cn model. This reduced the competition between plants and immobilization, thus increasing the total assimilation into N soil organic matter. A range of N uptake approaches are used in ecosystem and global biogeochemical models suggesting the choice of how N uptake is represented can strongly influence the sensitivity to N deposition in the model.
25
BGD
10, 1635–1683, 2013Insights into mechanisms governing C and N
interactions
R. Q. Thomas et al.
Title Page
Abstract Introduction
Conclusions References
Tables Figures
◭ ◮
◭ ◮
Back Close
Full Screen / Esc
Printer-friendly Version Interactive Discussion
Discussion
P
a
per
|
Dis
cussion
P
a
per
|
Discussion
P
a
per
|
Discussio
n
P
a
per
|
and global biogeochemical models: turnover-dependent and concentration-dependent pathways (Menge, 2010). Turnover dependent pathways refer to N losses that are pro-portional to the turnover of organic matter. Concentration-dependent pathways refer to N losses that are proportional to the concentration of soil inorganic N. As an example of a turnover-dependent pathway, the clm4cn has a pathway of N gas loss that is
pro-5
portional to the net N mineralization associated with soil organic matter turnover (1 % of net N mineralization). The sensitivity analysis found that substituting concentration-dependent for a turnover-concentration-dependent gas loss pathway decreased the plant C response to N deposition; the substitution occurred through removing the N gas loss associated with net mineralization and compensating the reduced N loss by increasing
denitrifica-10
tion of excess soil inorganic N, a concentration-dependent pathway (Model 10; Fig. 4). Similarly, DON leaching in the clm4mod is another example of a turnover-dependent loss pathway (Menge, 2011) because it is proportional to the decomposition of litter. We found that by including DON leaching and reducing the denitrification of NO−3 (Model 14; Fig. 4), the plant C response to N deposition response increased. Overall it is
15
clear that models with a greater role of turnover-dependent N losses are had a greater plant C response to N deposition than models with N loss dominated concentration-dependent pathways; We hypothesize that concentration-concentration-dependent pathways are able to more quickly lose N deposition when N availability is elevated, while turnover-dependent pathways increase N retention by requiring N deposition to cycle through
20
the plants and soil before being lost.
Another important change to the CLM-CN that was responsible for increasing the dC/dNdeposition response in the clm4mod model was the implementation of a less open
N cycle (Model 4; Fig. 4). N cycles range from being open to closed depending on the importance of the inputs and outputs of N relative to the internal N cycling fluxes.
25
BGD
10, 1635–1683, 2013Insights into mechanisms governing C and N
interactions
R. Q. Thomas et al.
Title Page
Abstract Introduction
Conclusions References
Tables Figures
◭ ◮
◭ ◮
Back Close
Full Screen / Esc
Printer-friendly Version Interactive Discussion
Discussion
P
a
per
|
Dis
cussion
P
a
per
|
Discussion
P
a
per
|
Discussio
n
P
a
per
|
is not explicitly specified in ecosystem models; rather, it is controlled by the balance of N inputs to outputs. The magnitude and mechanisms governing N fixation and N losses vary widely among global biogeochemical models, likely indicating that the de-gree of openness of the N cycle also varies among models. Indeed, in comparison to another global biogeochemical model, in the extra-tropics the clm4cn model reports
5
both a greater role of N availability in the C cycle and greater N fixation (Thornton et al., 2007) than the LM3V model (Gerber et al., 2010). The LM3V model uses a demand-driven approach to N fixation that recognizes that N fixation is limited in closed-canopy temperate and boreal forests (Crews, 1999) rather than the relationship between NPP and N fixation, derived from Cleveland et al. (1999), used in the clm4cn.
10
The net effect of all the modifications (Models 2–15) was to increase the dC/dNdeposition response to N deposition by increasing the retention of N deposition
within the ecosystem, as greater long-term N retention increased the availability of N to plants and allowed them to respond to rising atmospheric CO2. Retention of N de-position within the five simulated forests at the 4 to 30 yr time horizon in the clm4mod
15
model was between 81 and 95 %, and only 51 to 55 % in the clm4cn model. The higher N retention rate in the clm4mod model than the clm4cn model better matches obser-vations from field tracer experiments in which isotopically labeled N (15N) was added to forests and total isotope recovery was used to measure N retention (Nadelhoffer et al., 1999, 2004; Templer et al., 2012). At the Harvard Forest site, retention of added
20 15
N in two experiments after 7 yr ranged from 88 to 100 %, which compares well to clm4mod (Nadelhoffer et al., 2004; treatments with no additional N fertilization added). In contrast, a15N tracer experiment at one of the Michigan sites (MI-B) only recovered 17.5 % of added15N, which is substantially lower than both the clm4cn and clm4mod models (Zak et al., 2004). This tracer study differed markedly from most others. That
25
BGD
10, 1635–1683, 2013Insights into mechanisms governing C and N
interactions
R. Q. Thomas et al.
Title Page
Abstract Introduction
Conclusions References
Tables Figures
◭ ◮
◭ ◮
Back Close
Full Screen / Esc
Printer-friendly Version Interactive Discussion
Discussion
P
a
per
|
Dis
cussion
P
a
per
|
Discussion
P
a
per
|
Discussio
n
P
a
per
|
90 % recovery of15N after 1–3 yr of addition (Nadelhoffer et al., 1999). Overall, on the balance of evidence, the increased N retention in the clm4mod better reflects the15N retention observed in most temperate forest tracer studies.
The net effect of all the modifications also increased synergy between N deposition and atmospheric CO2in the clm4mod. Surprisingly, when averaged across all five sites, 5
the increase in NPP resulting from N deposition was similar between the two models in the simulations when rising atmospheric CO2was not included (Fig. 5b). However,
when rising atmospheric CO2 was included, the synergy between N deposition and
CO2led to a larger total response to N deposition in the clm4mod model than clm4cn model. This increase in synergy was due to the greater retention of N deposition in
10
the clm4mod than the clm4cn model. The reduction of N limitation resulting from the additional ecosystem N allowed an enhancement of photosynthesis by the next most limiting resource in the model, CO2, whereas the clm4cn model remained N limited.
Consequently, the clm4mod model exhibited CO2 fertilization in the simulation with
both rising CO2 and N deposition, enabled in part by rising N deposition. Overall, the
15
increased enhancement of NPP due to synergy between N deposition and CO2 from
7 % in clm4cn to 30 % in clm4mod led to better correspondence with other studies: a 25 % synergistic effect measured in field-based CO2fertilization experiment of needle leaf pine forest (Oren et al., 2001) and a 28 % synergistic effect reported by a global modeling analysis using BIOME-BGC model (Churkina et al., 2009).
20
4.2 Response to N fertilization
Overall, the clm4mod either improved or had no impact on the comparison to obser-vations from N fertilization experiments, depending on the metric used in the model evaluation. In this study, we used three metrics to compare model predictions from clm4cn and clm4mod to N fertilization experiments, with each metric testing different
25
BGD
10, 1635–1683, 2013Insights into mechanisms governing C and N
interactions
R. Q. Thomas et al.
Title Page
Abstract Introduction
Conclusions References
Tables Figures
◭ ◮
◭ ◮
Back Close
Full Screen / Esc
Printer-friendly Version Interactive Discussion
Discussion
P
a
per
|
Dis
cussion
P
a
per
|
Discussion
P
a
per
|
Discussio
n
P
a
per
|
leaf production, to N fertilization. The ANPP response metric showed that, on average, the clm4mod corresponded better to observations than the clm4cn, with particular im-provements at the Harvard Forest site. The improved correspondence at the Harvard Forest site was attributable to both a decrease in potential ANPP when N was not limiting (see discussion below) and an increase in the ANPP of the control treatment.
5
However, the ANPP increase metric did not include changes in mortality that were included in the second metric, dCACI/dNfertilization (i.e. the change in standing stock of
aboveground C between years). The model modifications did not have an impact on the mean dCACI/dNfertilization response to N fertilization and both the clm4mod and clm4cn
predicted larger dCACI/dNfertilizationthan observed. The two key differences between the 10
ANPP responses and dCACI/dNfertilization to fertilization were: one, increased mortal-ity from N fertilization in the field studies may not decrease ANPP but will decrease dC/dN, and two, increased foliar production in the models increases ANPP without di-rectly increasing dC/dN. Neither model included mechanisms through which elevated N inputs could increase tree mortality and tissue turnover, and both models predicted
15
an increase in foliar productivity not found in the fertilization experiments (Magill et al., 2004; Pregitzer et al., 2008).
The productivity of the N fertilized treatment alone is the third metric describing how productivity responded to N fertilization. The ANPP in the field fertilized plots can be viewed as an approximation of the N unlimited productivity, assuming the fertilization
20
level was high enough to meet plant demand and low enough to prevent negative effects of soil acidification. If so, the measure of N unlimited productivity is a metric that does not test the model response to N per se; rather, it tests the representation of the next most limiting resource in the models. Averaged across all six fertilization experiments, the clm4mod model did improve predictions of ANPP in the fertilized
25
BGD
10, 1635–1683, 2013Insights into mechanisms governing C and N
interactions
R. Q. Thomas et al.
Title Page
Abstract Introduction
Conclusions References
Tables Figures
◭ ◮
◭ ◮
Back Close
Full Screen / Esc
Printer-friendly Version Interactive Discussion
Discussion
P
a
per
|
Dis
cussion
P
a
per
|
Discussion
P
a
per
|
Discussio
n
P
a
per
|
decreased the simulated productivity when N limitation was relieved. However, a key difference between the clm4cn and clm4mod models was that the simulated N fertil-ization experiments relieved N limitation in the clm4mod simulations while it did not in the clm4cn simulations, potentially due to the high ecosystem retention of N in the clm4mod. Table 4 shows that the N unlimited ANPP in the clm4mod did not differ from
5
the ANPP in the fertilization simulations, while the N unlimited ANPP in the clm4cn was 77 % greater than the ANPP in the fertilization simulations. The low ecosystem reten-tion of N in the clm4cn maintained N limitareten-tion even at fertilizareten-tion levels over double net N mineralization rates.
4.3 Implications
10
The set of model simulations presented in this study also provide insight into the ob-servational data. The reported dC/dN was lower for the fertilization experiments than for the dC/dN from N deposition gradients (Table 2). Furthermore, there was a lower reported dC/dN in gradient studies in Europe than in the US (Table 2). Despite these disparities, we show that the reported dC/dN data are reconcilable if the differences in
15
the magnitude and time-scale of N additions are considered. The clm4mod model sim-ulations overlapped or were near the uncertainty bounds in the observations across the different times scales and magnitudes of N additions. The N deposition gradient stud-ies measured the response to lower N inputs over a longer period of time (decades to a century), while the N fertilization experiments measured the response to higher
20
inputs over a shorter time scale (years to decades). This indicates that the differences in ecosystem N use efficiencies reported for different fertilization studies and N depo-sition gradients may be explained by differences in the magnitude and time scale of N addition.
Overall, the substantial increase in C storage response to N deposition that occurred
25
BGD
10, 1635–1683, 2013Insights into mechanisms governing C and N
interactions
R. Q. Thomas et al.
Title Page
Abstract Introduction
Conclusions References
Tables Figures
◭ ◮
◭ ◮
Back Close
Full Screen / Esc
Printer-friendly Version Interactive Discussion
Discussion
P
a
per
|
Dis
cussion
P
a
per
|
Discussion
P
a
per
|
Discussio
n
P
a
per
|
altering the mechanisms governing plant N uptake and the pathways of N loss. At the global scale, the modifications to CLM-CN presented are likely to improve the model correspondence to the globally distributed set of N fertilization experiments,15N tracer studies, and small catchment N budgets that have been previously used to benchmark global biogeochemical models (Thomas, 2013). Furthermore, we show that due to
non-5
linearity in ecosystem response to N addition, testing models with both the response to gradual increases in N inputs over decades (N deposition) and N pulse additions of N over multiple years (N fertilization) allows for greater understanding of the mechanisms governing C-N coupling.
Appendix A
10
clm4mod model description
The clm4mod model includes changes to the canopy scaling of photosynthesis, max-imum photosynthetic rates, radiative transfer, leaf photosynthesis, and stomatal con-ductance described in Bonan et al. (2012) and (2011). Additional modifications are described below.
15
A1 Nitrogen uptake by plants
Plant uptake of inorganic nitrogen (N) in CLM-CN 4.0 (“clm4cn”) is based on the N required to match the demand set by N unlimited photosynthesis (i.e. potential gross primary productivity) and plant tissue C : N stoichiometric constraints. In the clm4cn model, N uptake is independent of allocation to fine root mass. The clm4mod model
20
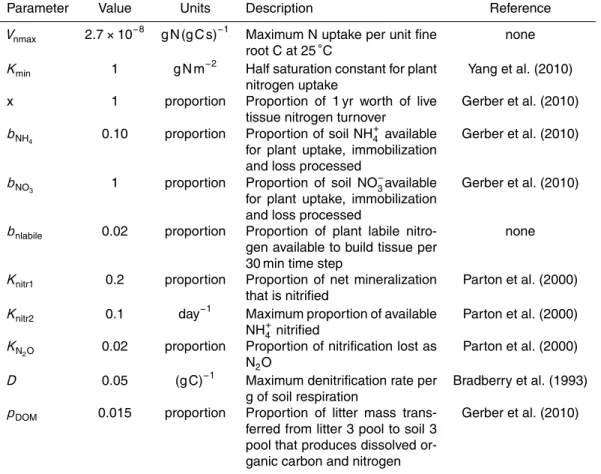
represents N uptake as a function of fine root carbon (C) mass (Cfroot), soil inorganic N availability (NH4,av+NO3,av), soil temperature (f(T)), and plant demand for N (f(Nlabile)).
UN,plant=Vnmax NH4,av+NO3,av
NH4,av+NO3,av
BGD
10, 1635–1683, 2013Insights into mechanisms governing C and N
interactions
R. Q. Thomas et al.
Title Page
Abstract Introduction
Conclusions References
Tables Figures
◭ ◮
◭ ◮
Back Close
Full Screen / Esc
Printer-friendly Version Interactive Discussion
Discussion
P
a
per
|
Dis
cussion
P
a
per
|
Discussion
P
a
per
|
Discussio
n
P
a
per
|
wheref(Nlabile) down regulates the uptake capacity based on the stock of labile N in the
plant. As Nlabileapproaches one year’s worth of N turnover of live tissue (x; leaves, fine roots, and live wood), the maximum uptake capacity decreases. The down regulation function is based on Aber et al. (1997).
f(Nlabile)=
s
1−Nlabile
x
5
The temperature functionf(T), is the same function governing soil decomposition, ni-trification (see below), and denini-trification (see below). NH4,av+NO3,avare the concen-trations of ammonium and nitrate that are available for plant uptake (see below).Vnmax
is the maximum uptake capacity at 25◦C when N demand was large (i.e.f(Nlabile)=1).
Kmin is the half saturation constant for plant uptake.
10
The availability of N within the plant for growth is buffered so that a proportion (2 %) of the labile N pool is available to build plant tissue.
A2 Fine root turnover
In the clm4cn model, the turnover of fine root C is linked to the turnover of leaf C. In the clm4mod version, the root turnover is an explicit parameter and is decoupled
15
from leaf turnover. Root turnover occurrs throughout the year, rather than only when leaves senesce. Root turnover is maintained at the same rate as the clm4cn model for all species (1.0 yr−1), except boreal and temperate needleleaf species, which has a turnover of 0.3 yr−1based on White et al. (2000). Decoupling fine root turnover from leaf turnover allows fine roots to be present throughout the year and permits a fast
20
response of plant N uptake in the spring.
A3 Soil N dynamics
BGD
10, 1635–1683, 2013Insights into mechanisms governing C and N
interactions
R. Q. Thomas et al.
Title Page
Abstract Introduction
Conclusions References
Tables Figures
◭ ◮
◭ ◮
Back Close
Full Screen / Esc
Printer-friendly Version Interactive Discussion
Discussion
P
a
per
|
Dis
cussion
P
a
per
|
Discussion
P
a
per
|
Discussio
n
P
a
per
|
The NH+4 pool is buffered to represent an exchangeable pool and a pool in solution that is available for plants, immobilization, nitrification, and leaching.
NH4,av=bNH
4NH4
wherebNH
4 is assumed to be 10 % of total soil NH
+
4 (Gerber et al., 2010). Constant
buffering capacity is a first approximation for a more complex process of
resorp-5
tion/desorption. Future model development could parameterize non-linearity into the buffering capacity that is a function of the total soil organic matter and the bulk den-sity of the soil. NO−3 is assumed to have no buffering capacity in the soil therefore NO3,av=NO
− 3.
A4 Internal N cycling
10
The clm4mod model assumes that microbes have priority for soil inorganic N to meet the immobilization demand. Plant uptake and immobilization of N is divided between NH+4 and NO−3 in proportion to the availability of each N species (NH4.av; NO3,av). The
conversion of NH+4 to NO−3 (nitrification) is represented as function of net N mineraliza-tion, NH+4 availability, temperature, and water availability based on Parton et al. (2001).
15
Nitrifiers are assumed to be less competitive for NH+4 than plants and immobilization into soil organic matter
Nnitr=Knitr1Nmineralization+Knitr2NHav,nitrf(T)f(W)
where the NH4,av,nitris the NH+4 available for nitrification
NH4,av,nitr=NH4,av−UNH
4,plant−UNH4,soil
20
Knitr1, Knitr2, f(T), and f(W) are the proportion of net mineralization that is nitrified, maximum nitrification rate (s−1) based on available NH4,av,nitr, temperature modifier,
BGD
10, 1635–1683, 2013Insights into mechanisms governing C and N
interactions
R. Q. Thomas et al.
Title Page
Abstract Introduction
Conclusions References
Tables Figures
◭ ◮
◭ ◮
Back Close
Full Screen / Esc
Printer-friendly Version Interactive Discussion
Discussion
P
a
per
|
Dis
cussion
P
a
per
|
Discussion
P
a
per
|
Discussio
n
P
a
per
|
and water functions that modified decomposition and plant N uptake (Thornton et al., 2007, 2009). The clm4mod model ignores the effect of pH on nitrification (Parton et al., 1996). A proportion (0.02) of the nitrification is lost to N2O and not converted to NO
− 3
(Parton et al., 2001).
A5 Inorganic N loss
5
In the clm4mod model, the leaching of NH+4 is a function of the soil water drainage and NH4,av, minus the NH+4 uptake by plants, immobilization, and nitrifiers during the model
time step. Likewise, the leaching of NO−3 is a function of the soil water drainage and NO−3, minus the NO−3 taken up by plants and immobilization during the model time step. The loss of NO−3 through denitrification is modeled as a function of the available
10
nitrate NO3,av (minus nitrate uptake by plants, immobilization, and leaching), the
ra-tio of soil water to saturated soil water, and total respirara-tion from soil organic matter decomposition (a proxy for microbial activity and oxygen composition; CO2,soil). The
representation is described in Bradbury et al. (1993) and Yang et al. (2010).
Ndenit=DCO2,soilNO3,av
W Ws
15
whereDis the denitrification rate per g of CO2respiration of soil organic matter, theW
is soil water in the top five soil layers andWs is water holding capacity at saturation.
A6 Biological N fixation
The biological N fixation in temperate and boreal forests is modified to better represent observations that N fixing tree species are largely absent from mid- to late-
succes-20