www.biogeosciences.net/11/5877/2014/ doi:10.5194/bg-11-5877-2014
© Author(s) 2014. CC Attribution 3.0 License.
Delayed responses of an Arctic ecosystem to an extreme summer:
impacts on net ecosystem exchange and vegetation functioning
D. Zona1,2, D. A. Lipson2, J. H. Richards3, G. K. Phoenix1, A. K. Liljedahl4, M. Ueyama5, C. S. Sturtevant6, and W. C. Oechel2
1Department of Animal and Plant Sciences, University of Sheffield, Western Bank, Sheffield, S10 2TN, UK 2Department of Biology, San Diego State University, San Diego, CA, USA
3Department of Land, Air and Water Resources, University of California, Davis, CA, 95616-8627, USA
4Water and Environmental Research Center, and International Arctic Research Center, University of Alaska Fairbanks, Fairbanks, AK, USA
5Graduate School of Life and Environmental Sciences, Osaka Prefecture University, Sakai, Japan
6Department of Environmental Science, Policy and Management, University of California Berkeley, Berkeley, CA, USA
Correspondence to:D. Zona ([email protected])
Received: 9 September 2013 – Published in Biogeosciences Discuss.: 9 December 2013 Revised: 3 September 2014 – Accepted: 5 September 2014 – Published: 24 October 2014
Abstract. The importance and consequences of extreme events on the global carbon budget are inadequately un-derstood. This includes the differential impact of extreme events on various ecosystem components, lag effects, recov-ery times, and compensatory processes. In the summer of 2007 in Barrow, Arctic Alaska, there were unusually high air temperatures (the fifth warmest summer over a 65-year pe-riod) and record low precipitation (the lowest over a 65-year period). These abnormal conditions were associated with substantial desiccation of theSphagnumlayer and a reduced netSphagnumCO2sink but did not affect net ecosystem ex-change (NEE) from this wet-sedge arctic tundra ecosystem. Microbial biomass, NH+4 availability, gross primary produc-tion (GPP), and ecosystem respiraproduc-tion (Reco) were generally
greater during this extreme summer. The cumulative ecosys-tem CO2sink in 2007 was similar to the previous summers, suggesting that vascular plants were able to compensate for
SphagnumCO2uptake, despite the impact on other functions and structure such as desiccation of theSphagnumlayer. Sur-prisingly, the lowest ecosystem CO2sink over a five summer record (2005–2009) was observed during the 2008 summer (∼70 % lower), directly following the unusually warm and dry summer, rather than during the extreme summer. This sink reduction cannot solely be attributed to the potential damage to mosses, which typically contribute∼40 % of the entire ecosystem CO2sink. Importantly, the return to a
sub-stantial cumulative CO2sink occurred two summers after the extreme event, which suggests a substantial resilience of this tundra ecosystem to at least an isolated extreme event. Over-all, these results show a complex response of the CO2sink and its sub-components to atypically warm and dry condi-tions. The impact of multiple extreme events requires further investigation.
1 Introduction
Generally, arctic ecosystems are among those experiencing the fastest relative and absolute changes in climatic condi-tions (IPCC, 2013), and can be highly sensitive to extreme climatic events (Bokhorst et al., 2011). It is therefore critical to understand the effect of increased climate variability on arctic tundra ecosystem functioning.
Often, warming has been connected to increased produc-tivity in northern ecosystems (Zhou et al., 2001; Chen et al., 2006; Zhao and Running, 2010; Wookey et al., 2009; Ep-stein et al., 2012). This occurs, at least in part, because opti-mum temperatures for photosynthesis in arctic vegetation are usually higher than the observed mean temperatures (Wil-son, 1957; Oechel, 1976; Tieszen, 1981). On the other hand, the impact of temperature increases on ecosystem respiration (Reco) can result in a net C release from northern
ecosys-tems (Billings, 1982; Peterson et al., 1984; Piao et al., 2008). The occurrence of high summer temperatures might nega-tively affect the photosynthetic capacity of arctic plants and increase leaf mortality due to direct temperature stress and/or drying (Marchand et al., 2005, 2006a) as peatlands have been shown to be sensitive to drought (Lafleur et al., 2003; Riutta et al., 2007; Lund et al., 2012). Increased temperatures may also decrease species richness and change the composition of Arctic plant communities (Walker et al., 2006; Elmendorf et al., 2012). Additionally, warming stimulates respiratory loss and might turn the tundra ecosystems into a C source (Billings et al., 1982; Dorrepaal et al., 2009). It is still largely unknown how the combined changes in temperature and soil moisture (i.e., drought and heat waves) will ultimately affect ecosystems (Wu et al., 2011). This is particularly true for arctic tundra ecosystems, which present an extremely com-plex response to temperature and hydrological change due to the presence of permafrost. The near desert-like precipitation regime is able to sustain extensive arctic wetlands, partly due to the high soil water storage capacity and low drainage con-strained from the shallow active layer (the ground that ex-perience seasonal freeze and thaw). However, despite these factors, there is evidence that reduced precipitation can re-duce the CO2 sink, at least in the more southerly of these high-latitude ecosystems, due to soil drying and increases in
Reco(Oechel et al., 1993, 1995; Angert et al., 2005; Piao et
al., 2008).
Overall, there is a need to understand how temperature and hydrological change affects high-latitude ecosystems. There-fore, in this study we investigated the impact of an extremely low precipitation and very warm summer (2007) on a wet-sedge arctic tundra ecosystem in Barrow, Alaska. We hypoth-esized that warm and dry conditions would result in a rapid decrease in net ecosystem CO2 sink due to drought stress to vegetation and the increase in Reco at higher tempera-tures. We also hypothesized that the net ecosystem exchange (NEE), gross primary production (GPP), andRecorecovered to normal values immediately after the extreme event, with a return to normal weather conditions. To investigate how the entire ecosystem (larger scale) and different vegetation
com-ponents (smaller scale) were affected by this extreme event, we compared NEE, GPP, and ecosystem respiration (Reco) to
plot-scale net “moss (Sphagnumspp.) CO2sink” (net Sphag-numexchange, NSE), vascular plant development (leaf area index, LAI), soil microbial biomass C, and nutrient avail-ability. Finally, to understand the resilience of this wet-sedge tundra ecosystem to this extreme event, we also investigated the response of NEE, GPP, andReco during two additional
growing seasons after this extreme weather event, therefore including a total record of 5 years in this study.
2 Materials and methods 2.1 Study site
The study area is located in a vegetated drained lake basin at the Barrow Environmental Observatory (BEO), about 10 km east of the town of Barrow, Alaska, with a basin area of about 0.3 km2. The area is characterized by low elevation, moderate slopes (Brown, 1967), the presence of continuous permafrost with a seasonal thaw depth of up to∼40 cm (Hinkel et al., 2001), and wet-sedge tundra vegetation (Brown, 1967). This tundra vegetation is composed ofCarex aquatilis, Eriopho-rum vaginatum, andDupontia fisheri, and is dominated by mosses (mostlySphagnumspp.) which are about 80 % of the living biomass (Zona et al., 2009; 2011). Long-term average meteorological conditions of the site are reported in Table 1.
2.2 Eddy-covariance measurements
Three eddy-covariance (EC) towers were installed at the be-ginning of summer 2005 for a large-scale manipulative ex-periment (Zona et al., 2009, 2012). The eddy-covariance tower included a Gill WindMasterPro sonic anemometer (Gill Instruments Ltd., Lymington, Hampshire, UK), and an open path LI-7500, placed at about 1.6 m above the ground (Zona et al., 2009). For the present study, data from the control (south) section not subjected to manipulations from 2005–2008 were used (south tower, 71◦16′51.17′′N,
156◦35′47.28′′W, ∼4.6 m a.s.l.). As the south section was
also subjected to an increased water table at the end of July 2009, the cumulative CO2uptake for that season is included until the end of July. In contrast to the previous published studies which mostly investigated the impact of flooding on CO2and CH4fluxes (Zona et al., 2009, 2012), this study fo-cuses on the impact of a naturally occurring extreme event on net ecosystem exchange (NEE), gross primary production (GPP), ecosystem respiration (Reco), netSphagnumCO2
ex-change (NSE), leaf area index (LAI), microbial biomass C, and ammonium (NH+4) in soil pore water.
components (w, and v), and the Webb–Pearman–Leuning
correction (Webb et al., 1980) for the CO2fluxes. More de-tails are described in Zona et al. (2009, 2012) and in Sturte-vant et al. (2012). As we previously reported (Zona et al., 2012), the u∗ threshold used was set to 0.1 m s−1, and the footprint analyses (Hsieh et al., 2000; Kljun et al., 2004) performed on the eddy-covariance fluxes showed that most (∼90 %) of the fluxes corresponded to a fetch 80 m upwind from the tower. The percent data coverage of the NEE data was 47 % in 2005, 43 % in 2006, 55 % in 2007, 45 % in 2008, and 46 % in 2009. This data coverage is fairly typi-cal for eddy-covariance towers in arctic and boreal ecosys-tems; data coverage from these northern sites is about 15 % in the winter (Oechel et al., 2014), and ranges between 33– 60 % in the summer, with a few sites in the boreal forest with > 80 % data coverage (Ueyama et al., 2013). The flux uncer-tainties and gap-filling were performed using standard on-line methodologies, as used in Fluxnet (http://www.bgjena. mpg.de/~MDIwork/eddyproc/, and in Reichstein et al., 2005 and Lasslop et al., 2010). The flux partitioning for estimat-ing GPP and Reco was performed according to Runkle et al. (2013).
2.3 Environmental conditions
Soil moisture, soil temperature at different depths (surface, 5, 10, 20, and 30 cm), air temperature, relative humidity, photosynthetically active radiation (PAR), and net radiation were measured near the EC tower, as described in Zona et al. (2009, 2012). Surface temperature was estimated from the infrared radiation emitted from the vegetation surface and collected with a Apogee infrared sensor (Apogee In-struments, Inc.™, Logan, Utah, USA) pointing towards the main footprint of the EC towers (Zona et al., 2009). Diffuse radiation was measured using a Sunshine Sensor (Delta-T Devices, Cambridge, UK). The sunshine status threshold is 120 W m−2(therefore when the diffuse radiation was below this value, the sensor reported a diffuse radiation equal to zero). These environmental conditions were assumed to be fairly representative of the general environment experienced by the mosses and were used for the statistical analysis.
Potential evapotranspiration (PET) during 1999–2009 was calculated using the Penman–Monteith equation (Monteith, 1975) using field measurements from the EC tower (above) and from Harazono et al. (2006) assuming a ground heat flux of 10 % of net radiation. Long-term records (1949–2013) of daily precipitation and air temperature were retrieved from the National Climatic Data Center (NCDC) archive for Barrow Airport (STN 700260, WBAN 27502, http://www. ncdc.noaa.gov/cdo-web/#t=firstTabLink). Precipitation was adjusted for undercatch according to Yang et al. (1998). Long-term (1999–2009) incoming solar radiation (direct and diffuse) was obtained from the Atmospheric Radiation Mea-surement (ARM) program (http://ncvweb.archive.arm.gov/). The start date of summer (end of snow melt) was defined
by visual inspection at the site and by the characteristic in-crease in net radiation (1999–2003 and 2005–2006), peak runoff measurements (2007), ablation measurements (2008 and 2009), and the resulting calibration of the temperature and wind index degree-day method for 2004. The thaw depth was measured with a lower intensity (at 12, 21, and 20 points across the 200 m transect from the tower) in 2005–2007, then increased to 100 points (Zona et al., 2012) in 2008, and 2009. Ammonium (NH+4) in soil pore water and soil micro-bial biomass C were measured as described in Lipson et al. (2012). Briefly, soil pore water was collected from 18 lo-cations every∼20 m across the same transects where the wa-ter table and thaw depth measurements were performed, us-ing Eijkelkamp Rhizon soil moisture samplers, and NH+4 was measured using a phenolate/hypochlorite color assay. Soil cores were collected to a depth of 15 cm from a total of 36 locations every∼25 m across these transects, and soil micro-bial biomass C was measured using chloroform fumigation– extraction followed by analysis with an Mn(III)–sulfuric acid assay.
2.4 Sphagnumwater content, netSphagnum CO2exchange (NSE)
Water content in theSphagnumlayer was determined gravi-metrically in summer 2006 and 2007 (Zona et al., 2011). Four samples of the first 2 cm of theSphagnumlayer (about 10 cm diameter) were removed at each measurement date us-ing a sharp scissor, sealed inside aluminium cans, and re-turned to the laboratory for weighing and drying. Net Sphag-num CO2 exchange (NSE) measurements were performed weekly by removing eight samples (4 cm in diameter) in each of three different plots (every about 50–70 m) across a 200 m transect upwind from the EC tower, including the first 2 cm of the moss mat. The eight samples in each of these three plots were sampled at 1–2 m distance from each other. For these measurements, a LI-6400 portable photosynthetic system (LI-COR, Lincoln, Nebraska, USA) and a modified conifer chamber (Zona et al., 2011) were used. These mea-surements represented the net CO2 exchange in the green photosynthetic layer ofSphagnum; the term netSphagnum
CO2 exchange is used for consistency with a previous pub-lished paper (Zona et al., 2011).
2.5 Leaf area index (LAI)
Table 1.Meteorological and hydrological conditions at the Barrow Environmental Observatory, Alaska, for the indicated periods in 2005– 2009 compared to long-term means. Summer 2007 experienced the lowest precipitation over the period 1949–2009 (followed by 1991, 19 mm) and was the fifth warmest summer. Values represent end-of-snowmelt to the end of August unless otherwise stated. Precipitation values in parentheses 2005–2009 represent the total for June through August.
Variable 2005 2006 2007 2008 2009 Long- Long-term term period
Mean summer air 3.3 2.9 5.4 3.3 3.8 3.2 1949–2013 temperature,◦Ca
Cumulative incoming summer 1333 1311 1542 1344 1376 1327 1999–2009 solar radiation, MJ
Total summer diffuse solar 733 850 774 859 917 824 1999–2009 radiation, MJ
Snow water equivalent 100 138 95 155 127 120 1995–2009 (SWE), mmb
Summer precipitation, 74 61 13 56 89 72a 1949–2013 mmc (86)a (65)a (13)a (67)a (91)a
Potential summer 165 134 208 147 155 157 1999–2009 evapotranspiration (PET), mmd
Precipitation-PET, −91 −72 −194 −91 −66 −86 1999–2009 mm
aRepresents June through August.
bSWE is from CALM (Brown et al., 2000) snow depth measurements with snow density set to 0.32 g cm−3. cAdjusted according to Yang et al. (1998).
dPenman–Monteith method (Monteith, 1975) assuming a ground heat flux of 10 % of the net radiation.
transect at 11 locations (one repetition in each of these loca-tions for a total of 11 measurements per sampling date). LAI of the three most abundant species (Carex aquatilis, Dupon-tia fisheri, Eriophorum spp.) was also measured directly by destructive biomass sampling performed in mid-August 2006 (Olivas et al., 2011; Zona et al., 2011). All leaves of these species were scanned next to an object of known area as de-scribed in Olivas et al. (2011), and the total leaf area of these three species was divided by the plot area, giving a reason-able comparison to LAI measured with the LAI-2000 (the difference in these estimates was∼9 %; Zona et al., 2011).
2.6 Statistical analyses
One-way ANOVA and Bonferroni post hoc test (SYSTAT 13, Systat Software Inc., Chicago, IL, USA) were used to test if NEE, GPP,Reco, NSE, and LAI were significantly different
between the summers of 2006 and 2007, and if the NH+4 in soil pore water and soil microbial biomass C were different among the years (2006–2009). For NEE, GPP, Reco, NSE,
and LAI, these tests were performed for the entire data set divided into intervals (12–30 June, 1–26 July, 27 July–16 August, 17–30 August). These intervals (with slightly dif-ferent lengths) were selected because they correspond to the typical phases of vegetation development during the grow-ing season in the Arctic (early season after snow melt: 12–30 June; peak season with maximum vegetation development: 1–26 July; late season after 27 July until the end of August). The late season period was divided into two sub-periods (27
July–16 August, 17–30 August) after we noticed that the en-vironmental conditions changed substantially on 16 August 2007 when rainfall suddenly increased the water table and moisture content (see Results).
3 Results
3.1 Environmental conditions, Soil Microbial Biomass C, and Soil Water NH+4
From visual inspection, snow melt occurred on 12–13 June in 2005, on 13 June in 2006, on 10–11 June in 2007, and on 12 June in 2008, and on 9 June in 2009. These estimates were in fairly good agreement with the end of snowmelt estimated from the degree-day method (which was calibrated with ab-lation measurements in 2008-2009), estimating a snow melt on 15 June (2005), 11 June (2006), 9 June (2007), 9 June (2008), and 5 June (2009). This second method was used to estimate the long-term (1999–2009) snow melt average, which was 10 June. Monthly air temperatures from NOAA’s long-term record showed that the period of July to the end of August 2007 was the warmest over the 129-year record on the North Slope of Alaska (Jones et al., 2009). In Barrow, the period from the beginning of June until the end of August 2007 represented the lowest precipitation during a 65-year period (1949–2013, Table 1). At our site, the mean air tem-perature (5.4◦C) in summer 2007 was two degrees higher
than the long-term mean of 3.2◦C, and the surface
wetter summer (Supplement Fig. S1). Additionally, the total summer precipitation was 13 mm, which is less than 20 % of the long-term average (72 mm) (Table 1). This air temper-ature increase is double the average tempertemper-ature increases obtained with warming experiments using open top cham-bers across the Arctic (Bokhorst et al., 2013), and a 10◦C
surface temperature increase is similar to what was reported in Marchand et al. (2006b). The atypical weather of summer 2007 was associated with much higher evaporative demand, much higher difference between precipitation and potential evapotranspiration (P-PET), higher cumulative incoming so-lar radiation and lower diffuse radiation than the long-term average (Table 1), and higher vapor pressure deficit (VPD) (Liljedahl et al., 2011). The summer of 2007 also had lower soil moisture (Supplement Figs. S1 and S2) and higher radia-tion than the more typical summers (Table 1) and occasional periods of high VPD with high solar radiation and low dif-fuse radiation (Supplement Fig. S3).
Thaw depth reached about −30±3 cm on 24 August 2005 (n=21), −30±3 cm (n=12) on 24 August 2006, −26±2 cm on 2 September 2007 (n=12),−29±2 cm at the 27 August 2008 (n=51), and −31±3 cm on the 19 August 2009 (n=51). The water table was about 0±1 cm on 24 August 2006,−9±1 cm on 25 August 2007,−4±3 on 27 August 2008, −11±7 cm on the 29 July 2009 (be-fore the beginning of any water pumping, see methods). The warmer conditions of summer 2007 stimulated the soil mi-crobial community, affecting decomposition rates – which in turn increased nutrient availability for the vegetation (Fig. 1) and respiratory loss (Fig. 2). Microbial biomass more than doubled in summer 2007 (Fig. 1), consistent with the in-crease in respiratory loss (Fig. 3). In the summer after the ex-treme summer, both microbial biomass and NH+4 decreased substantially following the temperature decrease.
3.2 NEE, GPP, andReco, NSE, and LAI
The higher temperatures in summer 2007 led to an early pro-ductivity of the ecosystem, as shown by the rapid CO2sink right after snow melt as compared to the previous summer (Fig. 2a, b). During the beginning of the summer, GPP was significantly higher in 2007 than in 2006 (Table 2). Even though the ecosystem was a net CO2sink in the early sea-son, we measured CO2 loss from theSphagnumlayer (i.e., positive NSE) (Fig. 2c) during this period.
During peak season (1–25 July), mosses were responsible for a substantial CO2sink both in 2007 and in the previous “normal” summer 2006 (Fig. 2c and Table 2). During the ab-normally warm summer of 2007, surface temperatures, even if much higher (> 10◦C) than the previous year (Supplement
Fig. S1), were below or at the optimum for photosynthesis inSphagnum(between about 20◦C, Harley et al., 1989, and
25◦C, Gerdol and Vicentini, 2011). Peak season NEE in the
warm and dry 2007 was not significantly different from 2006 (Fig. 2b, Table 2) despite the major differences in
environ-Figure 1.Soil pore water NH+4 and microbial biomass C in 18 and 36 locations respectively across the research site. Indicated are aver-ages and standard errors of the mean. NA means no data available.
mental conditions. However, the similar NEE was the result of very different GPP andReco, both of which were
signifi-cantly higher in 2007 compared to 2006 (Table 2).
In contrast, later in the season, the CO2sink in 2007 was lower than in 2006 (Fig. 2b), even if not statistically differ-ent (Table 2). The observed decrease in CO2sink later in the season in 2007 coincided with the water limitation of the C assimilation fromSphagnum(as shown by the positive NSE, Fig. 2c), with Sphagnum water content below 900 % DW (Supplement Figs. S3 and S4). The water limitation of the
SphagnumCO2sink was confirmed by the significant corre-lation between NSE andSphagnum water content (WC) in July–August 2007 (r2=0.76;P <0.05), a water limitation
that was not observed in 2006 (Zona et al., 2011). The early season light stress and late season water stress (Supplement Fig. S4) were associated with a seasonal NSE close to zero in summer 2007.
During the final part of the season (17–31 August 2007), theSphagnumlayer showed a partial recovery, as shown by the C assimilation of NSE from 17–30 August (Fig. 2c). This occurred after a major rainfall in mid-August (9 mm), which increasedSphagnumWC (Supplement Fig. S3).
Table 2.Statistical results for the significance of the difference of net ecosystem exchange (NEE,F ratio=44.8, d.f.=7, 3788), gross pri-mary production (GPP,F ratio=214, d.f.=7, 7768), ecosystem respiration (Reco,Fratio=694.7, d.f.=7, 7768), netSphagnumexchange (NSE,Fratio=2.96, d.f.=7, 12), and leaf area index (LAI,Fratio=1.5, d.f.=5, 99), between 2006 and 2007 (one-way ANOVA including type III adjusted sums of squares, and Bonferroni post hoc test) for the indicate periods; NA indicates no data available. Descriptive data on the flux C components are displayed in Fig. 2.
Period NEE GPP Reco NSE LAI
12–30 June P< 0.001 P< 0.001 P=1 P=1 NA 1–26 July P=0.46 P< 0.001 P< 0.001 P=1 P=1 27 July–16 August P=0.408 P=0.008 P< 0.001 P=0.188 P=1 17–30 August P=0.568 P< 0.001 P< 0.001 P=1 P=1
Figure 2.Ecosystem functioning during summer in 2006 and 2007 at the Barrow Environmental Observatory, Alaska; (a)gross pri-mary production (GPP) and ecosystem respiration (Recodisplayed
as red hatched areas),(b)net ecosystem exchange (NEE),(c)net Sphagnumexchange (NSE), and (d)leaf area index (LAI), avaged for each of the indicated periods. Error bars are standard er-rors of the mean (for all samples). NA means no data available. Negative NEE and NSE represent a CO2sink, while positive val-ues represent C loss. The significance of differences between 2006 and 2007 values are reported in Table 2. Error bars for NEE,Reco, and GPP are propagated flux uncertainties estimated by online gap-filling (http://www.bgjena.mpg.de/~MDIwork/eddyproc/).
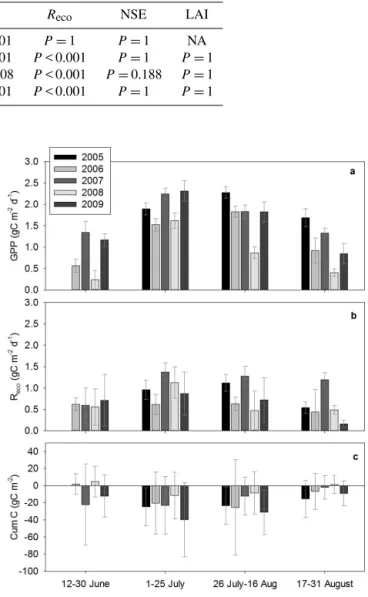
Figure 3.Gross primary production (GPP), ecosystem respiration (Reco), and net ecosystem exchange (NEE), for 2005–2009
dur-ing the indicated periods. Error bars for NEE,Reco, and GPP are
propagated flux uncertainties estimated by online gap-filling (http: //www.bgjena.mpg.de/~MDIwork/eddyproc/) for the indicated pe-riods.
CO2 source (2.3 g C m−2 in 2006), which suggests that the total summertime CO2 sink in 2005 was probably slightly lower than the measured value and therefore, fairly similar to both 2006 and 2007 summers. On the contrary, summer 2008, which experienced air temperatures and solar radiation near the long-term average (although slightly below normal summer precipitation), presented the lowest cumulative CO2 gain (14 g CO2m−2); less than 70 % that of summer 2006 (51 g CO2m−2). This reduction exceeded the typical contribution of mosses to the overall summer season CO2 sink (estimated to be about 40 % by Zona et al., 2011). The cumulative CO2sink was again substantial in summer 2009 (55 g CO2m−2from 12 June until 28 July).
To estimate the recovery of this wet sedge tundra ecosys-tem to the 2007 extreme summer event, we compared GPP,
Reco, and cumulative CO2uptake during the growing season
2005–2009. Total CO2uptake showed a five-year minimum in summer 2008 (Fig. 3), which was not the result of a higher
Reco(Fig. 3), but of a lower GPP (Fig. 3), the minimum over
the entire five-year record. During summer 2009, cumulative CO2uptake and GPP recovered to similar values to the sum-mers previous to the extreme event.
4 Discussion
The higher evaporative demand of the abnormal 2007 sum-mer affected theSphagnumlayer, as shown by the substan-tial moss desiccation.Sphagnum mosses do not have roots and rely on capillary transport of water between and within the short structure of their photosynthetic tissues (Price et al., 2009), and are therefore very sensitive to surface mois-ture conditions. These results suggest that a combination of unusually warm temperatures and high radiation input (both resulting in a greater evaporative demand) can negatively affect the functioning of a dominant vegetation component (e.g.,Sphagnumspp.) of this wet-sedge tundra ecosystem if precipitation (rainfall and dewfall) is also low.
However, even though visual inspection showed a substan-tial desiccation of the moss mat (Supplement Fig. S5), we do not think that our NSE measurements were able to ac-curately quantify the actual percentage of theSphagnum af-fected by and/or able to recover from the water stress. Im-portantly, the large variability and the small sample size of the NSE measurements resulted in no statistical difference in NSE between 2006 and 2007 for any of the periods tested when the stringent Bonferroni adjustment was used. Over-all, the substantial desiccation of theSphagnummat towards the end of summer 2007 (Supplement Fig. S5) was consis-tent with the observed water limitation of NSE (Supplement Fig. S4) and the decrease in ecosystem net CO2sink rates (Fig. 2). Vascular plants were not negatively affected by this unusual weather, as shown by the similar LAI in both 2006 and 2007 (Fig. 2). We therefore conclude that the substan-tial CO2sink during the last 2 weeks of June (negative NEE,
Fig. 2b) was due to an early activation of vascular plants in 2007, even though the LAI was still relatively low during this period (Fig. 2d). Vascular plant productivity then would also be supported by the soil water resulting from the relatively impermeable permafrost that would have impaired further lowering of the water table. With the release of meltwater from ice in the active layer, this perched water table pro-vided a continuous supply of water to the roots of vascular plants that was unavailable to the mosses (i.e., water depth at > 10 cm) when precipitation was sparse. This buffering wa-ter supply allowed the vascular plants to retain access to soil water. This also suggests that a drier climate could favor vas-cular plants and more negatively affect mosses in the Arctic due to relative desiccation of the mosses (Elmendorf et al., 2012; Lund et al., 2012).
Warming stimulated decomposition and nutrient turnover, resulting in higher NH+4 availability (Fig. 1). The higher mi-crobial biomass C and NH+4 availability during summer 2007 is consistent with the increased mineralization with higher temperatures reported for wet sedge tundra and subalpine heath tundra (Schmidt et al., 2002; Schmidt et al., 1999; Jonasson et al., 1999). In general, northern high-latitude ecosystems are nutrient limited (Chapin, 1980; Vitousek and Howarth, 1991; Sistla et al., 2012) and are therefore expected to respond quickly to increased nutrient availability (Schmidt et al., 1999; Jonasson et al., 1999). Consistent with this nu-trient (and temperature) limitation, we observed an increase in GPP during the extreme summer of 2007. However, in ad-dition to GPP,Reco was also greater in summer 2007 than in other years, resulting in a NEE comparable to the pvious colder and wetter summer. This is an important re-sult, because while temperature increase and drought are well known to affect both GPP andRecoin wetlands (Shurpali et
al., 1995; Arneth et al., 2002; Lafleur et al., 2003; Alm et al., 1999; Aurela et al., 2004; Lund et al., 2012), there are still large uncertainties about the impact of warming on the net C balance from tundra ecosystems (Ueyama et al., 2013). Overall, the similar net CO2sink during the extreme summer 2007 showed that vascular plants were able to compensate for the lack of functionality of mosses. Since vascular plants absorb nitrogen from the soil (Chapin, 1980; von Wiren et al., 1997; Miller and Cramer, 2005), while mosses, lacking a developed rooting system, mostly rely on atmospheric de-position of N or N2fixation by cyanobacteria (Vantooren et al., 1990; Solheim et al., 1996; Turetsky, 2003), it may be that the higher nitrogen availability in 2007 helped vascular plants to compensate for the reducedSphagnum productiv-ity during desiccation, at the same time as the lower water table limited N uptake by mosses (Ayres et al., 2006). A sim-ilar compensation was also observed in grassland ecosystems subjected to extreme events (Jentsch et al., 2011).
with the lower soil moisture (Supplement Figs. S1 and S2) and lower water availability in the moss layer (Supplement Figs. S3 and S4) during this extreme summer. In fact, mosses tightly control the heat transfer into the soil by serving as an effective insulator when dry (Luthin and Guymon, 1974; Hinzman et al., 1991) but are good conductors during cold, wet periods, thereby allowing permafrost to exist where mean annual air temperatures are as high as+2◦C
(Jorgen-son et al., 2010). The insulating properties of mosses when hot and dry can also decrease both annual and diurnal tem-perature fluctuations (Gornall et al., 2007; Nicolsky et al., 2007)
Contrary to our expectations, the minimum ecosystem CO2 sink and GPP were observed during the summer im-mediately following the extreme summer event. This is particularly surprising as arctic plants are well adapted to grow at low temperatures (Chapin, 1983, 1987; Koroleva, 1996). These results suggest that vascular plants experi-enced increased physiological activity in 2007 (Lichten-thaler, 1996) and might have had difficulties readjusting to the cooler, but typical, conditions after experiencing unusu-ally warm temperatures (Marchand et al., 2005; Marchand et al., 2006b). This interpretation is consistent with the ob-served de-hardening (i.e., loss of heat and cold resistance) af-ter exposure to extreme temperatures (Larcher, 2003; Marc-hand et al., 2006b). This de-hardening can follow both tem-perature extremes (i.e., low or high temtem-perature) and might result in a decrease in both heat and cold resistance of arctic plants (Larcher, 2003; Marchand et al., 2006b; Bokhorst et al., 2011). A de-hardening might potentially explain the low-est GPP in the year following the extreme summer, with a return to colder temperatures. The observed negative lag ef-fect, i.e., the reduced net CO2 sink and GPP in 2008, even with fairly typical summer air temperatures and precipita-tion, highlights the complexity of the response of this ecosys-tem to abnormal weather events. An alternative hypothesis is that during the extreme year, the increased mineralization rate and increased N availability resulted in increased GPP in vascular plants that offset the decreased moss GPP. But the following year, mosses had not yet recovered and GPP in vascular plants fell to typical levels, resulting in a decrease in stand GPP.
Lags in the response of net primary productivity (NPP) and CO2uptake by vegetation to high irradiance and low rainfall have already been highlighted at the global scale (Keeling et al., 1996), including in high-latitude (Potter et al., 1999; Zhang et al., 2013) and subalpine ecosystems (Merbold et al., 2012). Biomass and community composition in tundra ecosystems can also show a lagged response to warming due to the soil moisture deficit lasting at least 3 months after the end of warming (Sherry et al., 2011). However, in our study, the soil moisture deficit in summer 2007 did not result in low soil moisture in summer 2008 (Fig. S2), suggesting that other mechanisms might have been responsible for the low-est CO2 uptake and GPP in the summer following the
ex-treme event. In addition to the lag of ecosystem responses to climate variability,Recomight lag after increases in NPP in
tundra ecosystems, most likely due to the dynamics of recal-citrant vs. labile C in the soil (Clein et al., 2002). However, in this C-rich wet-sedge tundra ecosystem,Recopresented a rapid response to warming (with the highest values in sum-mer 2007).
The lowest over a five-year record GPP in 2008 might also be explained by the return of nutrients to lower concentra-tions while vegetation was still stressed by decreased carbo-hydrates reserves and mosses were affected by the desicca-tion experienced in summer 2007 (Supplement Fig. S5). The ecosystem proved to recover completely, at least in terms of its C balance, only two seasons after the extreme weather event, as shown by the similar NEE and GPP in summer 2009 and the summers of 2005 and 2006 (Fig. 3). The fact that the disturbance imposed on the system during the extreme year was only transitory and that a full recovery (at least in terms of NEE, and GPP) was observed in summer 2009 would im-ply that this wet-sedge tundra ecosystem is resilient to at least one isolated extreme event. However, additional longer-term studies are needed to investigate the impact of multiple sub-sequent extreme events and also potential changes in com-munity composition after disturbances (Wu et al., 2011).
5 Conclusions
Responses of NEE, GPP,Reco, and NSE inSphagnumimply
that ecosystem CO2sink strength in wet-sedge arctic tundra may not be immediately affected by extreme warm and clear summer weather (with high air temperatures, high evapora-tive demand, and low precipitation) such as in summer 2007. Instead, these wet sedge tundra ecosystems can exhibit a lag response where the decrease in CO2 sink strength does not occur until the following summer. Longer-term, comprehen-sive studies, are needed to refine our understanding of the processes responsible for this lag effect and to determine this ecosystem’s ability to readjust (or not) to typical conditions after experiencing extreme weather events. Here, we showed that the ecosystem was able to recover its photosynthetic capacity just two years after the occurrence of an extreme event. However, this study encompassed five years and in-cluded only one extreme event. It may be that additional sub-sequent extreme events are much more damaging, and should be quantified by additional longer-term studies.
Acknowledgements. We thank J. Verfaillie, R. Zulueta, H. Ikawa, P. Olivas, S. Oberbauer, and C. Tweedie for field, scientific, and technical assistance; G. Sheehan and the Barrow Arctic Science Consortium (BASC), UIC Science; C. Morales and CPS for logistic support; S. Hastings for his help in the management of the experiment; M. Reichstein and O. Menzer for help in the gap-filling and uncertainty analysis of the EC data; I. Nijs for the scientific discussion; and Frances Byrnes for editing the manuscript. The research was conducted on land owned by the Ukpea˙gvik Iñupiat Corporation (UIC). This work was funded by the Biocomplexity Program, Environment-Coupled Biogeochemical Cycles, and by the Office of Polar Programs of the National Science Foundation (NSF) (award no. 0421588), and would not have been possible without logistics support funded by the NSF Office of Polar Programs. Preparation of this paper was supported by the Carbon in Arctic Reservoirs Vulnerability Experiment (CARVE), an Earth Ventures (EV-1) investigation, under contract with the National Aeronautics and Space Administration and by NSF grant (award no. 1204263). We thank the EU for providing funding for traveling (Short-Term Scientific Mission – STSM) and for support of discussions on data analysis (COST Action ABBA ES0804). This manuscript benefited from the careful revision of three reviewers. Finally, we thank the EU Carbo-Extreme team for very helpful scientific discussions.
Edited by: M. Bahn
References
Alm, J., Schulman, L., Walden, J., Martikainen, P. J., and Silvola, J.: Carbon balance of a boreal bog during a year with an excep-tionally dry summer, Ecology, 80, 161–74, 1999.
Angert, A., Biraud, S., Bonfils, C., Henning, C. C., Buermann, W., Pinzon, J., Tucker, C. J., and Fung, I.: Drier summers cancel out the CO2sink enhancement induced by warmer springs, P. Natl. Acad. Sci. USA, 102, 10823–10827, 2005.
Arneth, A., Kurbatova, J., Kolle, O., Shibistova, O., Lloyd, J., Vygodskaya, N., and Schulze, E.-D.: Comparative ecosystem– atmosphere exchange of energy and mass in a European Russian and a central Siberian bog II. Interseasonal and interannual vari-ability of CO2fluxes, Tellus B, 54, 514–30, 2002.
Aurela, M., Laurila, T., and Tuovinen, J.-P.: The timing of snow melt controls the annual CO2balance in a subarctic fen, Geo-phys. Res. Lett., 31, L16119, doi:10.1029/2004GL020315, 2004. Ayres, E., van der Wal, R., Sommerkorn, M., and Bardgett, R. D.: Direct uptake of soil nitrogen by mosses, Biol. Lett., 2, 286–288, doi:10.1098/rsbl.2006.0455, 2006.
Billings, W. D., Luken, J.O., Mortensen, D. A. and Peterson, K. M.: Arctic tundra: A source or sink for atmospheric carbon dioxide in a changing environment?, Oecologia, 53, 7–11, 1982. Bokhorst S, Bjerke, J. W., Street, L. E., Callaghan, T. V., and
Phoenix, G. K.: Impacts of multiple extreme winter warm-ing events on sub-Arctic heathland: phenology, reproduction, growth, and CO2flux responses, Glob. Change Biol., 17, 2817– 2830, 2011.
Bokhorst, S., Huiskes, A., Aerts, R., Convey, P., Cooper, E. J., Dalen, L., Erschbamer, B., Gudmundsson, J., Hofgaard, A., Hol-lister, R. D., Johnstone, J., Jónsdóttir, I. S., Lebouvier, M., Van de Vijver, B., Wahren, C.-H., and Dorrepaal, E.,: Variable
tem-perature effects of Open Top Chambers at polar and alpine sites explained by irradiance and snow depth, Glob. Change Biol., 19, 64–74, 2013.
Brown, J.: Tundra soils formed over ice wedges, northern Alaska, Soil Sci. Soc. Am. Pro., 31, 686–691, 1967.
Brown, J., Hinkel, K. M., and Nelson, F. E.: The circumpolar active layer monitoring (CALM) program: Research designs and initial results, Polar Geogr., 24, 166–258, 2000.
Chapin, F. S.: The Mineral-Nutrition of Wild Plants, Annu. Rev. Ecol. Syst., 11, 233–260, doi:10.1146/annurev.es.11.110180.001313, 1980.
Chapin III, F. S.: Direct and indirect effects of temperature on arctic plants, Polar Biol., 2, 47–52, 1983.
Chapin III, F. S.: Environmental controls over growth of tundra plants, Ecol. Bull., 38, 69–76, 1987.
Chen, J. M., Chen, B., Higuchi, K., Liu, J., Chan, D, Worthy, D., Tans, P. and Black, A.: Boreal ecosystems sequestered more carbon in warmer years, Geophys. Res. Lett., 33, L10803, doi:10.1029/2006gl025919, 2006.
Clein, J. S., Kwiatkowski, B. L., McGuire, A. D., Hobbie, J. E., Rastetter, E. B., Melillo, J. M., and Kicklighter, D. W.: Mod-elling carbon responses of tundra ecosystems to historical and projected climate: a comparison of a plot- and a global-scale ecosystem model to identify process-based uncertainties, Glob. Change Biol., 6, 127–140, 2000.
Dorrepaal, E., Toet, S., van Logtestijn, R. S. P., Swart, E., van de Weg, M. J., Callaghan, T. V., and Aerts, R.: Carbon respiration from subsurface peat accelerated by climate warming in the sub-arctic, Nature, 460, 616–619, 2009.
Elmendorf, S. C., Henry G. H. R, Hollister, R. D., Bjork, R. G., Bjorkman, A. D., Callaghan, T. V., Collier, L. S., Cooper, E. J., Cornelissen, J. H. C., Day, T. A., Fosaa, A. M., Gould, W. A., Gretarsdottir, J., Harte, J., Hermanutz, L., Hik, D. S., Hof-gaard, A., Jarrad F. Jonsdottir, I. S., Keuper, F., Klanderud K., Klein, J. A., Koh, S., Kudo, G., Lang, S. I, Loewen, V., May, J. L., Mercado, J., Michelsen, A., Molau, U., Myers-Smith I. H., Oberbauer S. F., Pieper S., Post, E., Rixen, C., Robinson, C. H., Schmidt, N. M., Shaver, G. R., Stenstrom, A., Tolvanen, A., Tot-land, O., Troxler, T., Wahren C. H., Webber, P. J., Welker, J. M., and Wookey, P. A.: Global assessment of experimental cli-mate warming on tundra vegetation: heterogeneity over space and time, Ecol. Lett., 15, 164–175, 2012.
Epstein, H. E., Raynolds, M. K., Walker, D. A., Bhatt, U. S., Tucker, C. J., and Pinzon, J. E.: Dynamics of aboveground phytomass of the circumpolar Arctic tundra during the past three decades, En-viron. Res. Lett., 7, 015506 doi:10.1088/1748-9326/7/1/015506, 2012.
Gerdol, R. and Vicentini, R.: Response to heat stress of populations of two Sphagnum species from alpine bogs at different altitudes, Environ. Exp. Bot., 74, 22–30, doi:10.1016/j.envexpbot.2011.04.010, 2011.
Gornall, J. L., Jónsdóttir, I. S., Woodin, S. J., and Van der Wal, R.: Arctic mosses govern belowground environment and ecosystem processes, Oecologia, 153, 931–941, 2007.
Harley, P. C., Tenhunen, J. D., Murray, K. J., and Beyers, J.: Irradi-ance and temperature effects on photosynthesis of tussock tundra Sphagnum mosses from the foothills of the Philip Smith moun-tains, Alaska, Oecologia, 79, 251–259, doi:10.1007/bf00388485, 1989.
Hinkel, K. M., Paetzold, R. F., Nelson, F. E., and Bockheim, J. G.: Patterns of soil temperature and moisture in the active layer and upper permafrost at Barrow, Alaska: 1993–1999, Global Planet. Change, 29, 293–309, 2001.
Hinzman, L. D., Kane, D. L., Benson, C. S., and Everett, K. R.: Hy-drologic and thermal properties of the active layer in the Alaskan Arctic, Cold Reg. Sci. Technol., 19, 95–110, 1991.
Hsieh, C. I., Katul, G., and Chi, T.: An approximate analytical model for footprint estimation of scalar fluxes in thermally strat-ified atmospheric flows, Adv. Water Res., 23, 765–772, 2000. IPCC: Summary for Policymakers. In: Climate Change 2013: The
Physical Science Basis. Contribution of Working Group I to the Fifth Assessment Report of the Intergovernmental Panel on Cli-mate Change, edited by: Stocker, T. F., Qin, D., Plattner, G.-K., Tignor, M., Allen, S. K., Boschung, J., Nauels, A., Xia, Y., Bex, V., and Midgley, P. M., Cambridge University Press, Cambridge, United Kingdom and New York, NY, USA, 2013.
Jentsch, A., Kreyling, J., and Beierkuhnlein, C.: A new generation of climate-change experiments: events, not trends, Front. Ecol. Environ., 5, 365–374, 2007.
Jentsch, A., Kreyling, J., Elmer, M., Gellesch, E., Glaser, B., Grant, K., Hein, R., Lara, M., Mirzae, H., Nadler, S. E., Nagy, L., Otieno, D., Pritsch, K., Rascher, U., Schädler, M., Schloter, M., Singh, B. K., Stadler, J., Walter, J., Wellstein, C., Wöllecke, J., and Beierkuhnlein C.: Climate extremes initiate ecosystem-regulating functions while maintaining productivity, J. Ecol., 99, 689–702, 2011.
Jonasson, S., Michelsen, A., and Schmidt, I. K.: Coupling of nu-trient cycling and carbon dynamics in the Arctic, integration of soil microbial and plant processes, Appl. Soil Ecol., 11, 135–146, 1999.
Jones, B. M., Kolden, C. A., Jandt, R. R., Abatzoglou, J. T., Urban, F., and Arp, C. D. : Fire behavior, weather, and burn severity of the 2007 Anaktuvuk River tundra fire, North Slope, Alaska, Arct. Antarct. Alp. Res., 41, 309–316, doi:10.1657/1938-4246-41.3.309, 2009.
Jorgenson, M. T., Romanovsky, V., Harden, J., Shur, Y., O’Donnell, J., Schuur, E. A. G., Kanevskiy, M., and Marchenko, S.: Re-silience and vulnerability of permafrost to climate change, Can. J. Forest Res., 40, 1219–1236, 2010.
Keeling, C. D., Chin, J. F. S., and Whorf, T. P.: Increased activity of northern vegetation inferred from atmospheric CO2 measure-ments, Nature, 382, 146–149, 1996.
Kljun, N., Calanca, P., Rotach, M. W., and Schmid H. P.: A sim-ple parameterisation for flux footprint predictions, Bound.-Lay. Meteorol., 112, 503–523, 2004.
Koroleva, O. Y.: Cold acclimation of the photosynthetic apparatus in an arctic species,Oxyria digyna, Russ. J. Plant Physiol., 43, 319–324, 1996.
Lafleur, P. M., Roulet, N. T., Bubier, J. L., Frolking, S., and Moore, T. R.: Interannual variability in the peatland–atmosphere carbon dioxide exchange at an ombrotrophic bog, Glob. Biogeochem. Cy., 17, 1036–1049, 2003.
Larcher, W.: Physiological plant ecology. Ecophysiology and stress physiology of functional groups, Heidelberg, Berlin, Germany, Springer-Verlag, 2003.
Lasslop, G., Reichstein, M., Papale, D., Richardson, A. D., Ar-neth, A., Barr, A., Stoy, P., and Wohlfahrt, G.: Separation of net ecosystem exchange into assimilation and respiration using a light response curve approach, critical issues and global evalu-ation, Glob. Change Biol., 16, 187–208, 2010.
Lichtenthaler, H. K.: Vegetation Stress: an Introduction to the stress concepts in plants, J. Plant Physiol., 148, 4–14, 1996.
Liljedahl, A. K., Hinzman, L. D., Harazono, Y., Zona, D., Tweedie, C., Hollister, R. D., Engstrom, R., and Oechel, W. C.: Nonlinear controls on evapotranspiration in arctic coastal wetlands, Biogeo-sciences, 8, 3375–3389, doi:10.5194/bg-8-3375-2011, 2011. Lipson, D. A., Zona, D., Raab, T. K., Bozzolo, F., Mauritz, M., and
Oechel, W. C.: Water-table height and microtopography control biogeochemical cycling in an Arctic coastal tundra ecosystem, Biogeosciences, 9, 577–591, doi:10.5194/bg-9-577-2012, 2012. Lund, M., Christensen, T. R., Lindroth, A., and Schubert, P.: Effects of drought conditions on the carbon dioxide dynam-ics in a temperate peatland, Environ. Res. Lett., 7, 045704, doi:10.1088/1748-9326/7/4/045704, 2012.
Luthin, J. N. and Guymon, G. L.: Soil moisture-vegetation-temperature relationship in central Alaska, J. Hydrol., 23, 233– 246, 1974.
Marchand, F. L., Mertens, S., Kockelbergh, F., Beyens, L., and Nijs, I.: Performance of High Arctic tundra plants improved during but deteriorated after exposure to a simulated extreme temperature event, Glob. Change Biol., 11, 2078–2089, doi:10.1111/j.1365-2486.2005.01046.x, 2005.
Marchand, F. L., Verlinden, M., Kockelbergh, F., Graae, B. J., Beyens, L., and Nijs I.: Disentangling effects of an experimen-tally imposed extreme temperature event and naturally associated desiccation on Arctic tundra, Funct. Ecol., 20, 917–928, 2006a. Marchand, F. L., Kockelbergh, F., Van De Vijver, B., Beyens, L., and
Nijs, I.: Are heat and cold resistance of arctic species affected by successive extreme temperature events?, New Phytol., 170, 291– 300, 2006b.
Merbold, L., Rogiers, N., Eugster, W.: Winter CO2fluxes in a sub-alpine grassland in relation to snow cover, radiation and temper-ature, Biogeochemistry, 111, 287–302, 2012.
Miller, A. J. and Cramer, M. D.: Root nitrogen acquisition and as-similation, Plant Soil, 274, 1–36, doi:10.1007/s11104-004-0965-1, 2005.
Monteith, J. L.: Vegetation and the atmosphere, vol. 1: Principles, Academic Press, London, 1975.
Nicolsky, D. J., Romanovsky, V. E., Alexeev, V. A., and Lawrence, D. M.: Improved modeling of permafrost dynamics in a GCM land-surface Scheme, Geophys. Res. Lett., 34, L08501, doi:10.1029/2007GL029525, 2007.
Oechel, W. C.: Seasonal patterns of temperature response of CO2 flux and acclimation in arctic mosses growing in situ, Photosyn-thetica, 10, 447–456, 1976.
Oechel, W. C., Vourlitis, G. L., Hastings, S. J., and Bochkarev, S. A.: Change in Arctic CO2flux-over two decades: Effects of climate change at Barrow, Alaska, Ecol. Appl., 5, 846–855, 1995. Oechel, W. C., Laskowski, C. A., Burba, G., Gioli, B., and Kalhori,
A. A. M.: Annual patterns and budget of CO2flux in an Alaskan arctic tussock tundra ecosystem at Atqasuk, Alaska, J. Geophys. Res., 119, 323–339, doi:10.1002/2013JG002431, 2014. Olivas, P. C., Oberbauer, S. F., Tweedie, C., Oechel, W. C., and
Kuchy, A.: Responses of CO2 flux components of Alaskan Coastal Plain tundra to shifts in water table, J. Geophys. Res., 115, G00I05, doi:10.1029/2009jg001254, 2010.
Olivas, P. C. Oberbauer, S. F., Tweedie, C. Oechel, W. C., Lin, D., and Kuchy, A.: Effects of Fine-Scale Topography on CO2Flux Components of Alaskan Coastal Plain Tundra: Response to Con-trasting Growing Seasons, Arct. Antarct. Alp. Res., 43, 256–266, 2011.
Perkins, S. E., Alexander, L. V., and Nairn, J. R.: Increas-ing frequency, intensity and duration of observed global heat-waves and warm spells, Geophys. Res. Lett., 39, L20714, doi:10.1029/2012GL053361, 2012.
Peterson, K. M., Billings, W. D., and Reynolds, D. N.: Influence of Water Table and atmospheric CO2Concentration on the Carbon Balance of Arctic Tundra, Arct. Antarct. Alp. Res., 16, 331–335, 1984.
Piao, S., Ciais, P., Friedlingstein, P., Peylin, P., Reichstein, M., Luyssaert, S., Margolis, H., Fang, J., Barr, A., Chen, A., Grelle, A., Hollinger, D. Y., Laurila, T., Lindroth, A., Richardson, A. D., and Vesala, T.: Net carbon dioxide losses of northern ecosystems in response to autumn warming, Nature, 451, 49–52, 2008. Potter, C. S., Klooster, S., and Brooks, V.: Interannual Variability
in Terrestrial Net Primary Production: Exploration of Trends and Controls on Regional to Global Scales, Ecosystems, 2, 36–48, 1999.
Price, J., Edwards, T. W. D., Yi, Y., and Whittington, P. N.: Physi-cal and isotopic characterization of evaporation from Sphagnum moss, J. Hydrol., 369, 175–182, 2009.
Reichstein, M., Falge, E., Baldocchi, D., Papale, D., Aubinet, M., Berbigier, P., Bernhofer, C., Buchmann, N., Gilmanov, T., Granier, A., Grünwald, T., Havránková, K., Ilvesniemi, H., Janous, D., Knohl, A., Laurila, T., Lohila, A., Loustau, D., Mat-teucci, G., Meyers, T., Miglietta, F., Ourcival, J.-M., Pumpanen, J., Rambal, S., Rotenberg, E., Sanz, M., Tenhunen, J., Seufert, G., Vaccari, F., Vesala, T., Yakir, D., and Valentini, R.: On the separa-tion of net ecosystem exchange into assimilasepara-tion and ecosystem respiration, review and improved algorithm, Glob. Change Biol., 11, 1424–1439, 2005.
Riutta, T., Laine, J., and Tuittila, E.-S.: Sensitivity of CO2exchange of fen ecosystem components to water level variation, Ecosys-tems, 10, 718–733, 2007.
Runkle, B. R. K., Sachs, T., Wille, C., Pfeiffer, E.-M., and Kutzbach, L.: Bulk partitioning the growing season net ecosystem ex-change of CO2in Siberian tundra reveals the seasonality of its carbon sequestration strength, Biogeosciences, 10, 1337–1349, doi:10.5194/bg-10-1337-2013, 2013.
Schmidt, I. K., Jonasson, S., and Michelsen, A.: Mineralization and microbial immobilization of N and P in arctic soils in relation to season, temperature and nutrient amendment, Appl. Soil Ecol., 11, 147–160, 1999.
Schmidt, I. K., Jonasson, S., Shaver, G. R., Michelsen, A., and Nordin, A.: Mineralization and distribution of nutrients in plants and microbes in four arctic ecosystems: responses to warming, Plant Soil, 242, 93–106, 2002.
Sheffield, J., Wood, E. F., and Roderick, M. L.: Little change in global drought over the past 60 years, Nature, 491, 435–438, 2012.
Sherry, R. A., Zhou, X. H., Gu, S. L., Arnone, J. A., Johnson, D. W., Schimel, D. S., Verburg, P. S. J., Wallace, L. L., and Luo, Y. Q.: Changes in duration of reproductive phases and lagged phenological response to experimental climate warming, Plant Ecol. Divers., 4, 23–35, 2011.
Shurpali, N. J., Verma, S. B., Kim, J., and Arkebauer, T. J.: Carbon dioxide exchange in a peatland ecosystem, J. Geophys. Res., 100, 14319–14326, 1995.
Sistla, S. A., Asao, S., and Schimel, J. P.: Detecting microbial N-limitation in tussock tundra soil: implications for Arctic soil or-ganic carbon cycling, Soil Biol. Biochem., 55, 78–84, 2012. Solheim, B., Endal, A., and Vigstad, H.: Nitrogen fixation in Arctic
vegetation and soils from Svalbard, Norway, Polar Biol., 16, 35– 40, 1996.
Sturtevant, C. S., Oechel, W. C., Zona, D., Kim, Y., and Emerson, C. E.: Soil moisture control over autumn season methane flux, Arctic Coastal Plain of Alaska, Biogeosciences, 9, 1423–1440, doi:10.5194/bg-9-1423-2012, 2012.
Tieszen, L. L., Miller, P. C., Lewis, M. C., Mayo, J., Chapin III, F. S., and Oechel, W. C.: An analysis of processes of primary pro-duction in tundra growth forms, in: Tundra ecosystems: a com-parative analysis, edited by: Bliss L. C., Heal O. W., and Moore J. J., Cambridge Univ. Press, 285–356, 1981.
Turetsky, M. R.: Bryophytes in carbon and nitrogen cycling, New Frontiers in Bryology and Lichenology, The Bryologist, 106, 395–409, 2003.
Ueyama, M., Iwata, H., Harazono, Y., Euskirchen, E. S., Oechel, W. C., and Zona, D.: Growing season and spatial variations of carbon fluxes of Arctic and boreal ecosystems in Alaska (USA), Ecol Appl., 8, 1798–1816, 2013.
Vantooren, B. F., Vandam, D., and During, H. J.: The Relative Importance of Precipitation and Soil as Sources of Nutrients for Calliergonella-Cuspidata (Hedw) Loeske in Chalk Grassland, Funct. Ecol., 4, 101–107, 1990.
Vavrus, S., Holland, M. M., Jahn, A., Bailey, D. A., and Blazey, B. A.: Twenty-First-Century Arctic climate change in CCSM4, J. Climatol., 25, 2696–2710, doi:10.1175/JCLI-D-11-00220.1, 2012.
Vitousek, P. M. and Howarth R. W.: Nitrogen Limitation on Land and in the Sea – How Can It Occur?, Biogeochemistry, 13, 87– 115, 1991.
von Wiren, N., Gazzarrini, S., and Frommer, W. B.: Regulation of mineral nitrogen uptake in plants, Plant Soil, 196, 191–199, doi:10.1023/a:1004241722172, 1997.
experimental warming across the tundra biome, P. Natl. Acad. Sci. USA, 103, 1342–1346, 2006.
Webb, E. K., Pearman, G. I., and Leuning, R.: Correction of flux measurements for density effects due to heat and wa-ter vapour transfer, Q. J. R. Meteorol. Soc., 106, 85–100, doi:10.1002/qj.49710644707, 1980.
Wilson, W.: Observations on the temperatures of arctic plants and their environment, J. Ecol., 45, 499–531, 1957.
Wookey, P. A., Aerts, R., Bardgett, R. D., Baptist, F., Bråthen, K. A., Cornelissen, J. H. C., Gough, L., Hartley, I. P., Hopkins, D. W., Lavorel, S., and Shaver, G. R.: Ecosystem feedbacks and cascade processes: understanding their role in the responses of arctic and alpine ecosystems to environmental change, Glob. Change Biol., 15, 1153–1172; doi:10.1111/j.1365-2486.2008.01801.x, 2009. Wu, Z., Dijkstra, P., Koch, G. W., Peñuelas, J., and Hungate,
B. A.: Responses of terrestrial ecosystems to temperature and precipitation change: a meta-analysis of experimental manip-ulation, Glob. Change Biol., 17, 927–942, doi:10.1111/j.1365-2486.2010.02302.x, 2011.
Yang, D., Goodison, B. E., and Ishida, S.: Adjustment of daily pre-cipitation data of 10 climate stations in Alaska: Applications of world meteorological organization intercomparison results, Wa-ter Resour. Res., 34, 241–256, 1998.
Zhang, X., Gurney, K. R. , Peylin, P., Chevallier, F., Law, R. M., Patra, P. K., Rayner, P. J., Röedenbeck, C., and Krol, M.: On the variation of regional CO2exchange over temperate and bo-real North America, Global Biogeochem. Cy., 27, 991–1000, doi:10.1002/gbc.20091, 2013.
Zhao, M. and Running, S. W.: Drought-Induced Reduction in Global Terrestrial Net Primary Production from 2000 through 2009, Science, 329, 940–943, doi:10.1126/science.1192666, 2010.
Zhou, L. M., Tucker, C. J., Kaufmann, R. K., Slayback, D., Sha-banov, N. V., and Myneni, R. B.: Variations in northern vegeta-tion activity inferred from satellite data of vegetavegeta-tion index dur-ing 1981 to 1999, J. Geophys. Res. 106, 20069–20083, 2001. Zona, D., Oechel, W. C., Kochendorfer, J., Paw U, K. T., Salyuk, A.
N., Olivas, P. C., Oberbauer, S. F., and Lipson, D. A.: Methane fluxes during the initiation of a large-scale water table manip-ulation experiment in the Alaskan Arctic tundra, Global Bio-geochem. Cy., 23, GB2013, doi:10.1029/2009GB003487, 2009. Zona, D., Oechel, W. C., Richards, J. H., Hastings, S., Kopetz, I., Ikawa, H., and Oberbauer, S.: Light-stress avoidance mech-anisms in a Sphagnum-dominated wet coastal Arctic tundra ecosystem in Alaska, Ecology, 92, 633–644, doi:10.1890/10-0822.1, 2011.