Mutation in Influenza A/H1N1 2009 by Single Base Pair
RT-PCR and High-Resolution Melting
Steven Y. C. Tong1,2*, Farshid Dakh1, Aeron C. Hurt3, Yi-Mo Deng3, Kevin Freeman4, Peter K. Fagan4, Ian G. Barr3, Philip M. Giffard1
1Menzies School of Health Research, Charles Darwin University, Darwin, Northern Territory, Australia,2Infectious Diseases Department, Royal Darwin Hospital, Darwin, Northern Territory, Australia,3World Health Organization Collaborating Centre for Reference and Research on Influenza, Melbourne, Victoria, Australia,4Northern Territory Government Pathology Service Microbiology Laboratory, Royal Darwin Hospital, Darwin, Northern Territory, Australia
Abstract
Introduction:We aimed to design a real-time reverse-transcriptase-PCR (rRT-PCR), high-resolution melting (HRM) assay to detect the H275Y mutation that confers oseltamivir resistance in influenza A/H1N1 2009 viruses.
Findings:A novel strategy of amplifying a single base pair, the relevant SNP at position 823 of the neuraminidase gene, was chosen to maintain specificity of the assay. Wildtype and mutant virus were differentiated when using known reference samples of cell-cultured virus. However, when dilutions of these reference samples were assayed, amplification of non-specific primer-dimer was evident and affected the overall melting temperature (Tm) of the amplified products. Due to
primer-dimer appearance at.30 cycles we found that if the cycle threshold (CT) for a dilution was.30, the HRM assay did
not consistently discriminate mutant from wildtype. Where the CTwas,30 we noted an inverse relationship between CT
and Tm and fitted quadratic curves allowed the discrimination of wildtype, mutant and 30:70 mutant:wildtype virus
mixtures. We compared the CTvalues for a TaqMan H1N1 09 detection assay with those for the HRM assay using 59 clinical
samples and demonstrated that samples with a TaqMan detection assay CT.32.98 would have an H275Y assay CT.30.
Analysis of the TaqMan CTvalues for 609 consecutive clinical samples predicted that 207 (34%) of the samples would result
in an HRM assay CT.30 and therefore not be amenable to the HRM assay.
Conclusions:The use of single base pair PCR and HRM can be useful for specifically interrogating SNPs. When applied to H1N1 09, the constraints this placed on primer design resulted in amplification of primer-dimer products. The impact primer-dimer had on HRM curves was adjusted for by plotting Tmagainst CT. Although less sensitive than TaqMan assays,
the HRM assay can rapidly, and at low cost, screen samples with moderate viral concentrations.
Citation:Tong SYC, Dakh F, Hurt AC, Deng Y-M, Freeman K, et al. (2011) Rapid Detection of the H275Y Oseltamivir Resistance Mutation in Influenza A/H1N1 2009 by Single Base Pair RT-PCR and High-Resolution Melting. PLoS ONE 6(6): e21446. doi:10.1371/journal.pone.0021446
Editor:Leo L. M. Poon, University of Hong Kong, Hong Kong
ReceivedApril 5, 2011;AcceptedMay 27, 2011;PublishedJune 24, 2011
Copyright:ß2011 Tong et al. This is an open-access article distributed under the terms of the Creative Commons Attribution License, which permits unrestricted use, distribution, and reproduction in any medium, provided the original author and source are credited.
Funding:ST is supported by an Australian National Health and Research Council Post-doctoral training fellowship (605829). The funders had no role in study design, data collection and analysis, decision to publish, or preparation of the manuscript.
Competing Interests:The authors have declared that no competing interests exist. * E-mail: Steven.tong@menzies.edu.au
Introduction
During the influenza A/H1N1 2009 pandemic the widespread use of oseltamivir has been a key component of efforts to treat individual patients and provide prophylaxis for those at risk. Of concern there are now not only isolated reports of detection of oseltamivir resistant virus [1,2,3] but also evidence of emergence of oseltamivir-resistance during prophylaxis [4] and community clusters of cases [5]. To date, documented oseltamivir resistant influenza A/H1N1 2009 viruses carry a single nucleotide polymorphism (SNP) at position 823 (cytosine to thymine) of the neuraminidase gene which results in a histidine to tyrosine substitution at position 275 [6]. Detection of resistant virus is usually performed by phenotypic assays such as neuraminidase inhibition assays, or by sequencing of viral nucleic acid [7]. These assays are time consuming and often restricted to reference and
research laboratories. In addition, they can lack sensitivity when there is insufficient viral concentration in clinical samples, or in the case of the phenotypic assay require a cultured isolate.
curves of variation in starting RNA template quality and quantity in clinical samples. This report describes a SYBR green based real-time reverse transcription PCR (rRT-PCR) followed by HRM analysis to detect the H275Y mutation and the methodologies to address the challenges observed.
Methods
Ethics statement
The conduct of this study was approved by the Human Research Ethics Committee (HREC) of the Northern Territory Department of Health & Families and Menzies School of Health Research (HREC reference number 09/79). The HREC deemed that individual consent was not required from patients as there was no collection of identifying information in association with the samples used.
Reference samples
Five oseltamivir sensitive influenza A/H1N1 2009 viral samples (A/Victoria/2048/2009, A/Victoria/2116/2009, A/Denmark/ 524/2009, A/Perth/184/2009, A/Brisbane/108/2009) and five samples that contained oseltamivir resistant (H275Y) virus (A/ Osaka/180/2009, A/Perth/268/2009, A/Victoria/3132/2009, A/Denmark/528/2009, A/Perth/262/2009) were used as refer-ence samples. Pyrosequencing and neuraminidase inhibition assays were used to detect the presence and relative mix of H275Y mutant strains [9]. To determine the specificity of the HRM assay for influenza A/H1N1 2009 we used five influenza A/ H1N1 seasonal (non 2009) and three influenza A/H3N2 as negative control strains. RNA was extracted by the Roche MagNaPure LC protocol (Roche Diagnostics Australia, Castle Hill, NSW, Australia). The HRM assay was tested against 10-fold serial dilutions of extracted RNA from wildtype and mutant influenza A/H1N1 2009 samples and mixtures of mutant:wildtype virus at 10:90 and 30:70 ratios. Starting concentrations of RNA were quantified by using absorption of light at 260 and 280 nm (A260/280) with a Biowave DNA spectrophotometer (Biochrom WPA, Blackburn, Victoria, Australia).
Clinical specimens
We validated the HRM assay on 69 influenza positive clinical samples from the Royal Darwin Hospital. Samples were obtained from patients with an influenza-like illness between June 1 to August 30 2009 by nose and throat swabs. Swabs were placed in viral transport medium and RNA extracted by the Roche MagNaPure LC protocol. All samples were tested with TaqMan assays targeting the influenza A matrix gene and, if positive, subsequently targeting the haemaglutinin gene of influenza A/ H1N1 2009 [10]. Of the 69 samples, 59 were influenza A/H1N1 2009, 3 were influenza A/H1N1 seasonal, and 7 were influenza A/H3N2.
HRM assay design and protocol
We designed primers specific for influenza A/H1N1 2009 based on sequences of the NA gene downloaded from the National Center of Biotechnology Information from September 2009. A novel strategy of only amplifying a single base pair, the SNP at position 823, was chosen to maintain the specificity of the HRM assay. We were concerned that if the amplified region was extended, other sequence variations in the region of position 823 would non-specifically alter the melting temperature and melting curve. The primers were: H275Y F: 59 GTCAAATCAGTC-GAAATGAATGCCCCTAATTAT and H275Y R: 59 GGA-TAACAGGAGCATTCCTCATAGT. The resulting product was
predicted to have a lower melting temperature (Tm) in the
presence of a thymine (mutant) compared to a cytosine (wildtype) at position 823. These primers were predicted to form cross-dimers with a free energy (DG) of 210.09 (http://www. premierbiosoft.com/netprimer/index.html) and shortening or lengthening the primers did not appreciably reduce the likelihood of cross-dimer formation. We decided that the need for specificity of the HRM assay, and thus constraints upon primer positioning, would likely outweigh problems caused by potential primer-dimer formation.
We used a step-down PCR amplification method to improve specificity. Each reaction contained 5mL QuantiFast SYBR
Green RT-PCR Kit master mix (Qiagen, Doncaster, Victoria, Australia), 0.5mM of each primer, 1mL RT-mix and 1mL RNA
template in a final volume of 10mL. The real-time PCR thermocycling parameters were: 50uC for 10 min, 95uC for 5 min; 4 sets of 2 cycles each of 95uC for 2 s and decreasing annealing temperatures from 68uC to 62uC in 2uC decrements for 6 s; 27 cycles of 95uC for 2 s, 60uC for 6 s; and 50uC for 20 s; followed by HRM ramping from 69uC to 79uC with fluorescence data acquisition at 0.2uC increments. The total reaction time was 62 minutes. Reactions were performed on a Rotor-Gene 6000 (Corbett Life Science, Concorde, NSW, Australia) instrument. These can no longer be purchased, but the QIAGEN Rotor-Gene Q devices are essentially identical.
Statistical analysis
Raw data were exported from the Corbett Rotor-Gene 6000 software v.1.7 into Microsoft Excel 2007 (Microsoft, Redmond, Washington, USA) and Stata 10.1 (StataCorp LP, Texas, USA) for graphical and statistical analysis.
Results
Assay design and proof of principle using dilutions of reference samples
We initially tested the assay using dilutions of reference samples with wildtype (A/Victoria/2048/2009) and mutant (A/Osaka/ 180/2009) viruses. The cycle thresholds (CT) for the serial 10-fold
dilutions were as predicted for such a series (Fig. 1A). It was also evident that non-specific primer-dimer amplification occurred as demonstrated by the presence of amplification products after cycle 30 in no-template controls and non influenza A/H1N1 2009 controls. Although the undiluted samples could be clearly differentiated based on the Tm and normalized fluorescence
curves, there was overlap in the normalized fluorescence curves when comparing a 1024 dilution of wildtype and the undiluted mutant containing sample (Fig. 1B). The presence of primer-dimer explains the downward Tmshift with reducing
concentra-tions of template RNA (Fig. 1B). The primer-dimer product has a lower Tmcompared to the desired amplification product. As the
concentration of template RNA decreases, the proportional representation of end product due to primer-dimer increases, and therefore the overall Tm of the end product is decreased.
Addition of Q solution (Qiagen Australia, Doncaster, Victoria, Australia) eliminated the detectable amplification of primer-dimers but significantly reduced the sensitivity of the amplification and resulted in less reproducible determination of the Tmvalues (data
not shown). We concluded that the assay is more robust in the absence of Q solution and that the constraints upon primer placement made primer-dimer formation inevitable.
We therefore made allowance for the appearance of primer-dimer at.30 cycles by two means. We deemed that if the CTfor a
discriminate mutant from wildtype. Therefore the lower limit of detection of the assay was a 1024 dilution of a starting RNA concentration of virus of 6.1 ng/mL that is the equivalent of 105
gene copies/mL (Fig. 1A). We also noted the consistent inverse
relationship between Tmand CT; samples with lower
concentra-tions of RNA and a higher CTalso had a lower Tm(Fig. 1A). We
adjusted for this by plotting Tmagainst CT. The fitted quadratic
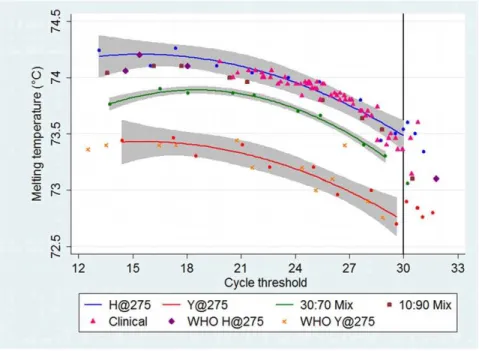
curves with 95% confidence intervals for wildtype and mutant containing samples, and also 30:70 mutant virus mixtures, could now easily be discriminated (Fig. 2). The quadratic curve for the Figure 1. Relationship between cycle threshold and melting temperature.The relationship between cycle threshold (CT) and melting temperature (Tm) demonstrated by ten-fold serial dilutions of wildtype (H) (A/Victoria/2048/2009) and mutant (Y) (A/Osaka/180/2009) virus samples.
A.The CTincreases as the RNA template concentration decreases. The no template control (NTC) demonstrates late amplification after cycle 30, indicating the presence of primer-dimer.B.The Tmon the high-resolution melting normalized fluorescence graph decreases as the RNA template concentration decreases. The NTC melts at the lowest temperature. As the amplified product contains increasing proportions of the primer-dimer, the overall Tmis pulled towards that of the primer-dimer.
30:70 mix serves as a useful cut-off; points lying above this line will contain a minority of mutant virus, and points below this line will contain a significant proportion of mutant virus.
Validation with additional defined reference samples
Using these methods, eight blinded reference samples were correctly called; three were wildtype and five mutant containing samples. This included one sample that plotted above the mutant curve but below the 30:70 mixture curve. Pyrosequencing of this sample revealed a 34:66 mutant:wildtype mixture. The raw data of CTand Tmof these reference samples is provided (Results S1).
Validation with clinical sample material
We excluded clinical samples from the Royal Darwin Hospital that had an influenza A/H1N1 2009 Taqman detection assay [10] CT.35 as we considered that there would unlikely be enough
RNA present in these samples for the H275Y assay. Subsequently we randomly selected 59 clinical samples that had been determined to have an influenza A/H1N1 2009 TaqMan detection assay CTranging from 22.52 to 32.95. The
correspond-ing range of H275Y assay CTwas 19.8 to 30.77. Fifty-six clinical
samples were predicted to be wildtype (Fig. 2), of which 28 were pyrosequenced and confirmed as such. Three samples (with TaqMan detection assay CT of 29.81, 31.01 and 31.15) had
H275Y assay CT.30 for which we considered the HRM assay
would not be robust due to the poor amplification. The Pearson correlation coefficient for the CT of the two assays was 0.92
(P,0.0001). Linear regression analysis predicted that samples with a TaqMan detection assay CT.32.98 would have an H275Y assay
CT.30. We reviewed the TaqMan assay CTfor 609 consecutive
positive clinical samples at the Royal Darwin Hospital and found that the HRM assay would be predicted to have a CT.30 in 34%
(207 of 609) of clinical samples. All ten non influenza A/H1N1 2009 controls had a CTof.30 cycles.
Discussion
We have developed and evaluated a rRT-PCR HRM diagnostic assay to detect oseltamivir resistance due to the H275Y mutation in H1N1 2009 influenza viruses. Other RT-PCR assays to detect H275Y in influenza make use of various techniques including RT-PCR followed by restriction fragment length polymorphism [11], discrimination based on amplification curves with fluorescent TaqMan probes [12,13,14,15,16,17,18], a SYBR-green based rRT-PCR [19], rolling circle amplification [20] and a mismatch amplification mutation assay [21]. Advantages of the currently described HRM assay are its single-step, closed tube nature with post-amplification SNP interrogation, and the low cost of reagents. It is also rapid, with a total run time of 62 minutes. However, the key limitation to this HRM assay is that clinical samples with a low amount of viral RNA template cannot be reliably interrogated.
We have demonstrated two novel methodological approaches. First, we used PCR to amplify a single base pair with subsequent HRM analysis to ensure specificity of the HRM curves. Second, due to the constraints this placed on primer design, non-specific primer-dimer formation occurred and we successfully adjusted for the impact this had on the overall Tmof the reaction by plotting
Tm against CT. Wildtype and mutant containing samples were
therefore clearly discriminated up to a CT of 30. The curve
generated for 30:70 mixed samples can be used as a cut-off to separate samples containing a significant proportion of resistant mutant virus; or alternatively, those samples with a Tmversus CT
value falling outside the confidence limits of the sensitive control curve could be targeted for further evaluation.
Figure 2. Plot of the melting temperature (Tm) against the cycle threshold (CT).The blue, red, and green lines are the quadratic fitted lines with 95% confidence intervals for dilutions (blue, red and green circles) of the controls of wildtype (H@275) (A/Victoria/2048/2009), mutant (Y@275) (A/Osaka/180/2009), and 30:70 mix of mutant:wildtype respectively. The 10:90 mutant:wildtype consistently plotted below the wildtype fitted curve, but at the lower border of the 95% confidence interval. All 56 clinical samples that had a CT#30 correlated with the wildtype virus (28 confirmed by pyrosequencing). Blinded WHO samples (four wildtype and four mutant containing) and dilutions of mutant virus (A/Denmark/528/2009 and A/Perth/ 262/2009) fit within the expected curves. One blinded sample (A/Perth/268/2009) plotted just below the 30:70 curve and pyrosequencing determined this to be a 34:66 mix of mutant:wildtype. Raw data is provided inResults S1.
Our results were reproducible with runs on different days and with different operators (data not shown). Our experience and understanding is that the Rotor-Gene 6000 devices are extremely accurate with regards to relative temperature changes. However, the absolute temperature calibration may differ by up to 0.5uC between different machines. Therefore, we recommend initial calibration using samples of known mixtures of mutant and wildtype samples.
The key limitation of this assay is that clinical samples with a low amount of viral RNA template cannot be reliably interrogat-ed. However, similar problems can exist for pyrosequencing and some rRT-PCR assays where up to 20% of clinical samples provided indeterminate results due to low viral load [17,19]. Also, neuraminidase inhibition assays require the virus to be isolated in tissue culture or eggs before testing, something that is very problematic when samples have CTvalues.30. Other molecular
diagnostic assays that make use of labeled probes appear to be more sensitive with detection limits ranging from 2–500 gene copies/ml [13,15,18]. However, these assays are associated with the additional expense of labeled probes, and assays using TaqMan probes require two reactions per sample. A mismatch amplification mutation PCR assay that does not require probes has been described but also involves two reactions per sample as well as an additional gel electrophoresis step following the PCR reaction [21].
Given the simplicity (single reaction, single-step, closed-tube), low cost (single pair of unlabeled oligonucleotide primers) and rapidity of this HRM assay, we foresee a number of possible applications. It could be used to screen a large number of clinical samples that are known to contain sufficient amounts of virus. Similarly, culture stocks of virus where there is a large concentration of virus could be rapidly screened.
Immunocom-promised patients with persistent H1N1 09 infections and at risk of development of oseltamivir resistance have been reported to have low CTvalues [22] and this HRM assay may be useful in detecting
the H275Y mutation in virus from such patients. If there is an urgent clinical need to determine if resistance is present and the CT value is too high, a repeat specimen using a more sensitive
sampling technique such as a nasopharyngeal aspirate could be requested. As this assay can only confidently detect 30:70 mutant:wildtype mixtures, if a patient continues to shed virus despite appropriate treatment, performing the assay on sequential specimens should be considered to detect an increase in the mutant population to above this threshold. Finally, although this assay is specific for influenza A/H1N1 2009 alternative primer sets could be easily designed for seasonal H1N1 and H3N2 viruses.
Supporting Information
Results S1 Results for each sample with values for high-resolution melting (HRM) cycle threshold (CT), HRM melting temperature (Tm), TaqMan H1N109 CT, pyro-sequencing results with mutant %, and neuraminidase enzyme inhibition assay oseltamivir concentrations required to inhibit 50% of NA activity (IC50) (nm).Blank cells indicate that an assay has not been performed.
(XLS)
Author Contributions
Conceived and designed the experiments: ST PG IB. Performed the experiments: ST FD AH YD. Analyzed the data: ST FD. Contributed reagents/materials/analysis tools: ST FD KF PF. Wrote the paper: ST. Revised the manuscript: FD AH YD PF IB PG.
References
1. Centers for Disease Control and Prevention (2009) Oseltamivir-resistant 2009 pandemic influenza A (H1N1) virus infection in two summer campers receiving prophylaxis–North Carolina, 2009. MMWR Morb Mortal Wkly Rep 58: 969–972.
2. Centers for Disease Control and Prevention (2009) Oseltamivir-resistant novel influenza A (H1N1) virus infection in two immunosuppressed patients - Seattle, Washington, 2009. MMWR Morb Mortal Wkly Rep 58: 893–896.
3. Speers DJ, Williams SH, Pinder M, Moody HR, Hurt AC, et al. (2010) Oseltamivir-resistant pandemic (H1N1) 2009 influenza in a severely ill patient: the first Australian case. Med J Aust 192: 166–168.
4. Baz M, Abed Y, Papenburg J, Bouhy X, Hamelin ME, et al. (2009) Emergence of oseltamivir-resistant pandemic H1N1 virus during prophylaxis. N Engl J Med 361: 2296–2297.
5. Le QM, Wertheim HF, Tran ND, van Doorn HR, Nguyen TH, et al. (2010) A community cluster of oseltamivir-resistant cases of 2009 H1N1 influenza. N Engl J Med 362: 86–87.
6. (2009) Oseltamivir-resistant pandemic (H1N1) 2009 influenza virus, October 2009. Wkly Epidemiol Rec 84: 453–468.
7. Deyde VM, Gubareva LV (2009) Influenza genome analysis using pyrose-quencing method: current applications for a moving target. Expert Rev Mol Diagn 9: 493–509.
8. Varillas D, Bermejo-Martin JF, Almansa R, Rojo S, Nogueira B, et al. (2011) A new method for detection of pandemic influenza virus using High Resolution Melting analysis of the neuraminidase gene. J Virol Methods 171: 284–286. 9. Hurt AC, Barr IG, Hartel G, Hampson AW (2004) Susceptibility of human
influenza viruses from Australasia and South East Asia to the neuraminidase inhibitors zanamivir and oseltamivir. Antiviral Res 62: 37–45.
10. Whiley DM, Bialasiewicz S, Bletchly C, Faux CE, Harrower B, et al. (2009) Detection of novel influenza A(H1N1) virus by real-time RT-PCR. J Clin Virol 45: 203–204.
11. Guo L, Garten RJ, Foust AS, Sessions WM, Okomo-Adhiambo M, et al. (2009) Rapid identification of oseltamivir-resistant influenza A(H1N1) viruses with H274Y mutation by RT-PCR/restriction fragment length polymorphism assay. Antiviral Res 82: 29–33.
12. Bolotin S, Robertson AV, Eshaghi A, De Lima C, Lombos E, et al. (2009) Development of a novel real-time reverse-transcriptase PCR method for the detection of H275Y positive influenza A H1N1 isolates. J Virol Methods 158: 190–194.
13. van der Vries E, Jonges M, Herfst S, Maaskant J, Van der Linden A, et al. (2010) Evaluation of a rapid molecular algorithm for detection of pandemic influenza A (H1N1) 2009 virus and screening for a key oseltamivir resistance (H275Y) substitution in neuraminidase. J Clin Virol 47: 34–37.
14. Carr MJ, Sayre N, Duffy M, Connell J, Hall WW (2008) Rapid molecular detection of the H275Y oseltamivir resistance gene mutation in circulating influenza A (H1N1) viruses. J Virol Methods 153: 257–262.
15. Chidlow GR, Harnett GB, Williams SH, Tempone SS, Speers DJ, et al. (2010) The detection of oseltamivir-resistant pandemic influenza A/H1N1 2009 viruses using a real-time RT-PCR assay. J Virol Methods 169: 47–51.
16. Hindiyeh M, Ram D, Mandelboim M, Meningher T, Hirsh S, et al. (2010) Rapid detection of influenza A pandemic (H1N1) 2009 virus neuraminidase resistance mutation H275Y by real-time reverse transcriptase PCR. J Clin Microbiol 48: 1884–1887.
17. Renaud C, Kuypers J, Corey L (2010) Diagnostic accuracy of an allele-specific reverse transcriptase-PCR assay targeting the H275Y oseltamivir resistant mutation in 2009 pandemic influenza A/H1N1 virus. J Clin Virol 49: 21–25. 18. Suzuki Y, Saito R, Sato I, Zaraket H, Nishikawa M, et al. (2011) Identification of
oseltamivir resistance among pandemic and seasonal influenza A(H1N1) viruses by His275Tyr genotyping assay using cycling probe method. J Clin Microbiol 49: 125–130.
19. Medina RA, Rojas M, Tuin A, Huff S, Ferres M, et al. (2011) Development and characterization of a highly specific and sensitive SYBR Green RT-PCR assay for detection of the 2009 pandemic H1N1 influenza virus based on sequence signatures. J Clin Microbiol 49: 355–344.
20. Steain MC, Dwyer DE, Hurt AC, Kol C, Saksena NK, et al. (2009) Detection of influenza A H1N1 and H3N2 mutations conferring resistance to oseltamivir using rolling circle amplification. Antiviral Res 84.
21. Hata M, Tanaka S, Yasui Y, Fujiwara N, Kobayashi S, et al. (2010) Rapid genotypic assay for detection of oseltamivir-resistant influenza A (H1N1) viruses. J Clin Microbiol 48: 1983–1984.