Botanical authentication of lavender (
Lavandula
spp.) honey by a novel
DNA-barcoding approach coupled to high resolution melting analysis
S
onia Soares
a,1, Liliana Grazina
a,1, Joana Costa
a, Joana S. Amaral
a,b,**,
Maria B.P.P. Oliveira
a, Isabel Mafra
a,*aREQUIMTE-LAQV, Faculdade de Farmacia, Universidade do Porto, Rua de Jorge Viterbo Ferreira, 228, 4050-313 Porto, Portugal bInstituto Politecnico de Bragança, Campus de Sta. Apolonia, 5301-857 Bragança, Portugal
a r t i c l e
i n f o
Article history:
Received 20 October 2017 Received in revised form 29 November 2017 Accepted 30 November 2017 Available online 5 December 2017
Keywords:
Lavender honey Authenticity
matKgene HRM analysis
Lavandulaspecies Species differentiation
a b s t r a c t
Monofloral honeys (such as, lavender honey) are highly appreciated by the consumers due to their flavour, taste and properties. However, since they are considered prime products, they are often targets of adulteration. This work exploits DNA barcoding combined with high resolution melting (HRM) analysis to establish the botanical origin of honey, using lavender honey as a case study. The plastidialmatKgene was targeted as a candidate barcode forLavandulaspecies identification. The method allowed differ-entiating the species in three clusters with confidence levels>99%, being the results well correlated with the sequencing analysis. It was successfully applied to identify the botanical origin of several lavender honeys, which were grouped in the cluster of the most common species in Portugal (L. stoechassubsp., L. penduculataandL. viridis). The proposed method represents a simple, specific and cost-effective tool to authenticate the botanical origin of honey.
©2017 Elsevier Ltd. All rights reserved.
1. Introduction
According to its botanical origin, honey can be classified as mono- or multifloral. The former arises predominantly from one single botanical origin, generally one plant species representing more than 45% of the total pollen content. Multifloral honeys are composed of pollen grains from several plant species, from which none is considered predominant. Nevertheless, this classification is highly dependent on the pollen source since honeys having under-represented pollen grains, such as lavender, citrus and rosmarinus, can also be classified as monofloral with a pollen proportion of 10e20%. In opposition, honeys containing over-represented pollen grains, such as eucalyptus or chestnut, are designated as monofloral if they have a pollen ratio of 70e90% of the referred plant species (Pires, Estevinho, Feas, Cantalapiedra, & Iglesias, 2009). Several types of monofloral honeys can be found in Portugal due to theflora
diversity. Chestnut (Castanea sativa), lavender (Lavandulaspp.) and heather (Erica spp.) honeys are the most frequently found in Portugal (República Portuguesa, 2016). Lavender is an aromatic and very common Mediterraneanflowering plant that belongs to the Lamiaceae family, having several species within the Lavandula genus. In Portugal, different species ofLavandulamay be respon-sible for the origin of monofloral lavender honey, depending on their geographical production area, which are:Lavandula stoechas stoechas,L. stoechas luisieri,L. pedunculata(also known asL. stoechas pedunculata) andL. viridis(FNAP, 2017). However, lavender honey from otherLavandulaspecies can be found in other countries, such as France, where this type of honey may be from L. angustifolia, L. latifoliaor hybrids of these two species (Guyot-Declerck, Renson, Bouseta,&Collin, 2002).
Considering that monofloral honeys are highly appreciated by consumers due to theirflavour, taste and properties, and generally attain higher prices than the multifloral, they are very prone to fraudulent practices. Accordingly, the botanical origin is determi-nant to establish the quality and authenticity of honey (Castro-Vazquez, Leon-Ruiz, Alanon, P~ erez-Coello, & Gonzalez-Porto, 2014; Soares, Amaral, Oliveira,&Mafra, 2017). Melissopalynology is still the method used for this purpose, though being time-consuming and strongly dependent on the qualification and *Corresponding author. REQUIMTE-LAQV, Faculdade de Farmacia, Universidade
do Porto, Rua de Jorge Viterbo Ferreira, 228, 4050-313 Porto, Portugal.
**Corresponding author. REQUIMTE-LAQV, Faculdade de Farmacia, Universidade do Porto, Rua de Jorge Viterbo Ferreira, 228, 4050-313 Porto, Portugal.
E-mail addresses:[email protected](J.S. Amaral),[email protected](I. Mafra).
1 The authors contributed equally to the present work.
Contents lists available atScienceDirect
Food Control
j o u r n a l h o m e p a g e :w w w . e l s e v i e r . c o m / l o c a t e / f o o d c o n t
https://doi.org/10.1016/j.foodcont.2017.11.046
judgment of the analysts. Particularly for lavender honeys that contain under-represented pollen grains of Lavandulaspp. (15%), the melissopalynological classification is a very difficult task. To overcome the referred drawbacks, attempts of using physico-chemical parameters and/or physico-chemical markers have been carried out to authenticate lavender honey (Castro-Vazquez et al., 2014; Estevinho, Chambo, Pereira, Carvalho, &Toledo, 2016). However, their assessment can be influenced by the environmental condi-tions and beekeeping techniques, which might lead recurrently to unreliable identification of the botanical origin. The recent use of DNA markers for pollen identification in honey has demonstrated their feasibility as alternative tools for its botanical determination (Soares et al., 2017). Species-specific real-time PCR assays with TaqMan™probes were successfully developed to detect relevant species in Corsican honey (acacia, broom, citrus, clover, heather, eucalyptus, lavender, linden, oak, olive, rape, rockrose, rosemary, sunflower, and sweet chestnut) (Laube et al., 2010). However, previous sample pre-treatments and the selection/optimisation of DNA extraction from honey are crucial steps for further amplifi ca-tion by polymerase chain reacca-tion (PCR) (Jain, Jesus, Marchioro,& Araújo, 2013; Lalhmangaihi, Ghatak, Laha, Gurusubramanian, & Kumar, 2014; Soares, Amaral, Oliveira,&Mafra, 2015).
In the past years, DNA barcoding is an increasingly used approach for taxonomic identification, being suggested to deter-mine the plant and animal species in honey (Bruni et al., 2015; Prosser & Hebert, 2017; Schnell, Fraser, Willerslev, & Gilbert, 2010; Valentini, Miquel,&Taberlet, 2010). In the case of plant dif-ferentiation, several DNA barcode regions, such as the plastidial genesmatK,trnLandrbcL, and the internal transcriber spacers (ITS1 and ITS2) have already been described (Hollingsworth, Graham,& Little, 2011). Despite the high potentiality of DNA barcoding for the botanical identification of plant species in honey, all the re-ported methods depend on sequencing analysis, either using Sanger method or NGS (Bruni et al., 2015; Hawkins et al., 2015; Prosser&Hebert, 2017; Schnell et al., 2010; Valentini et al., 2010). High resolution melting (HRM) analysis can be regarded as a reli-able and cost-effective alternative to exploit DNA barcoding, with demonstrated successful applications in the identification of herbal medicines (Costa et al., 2016; Xanthopoulou et al., 2016), and several other plant and animal species in foods (Druml& Cichna-Markl, 2014; Madesis, Ganopoulos, Sakaridis, Argiriou,&Tsaftaris, 2014), without requiring further sequencing. Thus, the present work intends to exploit DNA barcoding combined with HRM analysis as an efficient and simple approach to identify the botan-ical origin of honey. For this purpose, lavender honey was chosen as a case study to differentiate the origin of pollen grains in honey.
2. Materials and methods
2.1. Sample preparation
Plant material (leaves and seeds) of 9 different voucher species ofLavandula, namelyL. stoechas stoechas(two specimens), andL. s. luisieri,L. s. pedundulata, L. pedunculata,L. angustifolia,L. latifolia, L. pinnata, L. multifida and L. viridis (one specimen each), were kindly granted by the Jardim Bot^anico da Madeira (Funchal, Portugal), Jardim da Fundaç~ao de Serralves (Porto, Portugal), Jardim Bot^anico da UTAD (Vila-Real, Portugal), Real Jardín Botanico Juan Carlos I (Madrid, Spain), Jardin Botanique Strasbourg (Strasbourg, France), Banco de Germoplasma Vegetal Andaluz (Villaviciosa, Cordoba, Spain) and Conservatoire Botanique National de Corse (Corte, Haute-Corse, France). Additionally, one sample of wild and unknown lavender species was collected in the region of Coimbra, centre of Portugal. A detailed description of the selected lavender species is presented in Table 1. A set of plant species (n ¼51),
frequently identified in the pollen analysis of Portuguese honeys, were used in this work for specificity assays (see sample descrip-tion inTable S1, supplementary material).
After received, all plant leaves were dried, crushed and stored at room temperature (under desiccation), until DNA extraction. The seeds were crushed and stored at 20C, until DNA extraction.
Commercial honey samples from distinct Portuguese regions (n¼20) were acquired directly from national producers or at local retail markets. A description of each honey is presented inTable 2. Prior to DNA extraction, the honey samples were pre-treated to discard possible interferences for further analysis (Soares et al., 2015). Briefly, 50 g (4 tubes with 12.5 g each) of each honey sam-ple were frozen ( 80C) overnight. After adding distilled water to each tube until a volume of 45 mL, the mixture was vigorously homogenised in vortex and heated at 45C for 5 min. The tubes were centrifuged at 5500gfor 20 min (4C) and the supernatant was discarded. The pellet was suspended in 1 mL of distilled water and further transferred to 2 mL reaction tubes. The 4 reaction tubes were frozen ( 20C) overnight, heated at 45 C for 5 min and centrifuged (17,000gfor 10 min, 4 C). Again, the pellets were suspended in distilled water and combined in one reaction tube (2 mL), which was centrifuged (17,000g for 10 min, 4C). The supernatant was discarded and the pellet was stored at 20C until DNA extraction.
2.2. DNA extraction
DNA from plant species and honey samples was extracted with the commercial kit NucleoSpin®
Plant II (Macherey-Nagel, Düren, Germany), according to the manufacture instructions with some minor modifications, as described bySoares et al. (2015). All the DNA extracts were kept at 20C until further analysis. The ex-tractions were done in duplicate assays for each sample.
The concentration and purity of the extracts were assessed by UV spectrophotometry, using a Synergy HT multi-mode microplate reader with a Take3 micro-volume plate accessory (BioTek In-struments, Inc., Vermont, USA). DNA content was determined using the nucleic acid quantification protocol with sample type defined for double-strand DNA in the Gen5 data analysis software version 2.01 (BioTek Instruments, Inc., Vermont, USA).
The quality of the extracted DNA was further evaluated by electrophoresis in a 1.0% agarose gel containing Gel Red 1x (Bio-tium, Hayward, CA, USA) for staining and carried out in SGTB 1x (GRiSP, Research Solutions, Porto, Portugal) for 20 min at 200 V. The agarose gel was visualised under a UV light tray Gel Doc™ EZ System and a digital image was obtained with Image Lab software version 5.1 (Bio-Rad Laboratories, Hercules, CA, USA).
2.3. Selection of the target gene and oligonucleotide primers
(http://www.basic.northwestern.edu./bio-tools/oligocalc.html). The designed primers were synthesised by STABVIDA (Lisbon, Portugal).
2.4. End-point PCR
The PCR amplifications were carried out in a total reaction volume of 25
mL, containing 2
mL of DNA extract (
<20 ng), 67 mM Tris-HCl (pH 8.8), 16 mM of (NH4)2SO4, 0.1% of Tween 20, 200mM of
each dNTP, 1.0 U of SuperHot Taq DNA Polymerase (Genaxxon Bioscience GmbH, Ulm, Germany), 3.0 mM of MgCl2, and 200 nM of each primer Lav1-F and Lav1-R. The reactions were performed in a thermal cycler MJ Mini™Gradient Thermal Cycler (Bio-Rad Labo-ratories, Hercules, CA, USA) using the following program: (i) initial denaturation at 95C for 5 min; (ii) 40 cycles at 95C for 30 s, 55Cfor 30 s and 72C for 30 s; (iii) and afinal extension at 72C for 5 min.
The amplified fragments were analysed by electrophoresis in a 1.5% agarose gel containing Gel Red 1x (Biotium, Hayward, CA, USA) for staining and carried out in SGTB 1x (GRiSP, Research Solutions, Porto, Portugal). The agarose gel was visualised under a UV light tray Gel Doc™EZ System and a digital image was obtained with Image Lab software version 5.1 (Bio-Rad Laboratories, Hercules, CA, USA). Each extract was amplified at least in duplicate assays.
2.5. Real-time PCR and HRM analysis
The real-time PCR assays were performed in 20
mL of total
re-action volume, containing 2mL of DNA extract (
<20 ng), 1of SsoFast™EvaGreen®Supermix (Bio-Rad Laboratories, Hercules, CA, Table 1
Description ofLavandulaspecies used in the present work and respective results of end-point PCR (nuclear 18S rRNA, andmatKsequences), real-time PCR and HRM analysis. Plant
material
Species Origin Accession number/
Referencea
End-Point PCRb
Real-time PCRc HRM analysis
18S rRNA
matKCt values Melting temperature (C)
Cluster Level of confidence (%)c
Leaves Lavandulaspp. Wild, Coimbra, Portugal NA þ þ 20.46±0.02 76.2±0.0 1 99.1±0.0 Seeds L. stoechas
luisieri
Banco de Germoplasma Vegetal Andaluz, Villaviciosa, Cordoba, Spain
14105 þ þ 18.25±0.05 76.2±0.0 1 99.7±0.1
Seeds L. stoechas stoechas
Conservatoire Botanique National de Corse, Canavaggia, Haute-Corse, France
NP þ þ 18.51±0.03 76.2±0.0 1 99.9±0.0
Leaves L. stoechas stoechas
Conservatoire Botanique National de Corse, Corte, Haute-Corse, France
NP þ þ 21.12±0.04 76.2±0.0 1 99.9±0.0
Seeds L. stoechas pedunculata
Banco de Germoplasma Vegetal Andaluz, Trassierra, Cordoba, Spain
15304 þ þ 18.55±0.05 76.2±0.0 1 100.0±0.0
Leaves L. penduculata Jardim Bot^anico da Madeira, Funchal, Portugal PT-O-MADJ-33-2014
þ þ 20.42±0.80 76.1±0.1 1 99.8±0.0
Seeds L. viridis Real Jardín Botanico Juan Carlos I, Madrid, Spain ALCA-BG-0404/02 þ þ 17.73±0.62 76.2±0.0 1 99.7±0.0 Seeds L. pinnata Jardim Bot^anico da Madeira, Funchal, Portugal
PT-O-MADJ-24-2015
þ þ 17.67±0.05 76.8±0.0 2 99.7±0.1
Leaves L. multífida Jardim da Fundaçao de Serralves, Porto, Portugal~ NP þ þ 17.02±0.48 76.6±0.0 2 99.6±0.1 Leaves L. angustifolia Jardim Bot^anico da UTAD, Vila Real, Portugal NP þ þ 22.27±0.09 76.6±0.0 3 100.0±0.0 Seeds L. latifolia Jardin Botanique Strasbourg, Strasbourg, France 1979/359 þ þ 24.57±0.27 76.6±0.0 3 99.9±0.1
aNA, not applicable; NP, not provided.
b (þ) positive amplification; ( ) negative amplification. c Mean values±standard deviation ofn¼4 replicates.
Table 2
Description of analysed honey samples and respective results of end-point PCR (nuclear 18S rRNA, andmatKsequences), real-time PCR and HRM analysis. Honey Botanical origin Geographical origin End-point PCRa Real-time PCRb HRM analysis
18S rRNA matK Ct valuesa Melting temperature (C) Cluster Level of confidence (%)b
1 Lavander Vila Real, Portugal þ þ 31.62±0.23 76.0±0.0 1 99.8±0.0 2 LavenderþLinden Castelo Branco, Portugal þ þ 30.18±0.12 75.9±0.1 1 99.8±0.2 3 Lavander Serra da Malcata, Portugal þ þ 32.74±0.24 76.0±0.0 1 99.8±0.1
4 Lavander Portugal þ þ 31.57±0.02 76.0±0.0 1 99.8±0.1
5 Lavander Alto T^amega, Portugal þ þ 33.21±0.19 76.0±0.0 1 99.9±0.1
6 Lavander Portugal þ þ 30.13±0.10 75.9±0.1 1 99.6±0.2
7 Lavander Serra de Portel, Portugal þ þ 32.05±0.23 76.2±0.0 1 99.7±0.2 8 Lavander Serra de Portel, Portugal þ þ 30.69±0.14 76.0±0.0 1 99.6±0.1 9 Lavander Mertola, Portugal þ þ 29.26±0.08 76.0±0.0 1 99.8±0.2 10 Lavander Mertola, Portugal þ þ 29.89±0.21 75.9±0.0 1 99.7±0.1 11 LavenderþAlmond Douro, Portugal þ ± e
12 Lavander Amarante, Portugal þ þ 31.32±0.14 76.0±0.0 1 99.9±0.0 13 Lavander Batalha, Portugal þ þ 32.23±0.12 76.3±0.2 1 99.3±0.2 14 Lavander Vila Real, Portugal þ þ 32.54±0.10 76.0±0.0 1 99.8±0.1 15 Lavander Algarve, Portugal þ þ 32.15±0.09 76.2±0.0 1 99.7±0.2
16 Lavender Palmela, Portugal þ ± e
17 Multifloral Montesinho, Bragança þ e NA
18 Multifloral Tras-os-montes, Portugal þ e NA
19 Lavender Aljezur, Portugal þ ± e
20 Lavender Zavial, Algarve, Portugal þ ± e a(þ) positive amplification; ( ) negative amplification.
b Mean values±standard deviation ofn¼4 replicates; NA
USA), 400 nM of each primer Lav1-F/Lav1-R. The assays were car-ried out on a fluorometric thermal cycler CFX96 Real-time PCR Detection System (Bio-Rad Laboratories, Hercules, CA, USA), ac-cording to the following temperature programme: 95C for 5 min, 50 cycles at 95C for 15 s, 55C for 15 s and 72C for 25 s, with the collection offluorescence signal at the end of each cycle. Data were collected and processed using the software Bio-Rad CFX Manager 3.1 (Bio-Rad Laboratories, Hercules, CA, USA). Real-time PCR trials were repeated in two independent assays using four replicates in each one.
For HRM analysis, PCR products were denatured at 95 C for 1 min and then annealed at 60C for 5 min in order to allow the correct annealing of the DNA duplexes. These two steps were fol-lowed by melting curve ranging from 60 to 90C with temperature increments of 0.2 C every 10 s. Thefluorescence data were ac-quired at the end of each melting temperature, which were pro-cessed using the Precision Melt Analysis Software 1.2 (Bio-Rad Laboratories, Hercules, CA, USA) to generate melting curves as a function of temperature and difference curves for easier visual identification of clusters. Cluster detection settings were defined targeting high sensitivity and threshold yields for more heterozy-gote clusters. Melting curve shape sensitivity parameter was adjusted to percentage value 50% and Tm difference threshold parameter was set as a default value of 0.30.
2.6. Sequencing of PCR products
To corroborate the HRM analysis, the PCR products with Lav1-F/ Lav1-R primers of the 11 different specimens of Lavandulawere sequenced. After the amplification according to the previously optimised conditions, the PCR products were purified with GRS PCR
&Gel Band Purification Kit (GRISP, Porto, Portugal) to remove any
possible interfering components and sent to a specialised research facility (GATC Biotech, Constance, Germany) for sequencing. Each target fragment was sequenced twice, performing the direct sequencing of both strands in opposite directions, which allowed the production of two complementary sequences with very good quality. The sequencing data were analysed using the available software BioEdit v7.2.5 (Ibis Biosciences, Carlsbad, CA, USA) and FinchTV (Geospiza, Seattle, WA, USA).
3. Results and discussion
3.1. Evaluation of extracted DNA
In general, the lavender DNA extracts exhibited an adequate concentration (3.8e193.4 ng/mL), although low values were ob-tained for some plant materials (particularly the seeds). Similar values of DNA yield were achieved for honey samples, with con-centrations ranging from 4.4 to 275.9 ng/mL. The reported DNA concentrations are in good agreement with literature.Bruni et al. (2015)attained yields that ranged 10e25 ng/mL using a different extraction kit and an additional purification kit. Generally, DNA yields were also in good accordance with the electrophoretic analysis. For the 11 plant species tested, DNA extracts presented purities ranging from 1.5 to 2.1, while for honey samples the pu-rities ranged from 1.9 to 2.3.
3.2. End-point PCR
To evaluate the amplification capacity of the DNA extracts, all samples were tested with primers EG-F/EG-R targeting a universal eukaryotic fragment (Tables 1 and 2), as described byVilla, Costa, Oliveira, and Mafra (2017). All the extracts of the Lavandula voucher specimens and honey samples were successfully amplified,
showing strong PCR products with the expected size of 109 bp (data not shown) and confirming the suitability of all DNA extracts for further PCR amplification.
The plastidialmatKgene was the selected DNA region for the design of a new pair of primer to differentiateLavandulaspecies/ subspecies. This choice was related to the fact thatmatKgene has been proposed as a universal DNA barcode for flowering plants (Lahaye et al., 2008; Selvaraj, Sarma,&Sathishkumar, 2008). Be-sides, the combined approach ofmatK, as a mini-barcode candidate, with HRM analysis was already demonstrated forCrocusspp. dif-ferentiation (Villa, Costa, Meira, Oliveira,&Mafra, 2016). So, the new primers (Lav1-F/Lav1-R) targeting thematK sequence were used to amplify DNA from the voucher specimens under study. As expected, all the tested specimens were amplified, obtaining PCR products of 154 bp (Table 1). To experimentally confirm their specificity forLavandulaspp., previously demonstrated by thein silico analysis, other 51 plant species, including those most commonly found in Portuguese honeys, were tested to verify any possible reactivity. The results are presented inTable S1 (supple-mentary material), showing that 5 plant species, namely Salvia
Fig. 1.Conventional melting curves (B), normalised melting curves (C) and difference curves (D) obtained by real-time PCR amplification with EvaGreen dye and HRM analysis targeting thematKgene ofLavandulaspp. (n¼4). Legend: 1, wild lavender,
L. stoechas luisieri,L. s. stoechas(Canavaggia),L. s. stoechas(Corte),L. s. pedunculata,
officinalis, Mentha x piperita, Aloysia citrodora(belonging to the Lamiales order, such as the samples ofLavandula spp.), Genista tridentateand Erica australis, were also positive for the expected fragment of 154 bp, while the others did not produce any PCR product. From these species,E. australiscan be considered a rele-vant cross-reactivity because Erica spp. are pollen sources for heather honey, very common in Portugal.
The applicability of the Lav1-F/Lav1-R primers to detect differentLavandulaspp. in honey was further demonstrated in the analysis of 18 lavender and two multifloral honey samples (Table 2). The obtained results showed fragments of 154 bp for the 18 lav-ender honey samples, though four of them (#11, #16, #19, #20) presented weak amplification (faint bands), probably due to low target DNA since the amplification of a universal eukaryotic sequence was obtained with strong fragments (Fig. S1, supple-mentary material). It is important to refer that lavender honeys have under represented pollen grains of Lavandula spp., which might justify the particularly low amount of target DNA in some samples. The two multifloral honey samples (#17 and #18) did not show any PCR fragment, possibly due to the absence or very low proportion of lavender pollen.
3.3. Real-time PCR with HRM analysis
Following the encouraging results of end-point PCR targeting thematK gene with Lav1-F/Lav1-R primers, the amplification by real-time PCR with EvaGreen dye was then proceeded using the differentLavandulaspecimens under study. The real-time PCR re-sults were in good agreement with those previously obtained by end-point PCR since all specimens were amplified with cycle threshold values ranging from 17.02 to 24.57 (Table 1). Fig. 1A shows the melting curves obtained for the assayed species/sub-species, namelyL. stoechas stoechas,L. stoechas luisieri,L. stoechas pedundulata, L. pedunculata,L. angustifolia,L. latifolia,L. pinnata, L. multifida,L. viridisand wild lavender. The melting curve analysis revealed peaks with very close melting temperatures (Tm), though three groups can be visualised: (i) at 76.2C for wild lavender, L. stoechassubsp., L. pedunculataandL. viridis; (ii) at 76.6C for L. multifida,L. angustifoliaandL. latifolia; (iii) at 76.8C forL. pinnata
(Fig. 1A and Table 1). However, based on the close melting tem-peratures and similarity of profiles, it is not possible to clearly differentiate them by conventional melting curve analysis.
As an attempt to distinguish all theLavandula species/subspe-cies, HRM analysis was applied as a tool with high potentialities to discriminate closely related taxa. The results are displayed as nor-malised melt and difference curves inFig. 1B and C, respectively. As it can be seen, the specimens were divided in three distinct clusters with high levels of confidence (99.1%). Cluster 1, nominated as the reference cluster, included the wild lavender, L. stoechassubsp., L. pedunculataandL. viridis, which is a group in good agreement with the results of conventional melting curve analysis, having all practically the same Tm. Cluster 2 comprised the speciesL. pinnata and L. multifida, while cluster 3 included theL. angustifolia and L. latifolia. Thesefindings are in good agreement with the fact that the lavender species, included in cluster 1, are the most frequent in the Portuguese flora (FNAP, 2017). L. angustifoliaand L. latifolia, included in cluster 3, are more common in the Frenchflora (Guyot-Declerck et al., 2002). According to Chograni, Messaoud, and Boussaid (2008), there is a high genetic divergence between L. stoechasandL. multifidapopulations based on isozymes, which corroborates their distinct taxonomic status and separate cluster classification.
Considering the relevant reactivity of the proposed primers with E. australis, a real-time PCR assay with melting curve analysis and HRM analysis was further performed with this species together with Lavandula spp. representative of each cluster. The results confirmed the amplification of E. australis by real-time PCR tar-getingmatkgene, displaying a Tm of 76.8C, very close to the ones ofL. angustifolia,L. pinnata, but exhibiting a slightly different profile owing to the presence of a “shoulder” before the melt peak (Fig. S2A, supplementary material). However, with the application of HRM analysis those melting profile differences were intensified andE. australis was completely discriminated, being separated in a distinct cluster from the other threeLavandulaspp. (Figs. S2B and S2C, supplementary material). Accordingly, the HRM assay speci-ficity was further confirmed as suitable to differentiateLavandula spp.
3.4. Sequencing results
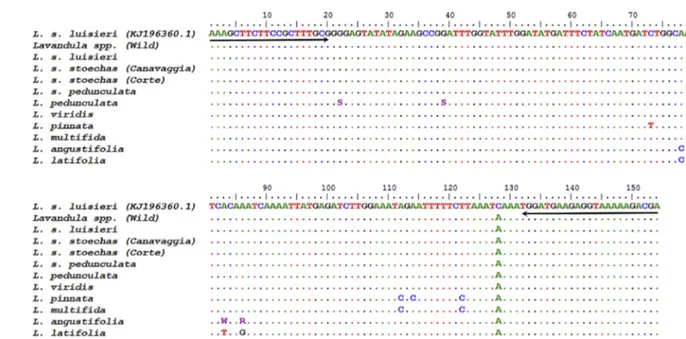
To further confirm and validate the results of HRM analysis, the PCR products of the 11Lavandula specimens amplified with the Lav1-F/Lav1-R primers were sequenced in opposite directions, obtaining electropherograms with high resolution and a total coverage of the 154 bp fragments. The results were aligned with the GenBank retrieved sequence (accession number KJ196360.1) in which the primers were designed and are presented in Fig. 2. Firstly, it can be observed a consistent mismatch (C/A) in the position 128 in all the obtained sequences, which might suggest the misidentification of that base from the consensus sequence (accession number KJ196360.1). Comparing the sequences from the specimens of cluster 1, namely wildLavandula,L. stoechas luisieri, L. stoechas stoechas(Canavaggia and Corte),L. stoechas pedundulata and L. pedunculata, it can be verified that they share the same sequence, except for two nucleotides of L. pedunculata not completely identified (S at positions 23 and 39). However, since S can in fact be a C, these sequences might be in full agreement. This finding justifies the inclusion of all these specimens in the same cluster, which is also in good agreement with the fact that L. stoechas stoechas,L. stoechas luisieri,L. pedunculata(also known as L. stoechas pedunculata) andL. viridisare the most common Lav-andulaspecies in Portugal (FNAP, 2017), being all genetically close. The specimen of wild lavender is probably one of those species. L. pinnata sequence presented 4 mismatches, while L. multifida showed 2, being two of them in common, namely A/C and T/C at the positions 112 and 122, respectively. The other two mismatches ofL. pinnatasequence are C/T and A/C at the positions 73 and 114, respectively. Therefore, the partial mismatch sharing by these two species corroborates the HRM results, which include them in a distinct cluster. The sequences ofL. angustifoliaandL. latifoliashare three mismatches in the same positions (78, 83 and 86). Thefirst mismatch (A/C) was consistent in both species. The other two mismatches were clearly identified inL. latifolia(83, A/T and 86, A/G), but not inL. angustifolia(83, A/W (A or T) and 86, A/R (A or G)), though they might be also coincident. This agrees with the genetic proximity of both species, commonly designated as French lavenders (Guyot-Declerck et al., 2002), and clearly justifies their inclusion in a distinct HRM cluster.
3.5. Application of the HRM analysis to honey samples
After the development and validation of the HRM method, the honey samples that showed the expected PCR fragment with Lav1-R/Lav1-F were further amplified by real-time PCR with the same primers. As expected, honey samples #1 to #10 and #12 to #15 were confirmed as positive for Lavandula spp. by real-time PCR with Ct values ranging from 29.26 to 33.21 (Table 2). The weak amplification results obtained by qualitative PCR in 4 samples (#11, #16, #19 and #20) were not confirmed by real-time PCR, suggesting again the low amount of the target DNA. It is important to highlight that despite the main efforts performed in the DNA extraction procedure from honey, including a previous sample pre-treatment, it was difficult to obtain high levels of amplification by real-time PCR. Even though, conventional melting curve and HRM analysis could be successfully applied to all the referred 14 honey samples (#1-#10, #12-#15).Fig. 3shows an example assay of the melting curve and HRM analysis applied to 4 of the analysed honey samples together with theLavandulavoucher specimens. The obtained Tm of the 14 honey samples ranged from 75.9C to 76.3C (Fig. 3A, Table 2), being in the vicinity of the Tm of theLavandulaspecies frequently found in Portugal. As expected, the HRM analysis confirmed this assumption by placing all the honey samples in the same cluster (cluster 1) of the PortugueseLavandulaspecies with
high level of confidence (99.3%) (Fig. 3B and C, Table 2). This demonstrates the feasibility of the proposed HRM method to authenticate the botanical origin of lavender honeys.
4. Conclusions
In the present work, we propose a combination of thematK gene, as a DNA barcode suggested for plants, with HRM analysis as a highly specific approach to identify differentLavandulaspecies. The method enabled the differentiation of lavender species in 3 distinct clusters with high level of confidence (99%): the lavender species commonly found in Portugal (L. stoechassubsp.,L. pedunculataand L. viridis); the speciesL. multifidaand L. pinnata; and the French lavender species (L. angustifoliaandL. latifolia). The HRM results were well correlated with the sequencing data, proving the ade-quacy of the method to authenticate the botanical origin of honey. Hereby, we present a reliable and fast DNA-based methodology to assess the botanical origin of Portuguese monofloral lavender honey, which can be highlighted as a suitable alternative to the Fig. 3.Conventional melting curves (A), normalised melting curves (B) and difference curves (C) obtained by real-time PCR amplification with EvaGreen dye and HRM analysis targeting thematKgene ofLavandulaspp. (n¼4). Legend: 1, wild lavender,
L. stoechas luisieri,L. s. stoechas(Canavaggia),L. s. pedunculata,L. pedunculata,L. viridis, honey samples (#6, #8, #12, #13, see Table 2); 2, L. pinnata, L. multífida; 3,
currently used melyssopalynological analysis. To our knowledge, this is thefirst study using DNA barcoding combined with HRM analysis for the simple, cost-effective and rapid discrimination/ identification of plant species in honey.
Acknowledgments
This work was supported by FCT (Fundaç~ao para a Ci^encia e Tecnologia) through project UID/QUI/50006/2013ePOCI/01/0145/ FEDER/007265 withfinancial support from FCT/MEC through na-tional funds and co-financed by FEDER, under the Partnership Agreement PT2020 and by the project NORTE-01-0145-FEDER-000011. S. Soares, L. Grazina and J. Costa are grateful to FCT grants (SFRH/BD/75091/2010, SFRH/BD/132462/2017 and SFRH/BPD/ 102404/2014, respectively)financed by POPH-QREN (subsidised by FSE and MCTES). The authors are grateful for the kind supply of voucher seeds and leaves from Jardim Bot^anico da Madeira (Fun-chal, Portugal), Jardim da Fundaç~ao de Serralves (Porto, Portugal), RBG Kew Garden (Kew, United Kingdom), Jardim Bot^anico da UTAD (Vila Real, Portugal), Real Jardín Botanico Juan Carlos I (Madrid, Spain), Jardin Botanique Strasbourg (Strasbourg, France), Banco de Germoplasma Vegetal Andaluz (Villaviciosa, Spain) and Conserva-toire Botanique National de Corse (Haute-Corse, France).
Appendix A. Supplementary data
Supplementary data related to this article can be found at https://doi.org/10.1016/j.foodcont.2017.11.046.
References
Bruni, I., Galimberti, A., Caridi, L., Scaccabarozzi, D., De Mattia, F., Casiraghi, M., et al. (2015). A DNA barcoding approach to identify plant species in multiflower honey.Food Chemistry, 170(0), 308e315.
Castro-Vazquez, L., Leon-Ruiz, V., Ala non, M. E., P~ erez-Coello, M. S., & Gonz alez-Porto, A. V. (2014). Floral origin markers for authenticating Lavandin honey (Lavandula angustifolia x latifolia). Discrimination from Lavender honey ( Lav-andula latifolia).Food Control, 37, 362e370.
Chograni, H., Messaoud, C., & Boussaid, M. (2008). Genetic diversity and population structure in TunisianLavandula stoechasL. andLavandula multifidaL. (Lam-iaceae).Biochemical Systematics and Ecology, 36(5), 349e359.
Costa, J., Campos, B., Amaral, J. S., Nunes, M. E., Oliveira, M. B. P. P., & Mafra, I. (2016). HRM analysis targeting ITS1 and matK loci as potential DNA mini-barcodes for the authentication ofHypericum perforatumandHypericum androsaemumin herbal infusions.Food Control, 61, 105e114.
Druml, B., & Cichna-Markl, M. (2014). High resolution melting (HRM) analysis of DNAeits role and potential in food analysis.Food Chemistry, 158, 245e254.
Estevinho, L. M., Chambo, E. D., Pereira, A. P. R., Carvalho, C. A. L., & Toledo, V. A. A. (2016). Characterization ofLavandulaspp. honey using multivariate techniques.
PLoS ONE, 11(9), e0162206.
FNAP. (2017). Mel de rosmaninho Portugu^es - um alimento funcional e fonte de nutrac^euticos. http://fnap.pt/projectos/projecto-mel-de-rosmaninho-portugues/. (Accessed 15 June 2017).
Guyot-Declerck, C., Renson, S., Bouseta, A., & Collin, S. (2002). Floral quality and discrimination of Lavandula stoechas, Lavandula angustifolia, and Lavandula angustifolialatifoliahoneys.Food Chemistry, 79(4), 453e459.
Hawkins, J., de Vere, N., Griffith, A., Ford, C. R., Allainguillaume, J., Hegarty, M. J., et al. (2015). Using DNA metabarcoding to identify thefloral composition of honey: A new tool for investigating honey bee foraging preferences.PLoS One, 10(8), e0134735.
Hollingsworth, P. M., Graham, S. W., & Little, D. P. (2011). Choosing and using a plant DNA barcode.PLoS One, 6(5), e19254.
Jain, S. A., Jesus, F. T., Marchioro, G. M., & Araújo, E. D. (2013). Extraction of DNA from honey and its amplification by PCR for botanical identification.Food Science and Technology, 33, 753e756.
Lahaye, R., van der Bank, M., Bogarin, D., Warner, J., Pupulin, F., Gigot, G., et al. (2008). DNA barcoding thefloras of biodiversity hotspots.Proceedings of the National Academy of Sciences, 105(8), 2923e2928.
Lalhmangaihi, R., Ghatak, S., Laha, R., Gurusubramanian, G., & Kumar, N. S. (2014). Protocol for optimal quality and quantity pollen DNA isolation from honey samples.Journal of Biomolecular Techniques, 25(4), 1e4.
Laube, I., Hird, H., Brodmann, P., Ullmann, S., Schone-Michling, M., Chisholm, J., et al.€ (2010). Development of primer and probe sets for the detection of plant species in honey.Food Chemistry, 118(4), 979e986.
Madesis, P., Ganopoulos, I., Sakaridis, I., Argiriou, A., & Tsaftaris, A. (2014). Advances of DNA-based methods for tracing the botanical origin of food products.Food Research International, 60, 163e172.
Pires, J., Estevinho, M. L., Feas, X., Cantalapiedra, J., & Iglesias, A. (2009). Pollen spectrum and physico-chemical attributes of heather (Ericasp.) honeys of north Portugal.Journal of the Science of Food and Agriculture, 89(11), 1862e1870.
Prosser, S. W. J., & Hebert, P. D. N. (2017). Rapid identification of the botanical and entomological sources of honey using DNA metabarcoding.Food Chemistry, 214, 183e191.
República Portuguesa. (2016).Programa apícola nacional 2017-2019.http://www. gpp.pt/images/Programas_e_Apoios/Apoios_de_Mercado/PAN/PAN2017-2019. pdf. (Accessed 15 June 2017).
Schnell, I. B., Fraser, M., Willerslev, E., & Gilbert, M. T. P. (2010). Characterisation of insect and plant origins using DNA extracted from small volumes of bee honey.
Arthropod-Plant Interactions, 4(2), 107e116.
Selvaraj, D., Sarma, R. K., & Sathishkumar, R. (2008). Phylogenetic analysis of chloroplast matK gene from Zingiberaceae for plant DNA barcoding. Bio-information, 3, 24e27.
Soares, S., Amaral, J. S., Oliveira, M. B. P. P., & Mafra, I. (2015). Improving DNA isolation from honey for the botanical origin identification.Food Control, 48, 130e136.
Soares, S., Amaral, J. S., Oliveira, M. B. P. P., & Mafra, I. (2017). A comprehensive review on the main honey authentication issues: Production and origin.
Comprehensive Reviews in Food Science and Food Safety, 16, 1072e1100.
Valentini, A., Miquel, C., & Taberlet, P. (2010). DNA barcoding for honey biodiversity.
Diversity, 2(4), 610.
Villa, C., Costa, J., Meira, L., Oliveira, M. B. P. P., & Mafra, I. (2016). Exploiting DNA mini-barcodes as molecular markers to authenticate saffron (Crocus sativusL.).
Food Control, 65, 21e31.
Villa, C., Costa, J., Oliveira, M. B. P. P., & Mafra, I. (2017). Novel quantitative real-time PCR approach to determine safflower (Carthamus tinctorius) adulteration in saffron (Crocus sativus).Food Chemistry, 229, 680e687.