Diagnostic Accuracy of Anthropometric
Indicators in the Prediction of Urinary
Incontinence in Physically Active Older Women
Acurácia diagnóstica de indicadores antropométricos na
predição de incontinência urinária em idosas
fi
sicamente ativas
Enaiane Cristina Menezes
1Janeisa Franck Virtuoso
2Eduardo Capeletto
1Lislayne Luiza da Silva
1Jodelle Machado Chagas
1Giovana Zarpellon Mazo
11Post-Graduation Program in Sciences of Human Movement, Universidade do Estado de Santa Catarina (Udesc), Florianópolis, SC, Brazil
2Post-Graduation Program in Rehabilitation Sciences, Universidade Federal de Santa Catarina (UFSC), Florianópolis, SC, Brazil Rev Bras Ginecol Obstet 2016;38:399–404.
Address for correspondence Enaiane Cristina Menezes, MSc, Professor, Rua Pascoal Simone 358, Coqueiros, 88080-350– Florianópolis, SC, Brasil (e-mail: [email protected]).
Keywords
►
anthropometry
►
ROC curve
►
urinary incontinence
Abstract
Purpose
To determine the diagnostic accuracy and the cutoff point of the variables
conicity index, waist to height ratio and fat percentage to detect urinary incontinence
in physically active older women.
Method
A total of 152 women were analyzed. The instruments used were the
International Physical Activity Questionnaire (IPAQ [Area 4]) to check the level of
physical activity, and the Diagnostic Form to obtain sociodemographic data and
presence of urinary incontinence. To calculate the conicity index, waist to height ratio
and fat percentage, body mass, height and waist circumference were measured.
Descriptive and inferential statistics were used. Cutoff points, sensitivity (S) and
speci
fi
city (SP) were determined by receiver operating characteristic (ROC) curves. A
5% signi
fi
cance level was adopted.
Results
The prevalence of urinary incontinence was of 32.2%. The cutoff point with
better sensitivity and speci
fi
city for the conicity index was 1.23 (S
¼
87.8; SP
¼
35.9);
for the waist to height ratio, it was 0.57 (S
¼
79.6; SP
¼
45.6); and for the fat
percentage, it was 39.71 (S
¼
89.8; SP
¼
42.7). The area under the ROC curve was
0.666 for the conicity index, 0.653 for the waist to height ratio, and 0.660 for the fat
percentage.
Conclusions
The cutoff points for the anthropometric measurements conicity index,
waist to height ratio and fat percentage indicate that these measures can be used to
predict urinary incontinence in physically active older women. Furthermore, fat
percentage seemed to be the best measure for this population.
received
February 24, 2016
accepted
July 12, 2016
published online
August 16, 2016
DOIhttp://dx.doi.org/ 10.1055/s-0036-1592103.
ISSN 0100-7203.
Copyright © 2016 by Thieme Publicações Ltda, Rio de Janeiro, Brazil
Introduction
Epidemiological studies have shown that obesity verified by the waist circumference (WC) and body mass index (BMI) is a risk factor for the presence of urinary incontinence (UI) and other pelvicfloor disorders.1,2A study3followed women for a period of eight years and found that obesity is also associated with persistent UI, in which BMI30 kg/m2increases by 4.12 times the risk of persistence of symptoms (odds ratio [OR] ¼4.12; 95% confidence interval [95%CI]¼3.82–4.45).
It is believed that this occurs due to high body fat accumu-lation, especially in the abdominal area, which overloads the pelvic floor structures through increased intra-abdominal pressure4and lower activation of the pelvic muscles.5 How-ever, although it is a risk factor well established in the literature,6,7most studies evaluate overweight by BMI and WC. Other anthropometric measurements are still little explored, and also reflect the occurrence of overweight, such as conicity index (CI), waist to height ratio (WHtR) and fat percentage (FP). The use of the CI becomes relevant: since it is based on a probability model aimed to evaluate abdominal adiposity, the index takes into account the individual’s weight and height.8Specifically in the elderly, the WHtR has better predictive ability than BMI and WC;9in addition, FP is an anthropometric indicator widely used in the literature.10,11
In addition to the need of understanding the predictive ability of other measures to UI in older women, it is empha-sized that regular physical activity has been reported as a protective factor for UI in this population,12,13which may
favor another behavior pattern in the use of anthropometric measurements for UI.
Thus, it becomes important to understand the association between these measures and the presence of UI to determine the cutoffs that predict these symptoms in physically active older women. The aim of this study was to assess the diagnostic accuracy of the variables CI, WHtR and FP to detect UI and to determine the cutoff points for the anthropometric indicators that best predict this disease in physically active older women.
Method
Study Type and Sample
This is an analytical cross-sectional study, whose population consisted of 300 older women living in the city of Florianóp-olis, SC, Brazil, who participate in a physical activity program at a university. Data collection was performed from October to December 2010.
The sample was intentionally selected using the following inclusion criteria: woman aged 60 years or older, physically active, and with the absence of symptoms of urinary tract infection. To set the level of physical activity of the partic-ipants, the questions of the Area 4 of the International Physical Activity Questionnaire (IPAQ) were applied. They were related to physical activities of recreation, sports, exercise and leisure held in a normal week, with vigorous and/or moderate intensity for at least 10 minutes continu-ously. Those who reached 150 minutes per week or more were considered physically active.14,15
Resumo
Objetivo
Veri
fi
car a acurácia diagnóstica e o ponto de corte das variáveis índice de
conicidade, razão cintura/estatura e percentual de gordura para detectar a
inconti-nência urinária em idosas
fi
sicamente ativas.
Métodos
Foram avaliadas 152 idosas. Os instrumentos utilizados foram o
Questio-nário Internacional de Atividade Física (IPAQ [Domínio 4]), para veri
fi
car o nível de
atividade física, e a Ficha Diagnóstica, para obter dados sociodemográ
fi
cos e da
presença de incontinência urinária. Para os cálculos de índice de conicidade, razão
cintura/estatura e percentual de gordura, mensuraram-se a massa corporal, estatura e
perímetro da cintura. Utilizou-se estatística descritiva e inferencial. Os pontos de corte,
sensibilidade (S) e especi
fi
cidade (E) foram determinados por meio das curvas
receiver
operating characteristic
(ROC). Adotou-se um nível de signi
fi
cância de 5%.
Resultados
A prevalência de incontinência urinária foi de 32,2%. O ponto de corte
com melhor sensibilidade e especi
fi
cidade do índice de conicidade foi de 1,23
(S
¼
87,8; E
¼
35,9), da razão cintura/estatura, de 0,57 (S
¼
79,6; E
¼
45,6), e,
para percentual de gordura, de 39,71 (S
¼
89,8; E
¼
42,7). A área sob a curva ROC
foi de 0,666 para o índice de conicidade, 0,653 para a razão cintura/estatura, e 0,660
para o percentual de gordura.
Conclusões
Os pontos de corte das medidas antropométricas índice de conicidade,
razão cintura/estatura e percentual de gordura indicam que essas medidas podem ser
utilizadas para predizer incontinência urinária em mulheres idosas
fi
sicamente ativas.
Além disso, o percentual de gordura demonstrou ser a melhor medida para esta
população.
Palavras-chave
►
antropometria
►
curva ROC
Based on these criteria, the sample consisted of 152 physically active older women.
Instruments and Data Collection
For this survey, the ethical principles in accordance with item IV of Resolution 466/2012 of the Brazilian National Health Council were met. The study was submitted to the Ethics Committee of Universidade do Estado de Santa Catarina (UDESC) and approved under protocol number 03/2010. The research was conducted in accordance with the Decla-ration of Helsinki (2008), and all participants signed the Informed Consent Form (ICF).
Data collection was performed by two trained researchers at a previously scheduled date, time and place. First, a diagnostic record containing information about the age, education, marital status and current occupation of the participants was collected through interviews.
The presence of UI was evaluated according to reports of symptoms of UI, defined by Haylen et al16as“complaint of involuntary urine loss”, through the following question: “During the last year, have you lost urine (unintentionally in panties) at least once a month?”When the answer was positive, it was characterized as presence of symptoms of UI. If negative, it was characterized as the absence of symptoms. To check the type of UI, the following questions were asked: “Do you lose urine when you cough, sneeze or carry weight?” If the answer was positive, it was considered effort urinary incontinence (EUI). “Do you lose urine before reaching the toilet after feeling a strong urge to urinate or without perceiving it?”If the answer was positive, it was considered urge urinary incontinence (UUI). When both symptoms were present, it was considered mixed urinary incontinence (MUI).
The anthropometric measurements collected were body weight, height and WC. Body mass was determined by means of a Plenna Wind MEA 07710 digital scale (São Paulo, Brazil), and height by a WCS 217cm stadiometer with a CARDIOMED platform (Curitiba, Brazil). Body mass index was classified using the cutoff point proposed by the World Health Orga-nization (WHO).17The conicity index was calculated using weight, height, WC and the mathematical formula proposed by Valdez et al.8For WC (cm), the circumference relating to the midpoint between the last rib and the iliac crest was measured by means of a measure round tape with 1.50 m of ISP brand (Santa Teresa do Oeste, Brazil).18 The waist to height ratio was determined by dividing WC by stature. Fat percentage was calculated using the body density equation proposed by Tran and Weltman19and Brozek et al.20
Statistical Treatment
Data were stored and analyzed using the Statistical Package for Social Sciences (SPSS, version 20.0, Armonk, USA). The numerical variables were presented as mean and standard deviation (SD), whereas categorical variables were expressed as relative frequency. To verify data distribution, the Kolmo-gorov-Smirnov test was used. Variable CI did not show normal data distribution. To compare the anthropometric measurements (CI, WHtR and FP) and the presence of UI, the
independent t-test or Mann-Whitney U test was used, according to data distribution.
Cutoff points for anthropometric measurements were determined by the Receiver Operating Characteristic (ROC) curves. They identified the total area under the ROC curve and the cutoff points with better sensitivity and specificity for each measure. Values associated with the presence of UI and its subtypes were presented. The comparison between curves was performed in the MedCalc software demo version 3.1.1.1 (Ostend, Belgium). A 5% significance level was adopted.
Results
Overall, 152 physically active older women with a mean age of 68.64 years (SD¼5.79; minimum¼60, maximum¼85) were interviewed. As for sociodemographic characteristics, most of the sample had incomplete primary education (31.1%), were married (52.6%) and retired (55.0%). Regarding BMI, 20.5% had normal weight, 36.4% were overweight, and 43.0% were obese. Among women with UI, 12.2% were classified as having a normal BMI, 30.6% as overweight, and 57.1% as obese.
The prevalence of UI was of 32.2%. Symptoms of urinary loss during efforts was reported by 28.3%, while urinary loss associated with the urge to urinate was 11.2%. For 7.2% of the sample, both symptoms were present. As for anthropometric measurements, the average CI was 1.26 (SD¼0.09), WHtR was 0.59 (SD¼0.07), and FP was 41.72 (SD¼5.61).
Regarding the comparisons of these anthropometric measurements, a significant difference between women with and without UI was observed, as well as between subtypes EUI and UUI. ►Table 1 shows that the average values were higher among women with presence of these symptoms. The effect measure (d Cohen) pointed WHtR with a higher difference between continent and incontinent individuals.
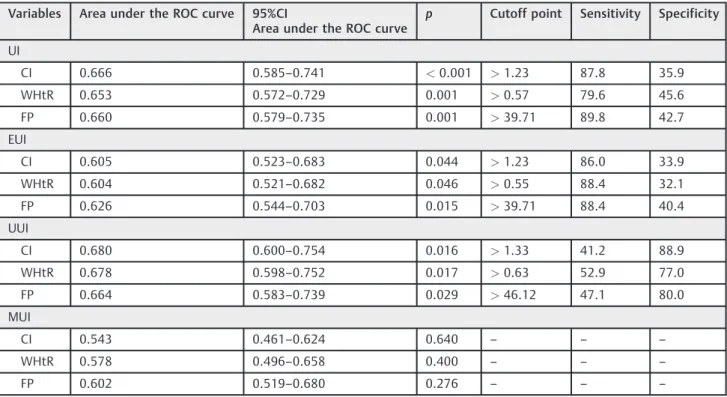
Regarding the cutoff points of the CI (►Table 2), the area under the ROC curve was 0.666. The cutoff point of 1.23 or more is the most suitable balance between sensitivity and specificity. In this cutoff point, the power of the CI to properly classify physically active older women with UI was high (87.8% - sensitivity), while the power to correctly classify women without urinary incontinence was considered low (35.9% - specificity).
With respect to WHtR and the presence of UI (►Table 2), we observed that the area under the ROC curve was 0.653. The cutoff point of 0.57 or more is the most suitable balance between sensitivity and specificity. In this cutoff point, the power of WHtR to properly classify physically active older women with UI was 79.6% (sensitivity), while the power of WHtR to correctly classify women without UI was 45.6% (specificity).
Table 2 Area under the ROC curve, significance level (p), cutoff points, sensitivity and specificity of the conicity index (CI), waist to height ratio (WHtR) and fat percentage (FP) as discriminators of the presence of urinary incontinence (UI) and its subtypes in physically active older women (n¼152)
Variables Area under the ROC curve 95%CI
Area under the ROC curve
p Cutoff point Sensitivity Specificity
UI
CI 0.666 0.585–0.741 <0.001 >1.23 87.8 35.9
WHtR 0.653 0.572–0.729 0.001 >0.57 79.6 45.6
FP 0.660 0.579–0.735 0.001 >39.71 89.8 42.7
EUI
CI 0.605 0.523–0.683 0.044 >1.23 86.0 33.9
WHtR 0.604 0.521–0.682 0.046 >0.55 88.4 32.1
FP 0.626 0.544–0.703 0.015 >39.71 88.4 40.4
UUI
CI 0.680 0.600–0.754 0.016 >1.33 41.2 88.9
WHtR 0.678 0.598–0.752 0.017 >0.63 52.9 77.0
FP 0.664 0.583–0.739 0.029 >46.12 47.1 80.0
MUI
CI 0.543 0.461–0.624 0.640 – – –
WHtR 0.578 0.496–0.658 0.400 – – –
FP 0.602 0.519–0.680 0.276 – – –
Abbreviations: CI, conicity index; EUI, effort urinary incontinence; FP, fat percentage; MUI, mixed urinary incontinence;p, significance level; ROC, receiver operating characteristic; UI, urinary incontinence; UUI, urge urinary incontinence; WHtR, waist to height ratio.
Table 1 Comparison of the anthropometric measurements conicity index (CI), waist to height ratio (WHtR) and fat percentage (FP) among women with and without urinary incontinence (UI) and its subtypes (n¼152)
Variables CIA SD WHtRB SD FP (%)B SD
UI
Yes (n¼49) No (n¼103)
1.29 1.25
p¼0.001
d¼0.50
0.07 0.09
0.62 0.57
p¼0.001
d¼0.77
0.06 0.07
43.92 40.67
p¼0.001
d¼0.64
4.32 5.86
EUI
Yes (n¼43) No (n¼109)
1.29 1.26
p¼0.044
d¼0.40
0.06 0.09
0.61 0.58
p¼0.015
d¼0.46
0.06 0.07
43.62 40.96
p¼0.008
d¼0.52
4.34 5.89
UUI
Yes (n¼17) No (n¼135)
1.31 1.26
p¼0.015
d¼0.67
0.06 0.09
0.63 0.58
p¼0.018
d¼0.77
0.06 0.07
44.66 41.35
p¼0.021
d¼0.63
4.96 5.60
MUI
Yes (n¼11) No (n¼141)
1.28 1.26
p¼0.633
0.06 0.09
0.61 0.59
p¼0.325
0.06 0.07
43.89 41.55
p¼0.18
5.47 5.61
Abbreviations: CI, conicity index; d, d Cohen; EUI, effort urinary incontinence; FP, fat percentage; MUI, mixed urinary incontinence;p, significance level; SD, standard deviation; UI, urinary incontinence; UUI, urge urinary incontinence; WHtR, waist to height ratio.
while its power to correctly classify women without UI was considered low (42.7% - specificity). It is noteworthy that this measure had the best balance between specificity and sen-sitivity values for the study population.
The cutoff points and sensitivity and specificity values were similar when the presence of EUI and anthropometric measurements (►Table 2) was identified. The high preva-lence of effort symptoms can explain this similarity. As for UUI, lower sensitivity values and higher specificity values were observed. It was not possible to identify a cutoff point for the presence of MUI.
►Fig. 1shows a comparison between the areas of the ROC curves for CI, WHtR and FP associated with the occurrence of UI. This difference between areas was 0.013 (p¼0.745) for CI and WHtR, 0.006 (p¼0.902) for CI and FP, and 0.007 (p¼0.750) for WHtR and FP.
Discussion
We observed that physically active older women with UI had higher mean values for anthropometric measurements when compared with those without it. In addition, the cutoff points with the best balance between sensitivity and specificity for the CI, WHtR and FP showed high sensitivity and low specificity values.
The low specificity value, which is the ability of the cutoff point to detect healthy individuals, can be explained by several factors. There is the possibility of not observing an optimal cutoff point in studies with a small sample size, which is an obstacle to estimate those values.21Another factor that may explain the low specificity of cutoff points for anthropometric measurements is the regular practice of physical activity22and increased abdominal fat during the aging process.23
When specifying cutoffs for anthropometric measure-ments to predict UI in older women, it should be taken into account that there is an increase in body fat, especially after menopause. This increase in body fat is well reported in
the literature as a risk factor for UI in adults and older adults,3,7which leads to a chronic increase in intra-abdomi-nal pressure and symptoms of urinary loss.4In addition, this increase in abdominal fat occurs during the aging process, which can be one of the factors that explain the low specifi c-ity values of the cutoff points established in this study.
Studies aimed at establishing cutoff points for anthropo-metric measurements to predict UI are scarce in the litera-ture, especially in relation to older adults. However, a study by Sacomori et al24 proposed cutoff points for the adult population that were followed in the female cancer combat network of Florianópolis, SC, Brazil. We observed that, despite the fact that the characteristics of that sample are different from sample of the present study, the CI showed the same cutoff point (1.23; sensitivity 35.9; specificity 84.3), but with greater predictive ability to detect healthy subjects. The cutoff point established in the above-mentioned study for WHtR was 0.51 (sensitivity 59.0; specificity 63.7). This 6 cm difference when compared with the cutoff point given in this study may be explained by the physical changes during the aging process,23in which there is loss of height25 and higher fat accumulation in the abdominal region.23
Furthermore, as mentioned above, changes in physical dimensions often verified by BMI and waist circumference (WC) are well reported in the literature as a risk factor for UI in older women.7,26However, the difference in cutoff points used for the classification of individuals for use in analysis techniques hinders the comparison of results. Furthermore, the study found that in long-lived older women the WHtR showed better predictive ability of abdominal fat (sensitivity 97.5) compared with BMI and WC.9
Furthermore, in relation to the BMI and WC of physically active older women, the study found that these anthropomet-ric measurements are not a risk factor associated with UI in this population.27Another important factor is that the perceived aerobic capacity (able to run for 30 minutes) is associated with better muscle function of the pelvicfloor (OR¼1.63; 95%CI
1.27–2.09),28which can reduce the association between these anthropometric variables and the presence of UI.
Conclusion
We observed that the anthropometric measurements WHtR, FP and CI are associated with the presence of UI. Cutoffs assigned to these measures to predict UI showed high sensitivity and low specificity for physically active older women.
Further studies should be conducted using more reli-able measures to assess the body composition of the participants, as well as an urodynamic evaluation of UI. Nevertheless, the easy measurement of these measures and the high sensitivity of cutoff values to predict UI in physically active older women are emphasized. Due to their easy measurement, these measures can be included in the routine assessment of physically active older women by health professionals, thus contributing to preventive actions and UI diagnosis.
References
1 Subak LL, Wing R, West DS, et al; PRIDE Investigators. Weight loss to treat urinary incontinence in overweight and obese women. N Engl J Med 2009;360(5):481–490
2 Vaughan CP, Auvinen A, Cartwright R, et al. Impact of obesity on urinary storage symptoms: results from the FINNO study. J Urol 2013;189(4):1377–1382
3 Devore EE, Minassian VA, Grodstein F. Factors associated with persistent urinary incontinence. Am J Obstet Gynecol 2013; 209(2):145.e1–145.e6
4 Hunskaar S. A systematic review of overweight and obesity as risk factors and targets for clinical intervention for urinary inconti-nence in women. Neurourol Urodyn 2008;27(8):749–757
5 Talasz H, Himmer-Perschak G, Marth E, Fischer-Colbrie J, Hoefner E, Lechleitner M. Evaluation of pelvicfloor muscle function in a random group of adult women in Austria. Int Urogynecol J Pelvic Floor Dysfunct 2008;19(1):131–135
6 Townsend MK, Danforth KN, Rosner B, Curhan GC, Resnick NM, Grodstein F. Body mass index, weight gain, and incident urinary incontinence in middle-aged women. Obstet Gynecol 2007;110 (2 Pt 1):346–353
7 Krause MP, Albert SM, Elsangedy HM, Krinski K, Goss FL, daSilva SG. Urinary incontinence and waist circumference in older wom-en. Age Ageing 2010;39(1):69–73
8 Valdez R. A simple model-based index of abdominal adiposity. J Clin Epidemiol 1991;44(9):955–956
9 Santos VR, Christofaro DGD, Gomes IC, Santos LL, Freitas Júnior IF. Predictive capacity of anthropometric indicators for abdominal fat in the oldest old. Rev Bras Cineantropom Desempenho Hum. 2013;15(5):561–569
10 Gao HL, Gao HX, Sun FM, Zhang L. Effects of walking on body composition in perimenopausal and postmenopausal women: a systematic review and meta-analysis. Menopause 2016; [E-pub ahead of print]
11 Rech CR, Lima LRA, Cordeiro BA, Petroski EL, Vasconcelos FAG. Validade de equações antropométricas para a estimativa da
gordura corporal em idosos do sul do Brasil. Rev Bras Cinean-tropom Desempenho Hum. 2010;12(1):1–7
12 Danforth KN, Shah AD, Townsend MK, et al. Physical activity and urinary incontinence among healthy, older women. Obstet Gy-necol 2007;109(3):721–727
13 Lee AH, Hirayama F. Physical activity and urinary incontinence in older adults: a community-based study. Curr Aging Sci 2012;5(1): 35–40
14 International Physical Activity Questionnaire (IPAQ) [Internet]. Guidelines for data processing and analysis of the International Physical Activity Questionnaire (IPAQ): short and long forms. 2005 [cited 2015 Oct 12]. Available from: http://www.academia. edu/5346814/Guidelines_for_Data_Processing_and_Analysi- s_of_the_International_Physical_Activity_Questionnaire_IPAQ_-Short_and_Long_Forms_Contents
15 Mazo GZ, Benedetti TRB. Adaptação do questionário internacional de atividade física para idosos. Rev Bras Cineantropom Desem-penho Hum. 2010;12(6):480–484
16 Haylen BT, de Ridder D, Freeman RM, et al. An International Urogynecological Association (IUGA)/International Continence Society (ICS) joint report on the terminology for female pelvic
floor dysfunction. Int Urogynecol J 2010;21(1):5–26
17 World Health Organization. Obesity: preventing and managing the global epidemic: report of a WHO consultation. Geneva: World Health Organization; 1998. (WHO Technical Report Series, 894)
18 Norton K, Whittingham N, Carter L, Kerr D, Gore C, Marfell-Jones M. Técnicas de medição em antropometria. In: Norton K, Olds T, editors. Antropométrica. Porto Alegre: Artmed; 2005.p. 41–87
19 Tran ZV, Weltman A. Generalized equation for predicting body density of women from girth measurements. Med Sci Sports Exerc 1989;21(1):101–104
20 Brozek J, Grande F, Anderson JT, Keys A. Densitometry analysis of body composition: revision of some quantitative assumptions. Ann N Y Acad Sci 1963;110:113–140
21 Martinez EZ, Louzada-Neto F, Pereira BB. A curva ROC para testes diagnósticos. Cad Saúde Coletiva. 2003;11(1):7–31
22 Bray GA, Frühbeck G, Ryan DH, Wilding JPH. Management of obesity. Lancet 2016;387(10031):1947–1956
23 Gravena AAF, Brischiliari SCR, Lopes TCR, Agnolo CMD, Carvalho MDB, Pelloso SM. Excess weight and abdominal obesity in post-menopausal Brazilian women: a population-based study. BMC Womens Health 2013;13:46
24 Sacomori C, Vinter CR, Sperandio FF, Pereira EF, Cardoso FL. Propuesta de puntos de corte para diferentes indicadores antro-pométricos en la predicción de la incontinencia urinaria en mujeres. Rev Chil Obstet Ginecol 2015;80(3):229–235
25 de Menezes TN, de Fátima Nunes Marucci M. Anthropometry of elderly people living in geriatric institutions, Brazil. Rev Saude Publica 2005;39(2):169–175
26 Moreno-Vecino B, Arija-Blázquez A, Pedrero-Chamizo R, et al; EXERNET Group. Associations between obesity, physicalfitness, and urinary incontinence in non-institutionalized postmeno-pausal women: The elderly EXERNET multi-center study. Matur-itas 2015;82(2):208–214
27 Virtuoso JF, Menezes EC, Mazo GZ. [Risk factors for urinary incontinence in elderly women practicing physical exercises]. Rev Bras Ginecol Obstet 2015;37(2):82–86. Portuguese