Quim. Nova, Vol. 32, No. 5, 1180-1183, 2009
Artigo
*e-mail: [email protected]
DEVELOPMENT AND APPLICATION OF SPECTROPHOTOMETRIC METHOD FOR THE DETERMINATION OF CEFACLOR IN PHARMACEUTICAL FORMULATIONS
Asad Raza*
Analytical Laboratory, Bio Fine Pharmaceuticals (Pvt.) Ltd., Multan, Pakistan
Abdul Subhan Ijaz and Shabbir Ahmad
Faculty of Pharmacy, Bahauddin Zakariya University, Multan 60800, Pakistan
Recebido em 18/5/08; aceito em 13/1/09; publicado na web em 28/5/09
A simple, fast and sensitive spectrophotometric method for the determination of cefaclor in pharmaceutical raw and dosage forms based on reaction with ninhydrin is developed, optimized and validated. The purple color (Ruhemenn’s purple) that resulted from the reaction was stabilized and measured at 560 nm. Beer’s law is obeyed in the concentration range of 4-80 µg mL-1 with molar absorptivity of 1.42 × 10⁵ L mole-1 cm-1. All variables including the reagent concentration, heating time, reaction temperature, color stability period, and cefaclor/ninhydrin ratio were studied in order to optimize the reaction conditions. No interference was observed from common pharmaceutical adjuvant. The developed method is easy to use, accurate and highly cost-effective for routine studies relative to HPLC and other techniques.
Keywords: spectrophotometric; Cefaclor; pharmaceutical formulations.
INTRODUCTION
Cefaclor belongs to the family of antibiotics known as the cephalosporins (cefalosporins). The cephalosporins are broad-spectrum antibiotics which are used for the treatment of septicaemia, pneumonia, meningitis, biliary-tract infections, peritonitis, and urinary-tract infections. The pharmacology of the cephalosporins is similar to that of the penicillins, excretion being principally renal. Cephalosporins penetrate the cerebrospinal fluid poorly unless the meninges are inflamed. Cefaclor is active against many bacteria, including both negative and Gram-positive organisms.1,2
Numerous analytical procedures have been reported for the determination of cefaclor in its pure form, in pharmaceutical prepa-rations and in biological fluids. The USP XXII recommends the hydroxylamine colorimetric assay.3 HPLC methods were described for the determination of cefaclor in human plasma and urine.4,5 Also iodometric6 and polarographic7 determination of cefaclor has been reported. A spectrofluorimetric method is described for the determi-nation of cefaclor in formulations and biological fluids.8 Only two spectrophotometric methods9,10 are available for the determination of cefaclor in pharmaceutical raw and dosages forms. The first method is less sensitive, while the second involves the degradation of the product.
Many of these methods are either not sensitive enough or require complicated and expensive instruments, or are subjected to interferences from other ions, suffer from narrow calibration range, toxicity of the reagents used, or more or less are time consuming.
The proposed method in the present paper offers the advantages of simplicity, rapidity and specificity without the need of extraction or degradation having higher selectivity range than most of the existing spectrophotometric methods. The aim of this work is to develop fast, sensitive, accurate and extraction free spectrophotometric method for the routine analysis of cefaclor in pharmaceutical quality control laboratories.
EXPERIMENTAL
Apparatus
All spectrophotometric measurements were carried out using a spectrophotometer (U 1100 Hitachi, Japan) with silica glass cell of 1 cm thickness. Officially calibrated Pyrex glassware was used throughout this study.
Materials
Lahore Chemical and Pharmaceutical Works, Lahore, Pakistan supplied pure cefaclor. Standard stock solution of cefaclor was pre-pared by dissolving 50 mg pure drug in 30 mL of phosphate buffer solution of pH 8 and diluted to the mark in 100 mL calibrated flask with same solvent. In the same manner, a stock solution of 2 ×10⁻³ mol L-1 of drug and ninhydrin were also prepared. These solutions are stable for a period of 3 d when refrigerated (4 °C). A 1 mol L-1 phosphate buffer solution of pH 8.0 was prepared by dissolving 13.61 g of potassium dihydrogen phosphate (Merck) in a 100 mL measuring flask and made up to volume with distilled water. The pH was adjusted by 0.1 mol L-1 solution of sodium hydroxide.
Recommended analytical procedure
Different aliquots of standard stock solution equivalent to 4-80 µg mL-1 were transferred into a series of 10 mL volumetric flasks, 2 mL of ninhydrin was added and the mixture was heated in a water bath at 80 ± 5 °C for 15 min. The flasks were cooled and the volume was made up to the mark with phosphate buffer. The absorbance was measured at 560 nm against a reagent blank.
Analysis of dosage forms
Capsules
Development and application of spectrophotometric method 1181 Vol. 32, No. 5
the capsule contents was calculated. An accurately weighed portion of the mixed capsule contents equivalent to 50 mg cefaclor was trans-ferred into 100 mL volumetric flask. The mixture was sonicated for few minutes, diluted to volume with the phosphate buffer, mixed and filtered through Whatman filter paper 41. A portion of the filtrate was transferred into 10 mL volumetric flask and used for the determination of the drug content following the procedure described above.
Suspensions
A quantity of powder equivalent to 50 mg of cefaclor was trans-ferred into a 100 mL calibrated flask, dissolved in phosphate buffer, and manipulated as described in the analysis of capsules.
Determination of molar ratio of the reactions
The Job’s method of continuous variation11,12 was employed to establish the stoichiometry of the colored product. A 2 × 10⁻² mol L-1 standard solution of cefaclor and a 2 ×10⁻² mol L-1 solution of ninhydrin were used. A series of solutions was prepared in which the total volume of drug and reagent was constant (2.0 mL). The reagents were mixed in various proportions (0:10, 1:9, . . . 9:1, 10:0) and dilu-ted in a 10 mL calibradilu-ted flask with Phosphate buffer. The reactions were allowed to proceed at (80 ± 5 °C). The reaction mixtures were completed to volume with phosphate buffer, and the absorbance was measured at 560 nm against reagent blank
RESULTS AND DISCUSSION
Ninhydrin is a well-established reagent for the determination of cer-tain amines, amino acids and thiophenes.13 It has been extensively used in the determination of the compounds of pharmaceutical importance.14-16
Reaction involved and optimization of reaction conditions
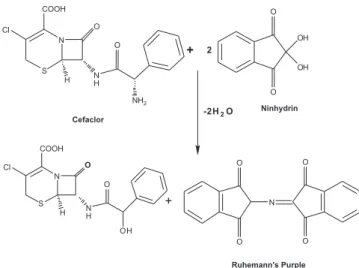
It was suggested that the reactions of ninhydrin with amine, amino acids and imino acids all proceed by the same mechanism to give diketohydrindylidene-diketohydrindamine or the Ruhemann’s purple.17 This compound would further react with amino group of cefaclor to give the product, which absorb maximally at 560 nm as shown in Figure1. The optimum conditions for determination of cefaclor were established.
Cefaclor reacts with ninhydrin reagent in phosphate buffer me-dium via oxidative deamination of the primary amino group followed by the condensation of the reduced ninhydrin to form the colored reaction product Ruhemenn’s purple with λ
max at 560 nm (Scheme 1). To optimize the reaction conditions, we have investigated a number of parameters such as heating time, reagent concentration, temperature, pH, stability of color and solvent. Varying one variable and observing its effect on the absorbance of the colored product established the optimum reaction conditions.
Stoichiometry of the colored product
The molar ratio of the colored product formed between cefaclor and ninhydrin reagent was investigated by applying the continuous variation Job’s method using an equimolar solution of the drug and the reagent. The result indicated that the colored product was formed at the 1:2 ratio shown in the reaction Scheme 1 and Figure 2.
Effect of heating time
A 4.0 mL aliquot of a 100 µg mL-1 cefaclor solution was mixed with 2 mL of ninhydrin solution. The reaction mixture was heated on a water bath at 80 ± 5 °C. A colored product was obtained and the color intensity reached its maximum value after 15 min of heating. After reaching the ambient temperature, the reaction mixture was transferred to a 10 mL volumetric flask and diluted to the mark with pH 8.0 phosphate buffer. Hence, the absorbance was measured after 15 min of heating. The results are shown in Figure 3.
Figure 2. Continuous variation plot for the reaction of Cefaclor and ni-nhydrin
Figure 3. Effect of heating time on color development
Figure 1. Wavelength maximum of Cefaclor and ninhydrin complex
Raza et al.
1182 Quim. Nova
Effect of ninhydrin concentration
To 4 mL of 100 µg mL-1 cefaclor solution, different volumes (0.5-4 mL) of 0.2 % ninhydrin were added. The reaction mixtures were heated for 15 min on a water bath at 80 ± 5 °C. The colored product was di-luted to 10 mL with phosphate buffer of pH 8 and the absorbance was measured against a reagent blank at 560 nm. The results showed that the highest absorbance was obtained with 2 mL of ninhydrin solution that remained unaffected with higher amounts (Figure 4).
Effect of temperature
To 4 mL of 100 µg mL-1 cefaclor solution, 2 mL of ninhydrin were added. The reaction mixtures were heated for 15 min on a water bath at 20-100 °C. The colored product was diluted to 10 mL with phosphate buffer of pH 8 and the absorbance was measured against a reagent blank at 560 nm. The results showed that the highest ab-sorbance was obtained at 80 ± 5 °C (Figure 5). The developed color was stable for 2 h.
Effect of pH on color development
The ninhydrin reacts with cefaclor in basic medium. It is reported that pH effect under certain conditions on the ninhydrin reaction may have a fluctuating effect.18 In our study, sample absorbance increased with an increase of the pH of the sample solution from 7.0 to 8.0, thus, phosphate buffer with pH 8.0 was selected for further studies.
Effect of solvents
Different dilution solvents such as water, ethanol, methanol, isopropanol, acetone, dioxan and acetonitrile have been tried, but water gave the best results.
Analytical parameters of proposed method
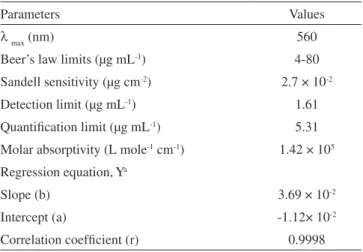
Beer’s law limit, molar absorptivity, detection limit and correlation coefficient were obtained by least square treatment of results. The linear relationship was found between absorbance at λ
max and concentration of drug in the range 4-80 µg mL-1 (Figure 6). High values of Correla-tion coefficient (r=0.9998) and small value of intercept validated the linearity of calibration curve and obedience to Beer’s law.
The apparent molar absorptivity and Sandell sensitivity values together with the limits of detection (LOD) and quantification (LOQ) compiled in Table 1 are indicative of the high sensitivity of the propo-sed method. The LOD and LOQ were calculated using LOD = 3.3 s/S and LOQ = 10 s/S, where s is the standard deviation of seven blank determinations and S is the slope of the calibration curve.
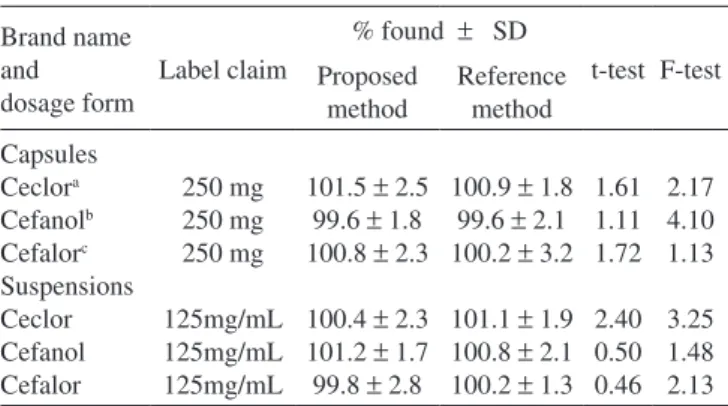
Application of proposed method
Commercially available capsules and suspensions were success-fully analyzed for the cefaclor content by the proposed method. The assay results are presented in Table 2. As can be seen from the Table 2, the results obtained agreed with the label claim and also those of the re-ference method.19 The performance of the proposed method was judged further by the Student’s t-test for accuracy and F-test for precision. At the 95% confidence level, the calculated t- and F-values did not exceed the tabulated values (t = 2.77 and F = 6.39) suggesting that the method is as accurate and precise as the reference method. The accuracy and validity of the proposed method was further ascertained by performing recovery studies. The pre-analyzed capsule powder/suspension solution was spiked with pure cefaclor at three levels and the total was found by the proposed method. Each determination was repeated three times. The results summarized in Table 3 reveal good recoveries of pure drug added and non-interference from capsule excipients such as magnesium stearate, lactose and talc and suspension excipients such as sucrose, cellulose gum, aerosil, citric acid, and sodium benzoate.
The proposed method is favorably compared with other existing spectrophotometric methods as shown in Table 4.
Interference liabilities
Before proceeding with the analysis of cefaclor in their
phar-Figure 4. Effect of reagent concentration on color development
Figure5. Effect of temperature on color development
Figure 6. Beer’s law verification range
Table 1. Spectral data for the reaction of cefaclor with ninhydrin
Parameters Values
λ
max (nm) 560
Beer’s law limits (µg mL-1) 4-80
Sandell sensitivity (µg cm-2) 2.7 × 10⁻²
Detection limit (µg mL-1) 1.61
Quantification limit (µg mL-1) 5.31
Molar absorptivity (L mole-1 cm-1) 1.42 × 10⁵ Regression equation, Ya
Slope (b) 3.69 × 10⁻²
Intercept (a) -1.12× 10⁻²
Correlation coefficient (r) 0.9998
Development and application of spectrophotometric method 1183 Vol. 32, No. 5
Table 3. Results of recovery study by standard addition method
Formulation and dosage form Cefaclor in sample (mg) Pure cefaclor added (mg) Total cefa-clor found (mg) Pure cefaclor recovered (%) Ceclor Capsules (250 mg) Cefanol Suspension (125 mg/mL) 250 250 250 125 125 125 5 10 15 10 20 30 255.4 260.6 264.8 134.9 145.5 155.2 100.1 100.2 99.92 99.93 100.3 100.1 Percent recovered is the mean value of three determinations
Table 4. Comparison of the proposed method with existing spectrophotometeric methods
S. No. λ
max (nm) Beer’s law range µg mL
-1 Molar absorptivity L mol-1 cm-1 Reagent Ref.
1 520 40-400 0.84 Chloranilic acid 9
2 340 1.8-55 - Degradation with
phos-phate buffer of pH 10 10
3 560 4-80 1.42 × 10⁵ Ninhydrin Present work
Table 5. Percent recovery of the cefaclor in the presence of various excipients
Excipients Amount taken
(µg mL-1)
% Recovery ± RSD (n =5) Magnesium stearate Lactose Talc Sucrose Cellulose gum Aerocil Citric acid Sodium benzoate 60 300 60 100 90 100 80 70
100.2 ± 0.45 99.21 ± 0.36 99.45 ± 0.25 100.4 ± 0.85 101.2 ± 0.71 99.31 ± 0.15 99.9 2 ± 0.40 99.56 ± 0.36
maceutical dosage forms, interference liabilities were carried out to explore the effect of common excipients that might be added during formulations. Samples were prepared by mixing known amount (20 µg mL-1) of the drug with various amounts of the common excipients: Magnesium stearate, Lactose, Talc, Sucrose, Cellulose gum, Aerocil, Citric acid and Sodium benzoate. The analysis of these laboratory prepared samples was carried out using the recommended procedure, and the recovery values were determined. No interference was found from these excipients and the recovery values were 99.21-101.2 % (Table 5). This indicated the absence of interference liabilities from these excipients.
CONCLUSION
The data given above reveal that the proposed method is simple, accurate and sensitive with good precision and accuracy. With this method one can do rapid analyses at low cost without losing accu-racy. The proposed method can be used as alternative method to the reported ones for the routine determination of cefaclor in
pharma-ceutical raw and dosage forms. This encourages its successful use in routine analysis of cefaclor in quality control laboratories.
REFERENCES
1. Hebert, A.; Sigman, E.; Levy, M.; J. Am. Acad. Dermatol. 1991, 25 , 805. 2. Parra, F.; Igea, J.; Martín, J.; Alonso, M.; Lezaun, A.; Sainz, T.; Allergy
1992, 47, 439.
3. Mays, D. L.; Bangert, F. K.; Cantrell, W. C.; Evans, W. G.; Anal. Chem.
1975, 47, 2229.
4. Kovach, P. M.; Lantz, R. J.; Brier, G.; J. Chromatogr. 1991, 567, 129. 5. Nakata, M. C.; J. Chromatogr. 1982, 228, 429.
6. Yamana, T.; Tsuji, A.; J. Pharm. Sci. 1976, 65, 1563.
7. Rodrigues, L. N. C.; Zanoni, M. V. B.; Fogg, A.G.; J. Pharm.Biomed. Anal. 1999, 21, 497.
8. Aly, F. A.; Hefnawy, M. M.; Belal, F.; Anal. Lett. 1996, 29, 117. 9. Saleh, G. A.; Askal, H. F.; Darwish, I. A.; El-Shorbagi, A. N.; Anal. Sci.
2003, 19, 281.
10. Ivama,V. M.; Rodrigues, L. N. C.; Guaratini, C. C. I.; Zanoni, M. V. B.; Quim. Nova 1999, 22, 201.
11. Job, P.; Anal. Chem. 1936, 16, 97.
12. Job, P.; Advanced Physicochemical Experiments, 2nd ed., Oliner and Boyd: Edinburgh, 1964, p. 54.
13. Fiegel, F.; Spot Tests in Organic Analysis, Elsevier Publishing Co.: London, 1960.
14. Raza, A.; Ansari, T. M.; Rehman, A.; J. Chin. Chem. Soc. 2005, 52, 1055.
15. Raza, A.; Ansari, T. M.; Rehman, A.; Anal. Sci. 2005, 21, 1133. 16. Rahman, N.; Singh, M.; Hoda, M. N.; J. Braz. Chem. Soc. 2005, 16,
1001.
17. McCaldin, D. J.; Chem. Rev. 1960, 60, 39.
18. Sheng, S.; Kraft, J. J.; Schuster, S. M.; Anal. Biochem. 1993, 211, 242. 19. British Pharmacopoeia, HM Stationary Office: London, 2003, p. 267.
Table 2. Results of Analysis of commercial formulations containing cefaclor and statistical comparison with reference method19 Brand name
and dosage form
Label claim
% found ± SD
t-test F-test Proposed method Reference method Capsules Ceclora Cefanolb Cefalorc Suspensions Ceclor Cefanol Cefalor 250 mg 250 mg 250 mg 125mg/mL 125mg/mL 125mg/mL
101.5 ± 2.5 99.6 ± 1.8 100.8 ± 2.3 100.4 ± 2.3 101.2 ± 1.7 99.8 ± 2.8
100.9 ± 1.8 99.6 ± 2.1 100.2 ± 3.2 101.1 ± 1.9 100.8 ± 2.1 100.2 ± 1.3