ACPD
15, 9445–9505, 2015Vertical profiling of aerosol hygroscopic
properties
B. Rosati et al.
Title Page
Abstract Introduction
Conclusions References
Tables Figures
◭ ◮
◭ ◮
Back Close
Full Screen / Esc
Printer-friendly Version Interactive Discussion
Discussion
P
a
per
|
Discussion
P
a
per
|
Discussion
P
a
per
|
Discussion
P
a
per
|
Atmos. Chem. Phys. Discuss., 15, 9445–9505, 2015 www.atmos-chem-phys-discuss.net/15/9445/2015/ doi:10.5194/acpd-15-9445-2015
© Author(s) 2015. CC Attribution 3.0 License.
This discussion paper is/has been under review for the journal Atmospheric Chemistry and Physics (ACP). Please refer to the corresponding final paper in ACP if available.
Vertical profiling of aerosol hygroscopic
properties in the planetary boundary layer
during the PEGASOS campaigns
B. Rosati1, M. Gysel1, F. Rubach2,3,*, T. F. Mentel2, B. Goger1,**, L. Poulain3, P. Schlag2, P. Miettinen4, A. Pajunoja4, A. Virtanen4, J. Bialek5, H. Klein Baltink6, J. S. Henzing7, J. Größ3, G. P. Gobbi8, A. Wiedensohler3, A. Kiendler-Scharr2, C. O’Dowd5, S. Decesari9, M. C. Facchini9, E. Weingartner1,***, and
U. Baltensperger1
1
Laboratory of Atmospheric Chemistry, Paul Scherrer Institute (PSI), 5232 Villigen, Switzerland
2
Institute for Energy and Climate Research (IEK-8), Forschungszentrum Jülich, 52428 Jülich, Germany
3
Leibniz Institute for Tropospheric Research, 04318 Leipzig, Germany 4
Department of Applied Physics, University of Eastern Finland, 1627 Kuopio, Finland 5
School of Physics and Centre for Climate and Air Pollution Studies, National University of Ireland Galway, Galway, Ireland
6
ACPD
15, 9445–9505, 2015Vertical profiling of aerosol hygroscopic
properties
B. Rosati et al.
Title Page
Abstract Introduction
Conclusions References
Tables Figures
◭ ◮
◭ ◮
Back Close
Full Screen / Esc
Printer-friendly Version Interactive Discussion
Discussion
P
a
per
|
Discussion
P
a
per
|
Discussion
P
a
per
|
Discussion
P
a
per
|
7
Netherlands Organization for Applied Scientific Research (TNO), 80015 Utrecht, the Netherlands
8
Institute of Atmospheric Sciences and Climate (ISAC-CNR), National Research Council, 00133 Rome, Italy
9
Institute of Atmospheric Sciences and Climate (ISAC-CNR), National Research Council, 40129 Bologna, Italy
*
now at: Max Planck Institute for Chemistry, 55128 Mainz, Germany **
now at: Institute of Meteorology and Geophysics, University of Innsbruck, 6020 Innsbruck, Austria
***
now at: Institute for Aerosol and Sensor Technology, University of Applied Science Northwestern Switzerland, 5210 Windisch, Switzerland
Received: 26 January 2015 – Accepted: 14 March 2015 – Published: 31 March 2015
Correspondence to: M. Gysel ([email protected])
ACPD
15, 9445–9505, 2015Vertical profiling of aerosol hygroscopic
properties
B. Rosati et al.
Title Page
Abstract Introduction
Conclusions References
Tables Figures
◭ ◮
◭ ◮
Back Close
Full Screen / Esc
Printer-friendly Version Interactive Discussion
Discussion
P
a
per
|
Discussion
P
a
per
|
Discussion
P
a
per
|
Discussion
P
a
per
|
Abstract
Airborne measurements of the aerosol hygroscopic and optical properties as well as chemical composition were performed in the Netherlands and northern Italy on board of a Zeppelin NT airship during the PEGASOS field campaigns in 2012. The vertical changes in aerosol properties during the development of the mixing layer were
stud-5
ied. Hygroscopic growth factors (GF) at 95 % relative humidity were determined using the white-light humidified optical particles spectrometer (WHOPS) for dry diameters of 300 and 500 nm particles. These measurements were supplemented by an aerosol mass spectrometer (AMS) and an aethalometer providing information on the aerosol chemical composition.
10
Several vertical profiles between 100 and 700 m a.g. were flown just after sunrise close to the San Pietro Capofiume ground station in the Po Valley, Italy. During the early morning hours the lowest layer (newly developing mixing layer) contained a high nitrate fraction (20 %) which was coupled with enhanced hygroscopic growth. In the layer above (residual layer) small nitrate fractions of ∼2 % were measured as well
15
as low GFs. After full mixing of the layers, typically around noon and with increased temperature, the nitrate fraction decreased to 2 % at all altitudes and led to similar hy-groscopicity values as found in the residual layer. These distinct vertical and temporal changes underline the importance of airborne campaigns to study aerosol properties during the development of the mixed layer. The aerosol was externally mixed with 22
20
and 67 % of the 500 nm particles in the range GF<1.1 and GF>1.5, respectively. Contributors to the non-hygroscopic mode in the observed size range are most likely mineral dust and biological material. Mean hygroscopicity parameters (κ) were 0.34, 0.19 and 0.18 for particles in the newly forming mixing layer, residual layer and fully mixed layer, respectively. These results agree well with those from chemical analysis
25
which found values ofκ=0.27, 0.21 and 0.19 for the three layers. The highestκ
ACPD
15, 9445–9505, 2015Vertical profiling of aerosol hygroscopic
properties
B. Rosati et al.
Title Page
Abstract Introduction
Conclusions References
Tables Figures
◭ ◮
◭ ◮
Back Close
Full Screen / Esc
Printer-friendly Version Interactive Discussion
Discussion
P
a
per
|
Discussion
P
a
per
|
Discussion
P
a
per
|
Discussion
P
a
per
|
The aerosol sampled in the Netherlands did not show any altitude dependent char-acteristics because only the fully mixed layer or the entrainment zone between mixed and the residual layer were probed. The airborne hygroscopicity measurements agreed well with ground based composition measurements. However, the fraction of the hygro-scopic particles (GF>1.5) was enhanced compared to the results from Italy amounting
5
to 82 %, while 12 % showed low hygroscopicity (GF<1.1). The meanκvalue measured by the WHOPS was 0.28 and therefore considerably higher than the value measured in the fully mixed layer in Italy.
The effective index of refraction reached values of 1.43 and 1.42 for the 500 nm
particles in Italy and the Netherlands, respectively. This coincides well with literature
10
data for airmasses with predominant organic contribution as was the case during our flights.
1 Introduction
Aerosol particles can directly have an impact on climate by absorbing or scattering the solar radiation. The optical properties depend on the particles’ size as well as their
15
chemical composition and can be altered at elevated relative humidities (RH) if the particles are hygroscopic (IPCC, 2013).
Most particles are emitted or formed in the planetary boundary layer (PBL), which describes the lowermost layer of the troposphere. The PBL is subject to many changes depending on the strength of the incident solar radiation (see Stull, 1988 for more
in-20
formation on the PBL): Under clear conditions heating of the Earth’s surface by solar radiation induces convective turbulence and therefore a well-mixed PBL builds up after midday ranging up to an altitude of approximately 2 km. During night when the surface cools down, several sub-layers are present in the PBL where the upper most part is defined as the residual layer (RL). The RL contains a mixture of emissions and
back-25
ACPD
15, 9445–9505, 2015Vertical profiling of aerosol hygroscopic
properties
B. Rosati et al.
Title Page
Abstract Introduction
Conclusions References
Tables Figures
◭ ◮
◭ ◮
Back Close
Full Screen / Esc
Printer-friendly Version Interactive Discussion
Discussion
P
a
per
|
Discussion
P
a
per
|
Discussion
P
a
per
|
Discussion
P
a
per
|
can accumulate. Once the sun rises a new mixing layer (ML) is formed which is sep-arated from the other layers through a temperature inversion. Throughout the day this ML evolves until it reaches up to the free troposphere. The dynamics of the sub-layers in the PBL and the properties of the aerosol particles in these layers are still poorly understood.
5
Airborne studies were previously performed to investigate the aerosol chemical com-position as a function of altitude utilizing an aerosol mass spectrometer (AMS), showing that chemical composition varies with height (Morgan et al., 2009, 2010a, b; Pratt and Prather, 2010). This variation should influence the particles’ hygroscopic growth. Mor-gan et al. (2010a) conducted flights over north-western Europe, concentrating however
10
on changes between 0 and 10 km a.g. In general aircraft campaigns commonly stretch over large horizontal and vertical ranges, therefore providing only limited information on the PBL. On the other hand, ground based studies have directly investigated the hy-groscopic properties of particles. However, surface measurements are not always rep-resentative for aerosol properties at elevated altitudes. In addition, hygroscopic
prop-15
erties of particles are studied in reaction chambers under controlled conditions (e.g. Duplissy et al., 2011, or Tritscher et al., 2011).
One way to explore the hygroscopic properties of aerosols is to measure the so called hygroscopic growth factor (GF) defined as the ratio of the particle diameterDwet
at a certain relative humidity (RH) divided by its dry diameterDdry:
20
GF(RH)=Dwet(RH)
Ddry (1)
The most common instrument for ground-based hygroscopicity measurements of at-mospheric aerosol particles is the hygroscopicity tandem differential mobility analyzer
(HTDMA; see e.g. Liu et al., 1978, or McMurry and Stolzenburg, 1989, for details). It explores particles in the sub-saturated RH range and was employed successfully
25
ACPD
15, 9445–9505, 2015Vertical profiling of aerosol hygroscopic
properties
B. Rosati et al.
Title Page
Abstract Introduction
Conclusions References
Tables Figures
◭ ◮
◭ ◮
Back Close
Full Screen / Esc
Printer-friendly Version Interactive Discussion
Discussion
P
a
per
|
Discussion
P
a
per
|
Discussion
P
a
per
|
Discussion
P
a
per
|
measurement cycle which makes it rather unsuited for airborne measurements. Be-sides, its detection range is limited to a maximal dry mobility diameter of approximately 250 nm.
HTDMA and chemical composition hygroscopicity closures were performed at vari-ous sites including urban (see e.g. Kamilli et al., 2014) but also rural regions (see e.g.
5
Wu et al., 2013). Altitude dependent hygroscopic properties were investigated by em-ploying HTDMAs at elevated mountain sites, like the Jungfraujoch (e.g. Kammermann et al., 2010) or Puy de Dôme (e.g. Holmgren et al., 2014), however these measure-ments may be influenced by surface emissions and cannot provide a detailed analysis of particles at different elevations.
10
To our knowledge, only few campaigns report airborne hygroscopicity results due to the lack of available instruments suited for this kind of measurements. The first in-strument built for this special task is the differential aerosol sizing and hygroscopicity
spectrometer probe (DASH-SP; Sorooshian et al., 2008). It is constructed using a com-bination of differential mobility analysis (DMA) and optical particle spectrometry (OPS)
15
and has successfully been applied for airborne GF measurements at sub-saturated RH. This instrument focuses on small sizes in the range of 150–225 nm dry diameters. Results are reported for aircraft campaigns in Hersey et al. (2009) and Hersey et al. (2013). In these studies an attempt was made to reconcile simultaneously measured chemical composition using an AMS and GF results. Hersey et al. (2009, 2013)
fo-20
cused their studies on the free troposphere in the marine atmosphere offthe coast of
California.
All measurement techniques mentioned so far to study hygroscopicity focus on par-ticles smaller than ∼300 nm which implies that species that are more abundant at
larger sizes (e.g. sea salt, mineral dust) cannot be fully investigated. This may induce
25
ACPD
15, 9445–9505, 2015Vertical profiling of aerosol hygroscopic
properties
B. Rosati et al.
Title Page
Abstract Introduction
Conclusions References
Tables Figures
◭ ◮
◭ ◮
Back Close
Full Screen / Esc
Printer-friendly Version Interactive Discussion
Discussion
P
a
per
|
Discussion
P
a
per
|
Discussion
P
a
per
|
Discussion
P
a
per
|
enhancement factors (based on polydisperse aerosol particles) and Mie theory. The comparison revealed that indeed in the presence of sea salt the HTDMA results were not representative for the atmospheric particles, finding too small GF values. Based on these findings we concluded that studies of hygroscopic properties of larger sizes are needed in order to get a more complete picture of the ambient aerosol particles.
5
Hence, we developed the white-light humidified optical particle spectrometer (WHOPS; Rosati et al., 2015) to perform vertical profiles of the particles’ hygroscopic properties of optically more relevant sizes (Ddry=300, 500 nm).
Within the Pan-European Gas–AeroSOl-climate interaction Study (PEGASOS) air-masses over Europe were explored in order to understand feedbacks between
atmo-10
spheric chemistry and a changing climate. A Zeppelin NT (”New Technology”) was cho-sen as measurement platform to specifically probe changes in different layers present
in the evolving convective PBL. The WHOPS, together with an aethalometer and an AMS were mounted in the Zeppelin NT airship to investigate GFs and chemical compo-sition. In the current study, data from vertical profiles measured above central (Cabauw,
15
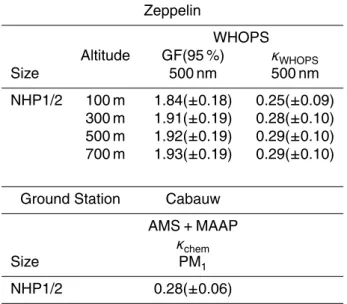
Netherlands) and southern Europe (Po Valley, Italy) are presented (Fig. 1 shows the campaign locations). Flight data is further compared to results from ground measure-ments to get a complete picture of the dynamics and altitude dependent aerosol prop-erties. Additionally, the hygroscopic mixing state and the effective index of refraction of
the particles are explored.
20
2 Experimental
2.1 The Zeppelin NT airship
The Zeppelin NT airship, which served as a platform for the airborne measurements, flew with an average speed of 50 km h−1a.g. and reached altitudes between 80 and ap-proximately 1000 m a.g., depending on the pay load and ambient temperature.
There-25
ACPD
15, 9445–9505, 2015Vertical profiling of aerosol hygroscopic
properties
B. Rosati et al.
Title Page
Abstract Introduction
Conclusions References
Tables Figures
◭ ◮
◭ ◮
Back Close
Full Screen / Esc
Printer-friendly Version Interactive Discussion
Discussion
P
a
per
|
Discussion
P
a
per
|
Discussion
P
a
per
|
Discussion
P
a
per
|
could be obtained. Additionally, the Zeppelin characteristics allowed for a distinct focus on the evolution of the mixed layer forming at low altitudes in the first hours of sunlight. For flight safety reasons, the Zeppelin could only be deployed on days with low wind speeds, low cloud coverage or clear sky.
The Zeppelin NT airship could be equipped with different instrumental layouts for
5
focusing on certain research questions. For this study the so called secondary organic aerosol (SOA) layout was utilized. This layout focuses on the measurement of aerosol properties like aerosol hygroscopicity, size distribution, particle number concentration, chemical composition and volatile organic compounds (VOC). The specific instruments used to measure these properties are described in the following subsections. In
addi-10
tion, nitrogen oxides (NOx), ozone (O3), carbon monoxide (CO), radiative flux, hydroxy as well as peroxy radicals (OH, HO2) were monitored continuously on board of the
air-ship. Each instrument had a separate inlet system and a separate sampling position.
2.2 Flight and ground based measurement locations
2.2.1 Po Valley site 15
The Italy campaign, within the PEGASOS project, was located in the Po Valley, a region known for its remarkably high air pollution levels, compared to other places in Europe (see e.g. Putaud et al., 2010). The Po Valley hosts several industrial, urban and agri-cultural areas allowing for detailed anthropogenic pollution studies, however also long-range transport and aged aerosol from other sites can be investigated. The Zeppelin
20
NT airship was stationed at Ozzano Airport (located at 44◦28′N, 11◦32′E, ∼30 km
southeast of Bologna) and performed flights during June and July 2012 in the greater Po Valley region. The vertical profiles were focused above the San Pietro Capofiume (SPC) ground station (located at 44◦39′N, 11◦38′E), a rural background site which lies approximately 40 km north-east of Bologna. Additionally, data from Monte Cimone
25
ACPD
15, 9445–9505, 2015Vertical profiling of aerosol hygroscopic
properties
B. Rosati et al.
Title Page
Abstract Introduction
Conclusions References
Tables Figures
◭ ◮
◭ ◮
Back Close
Full Screen / Esc
Printer-friendly Version Interactive Discussion
Discussion
P
a
per
|
Discussion
P
a
per
|
Discussion
P
a
per
|
Discussion
P
a
per
|
results measured at an elevated site. Throughout the PEGASOS campaign the SPC and MTC station were equipped with a set of instruments equivalent to those on the Zeppelin NT airship in order to compare flight and ground level data. In order to get estimates of the mixing layer height a Jenoptik CHM15K “Nimbus” automated Lidar-ceilometer was employed at SPC (e.g., Angelini et al., 2009, Haeffelin et al., 2012 and
5
Di Giuseppe et al., 2012).
2.2.2 Netherlands site
The campaign in the Netherlands was located in the South Holland and Utrecht region. This region is representative for north-west Europe and is influenced by continental and maritime airmasses, depending on the wind direction. The Zeppelin NT airship
10
was stationed at Rotterdam – the Hague Airport and conducted several flights in May 2012. The vertical profiles were performed near the Cabauw Experimental Site for At-mospheric Research (CESAR, located at 51◦97′N, 4◦93′E). The CESAR station hosts a number of instruments to characterize radiative properties, climate monitoring and atmospheric processes (www.cesar-observatory.nl). During the PEGASOS campaign
15
an aerosol mass spectrometer was added to the permanently installed aerosol mea-surements. Also at this station a ceilometer system (Vaisala LD40) was utilized to get an estimated mixing layer height (Haij et al., 2007).
2.3 Instrumentation for aerosol measurements
2.3.1 Hygroscopic and optical aerosol properties 20
On the Zeppelin the hygroscopic and optical properties were measured using the white-light humidified optical particle spectrometer (WHOPS). The WHOPS and associated calibration and data analysis procedures are described in detail in Rosati et al. (2015). Briefly, particles reach the WHOPS and are dried in a diffusion drier and then size
selected in a differential mobility analyzer (DMA). In the next step these particles are
ACPD
15, 9445–9505, 2015Vertical profiling of aerosol hygroscopic
properties
B. Rosati et al.
Title Page
Abstract Introduction
Conclusions References
Tables Figures
◭ ◮
◭ ◮
Back Close
Full Screen / Esc
Printer-friendly Version Interactive Discussion
Discussion
P
a
per
|
Discussion
P
a
per
|
Discussion
P
a
per
|
Discussion
P
a
per
|
either guided directly to a WELAS 2300 optical particle spectrometer (WELAS; Palas GmbH, Karlsruhe, Germany) for a measurement of the particle size distribution (∼300–
10 000 nm) or humidified in-between. Hygroscopicity measurements are typically per-formed at RH=95 %, where the uncertainty in the humidity measurement is assumed
to be ±2 %. Since the RH to which particles were exposed to varied only between
5
∼94–96 % during both flight days, no further RH corrections were applied to the
re-sults. By measuring at both conditions an optically measured size distribution for the size-selected particles can be recorded in their dry and humidified state.
To be able to link the measured partial scattering cross sections (σ; from now on referred to as simply scattering cross section) of the WELAS to specific geometric
10
diameters several factors have to be known: the index of refraction (m) as well as the optical setup of the instrument, the spectrum of the light source and sensitivity of the detector. This specific optical instrument was chosen because it uses a white-light source (OSRAM XBO-75 Xenon short arc lamp) which minimizes Mie oscillations for the light scattering which in turn allows for mostly unambiguous attribution of particle
15
diameter to measured scattering cross section. Once a specific dry mobility diameter is selected, the optically measuredσcan be converted to optical diameters (D) using aσ
-D-mtable for a series of different indices of refraction calculated with the Mie code (Mie,
1908; Bohren and Huffman, 2007). The index of refraction where the optical diameter
of the dry particles coincides with the selected mobility diameter is then defined as the
20
effective index of refraction (m) of the dry particles. The term “effective” refers to the fact
that only the real part can be derived and that particles are assumed to be spherical for all calculations. During the measurement campaigns the instrument was periodically checked and calibrated with well defined aerosols with known optical properties and hygroscopicity, e.g. ammonium sulfate particles.
25
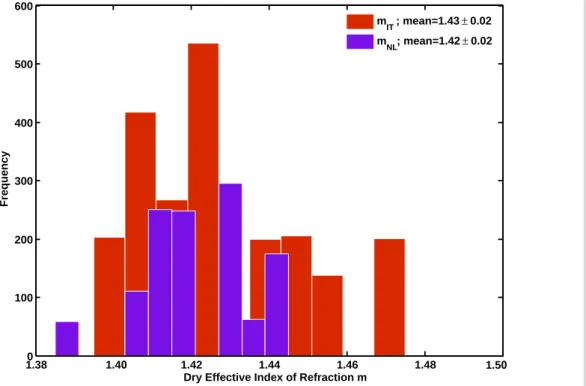
Figure 2 illustrates the temporal variability of the observed effective index of
ACPD
15, 9445–9505, 2015Vertical profiling of aerosol hygroscopic
properties
B. Rosati et al.
Title Page
Abstract Introduction
Conclusions References
Tables Figures
◭ ◮
◭ ◮
Back Close
Full Screen / Esc
Printer-friendly Version Interactive Discussion
Discussion
P
a
per
|
Discussion
P
a
per
|
Discussion
P
a
per
|
Discussion
P
a
per
|
in the Netherlandsmdry=1.42±0.02 were found. However, an absolute uncertainty of ±0.04 has to be attributed to all index of refraction retrievals (see Rosati et al., 2015).
This range compares well to former laboratory studies for SOA from biogenic sources which present values between 1.44–1.45 (Kim and Paulson, 2013; Wex et al., 2009). Guyon et al. (2003) performed ambient aerosol measurements in the Amazon
back-5
ground atmosphere and found also similar values of 1.42 (atλ=545 nm) for airmasses
dominated by organics. In contrast airmasses with predominant anthropogenic pollu-tion would reach higher indices of refracpollu-tion of approximately 1.50–1.55 (Ferrero et al., 2014; Yamasoe et al., 1998). The low indices of refraction found in this study from the WHOPS results fit well to the strong contribution of organics to the total aerosol mass
10
concentration measured by the AMS as will be discussed in more detail later.
The SPC and MTC sites were equipped with hygroscopicity tandem differential
mo-bility analyzers (HTDMA; see e.g. Swietlicki et al., 2008) where the hygroscopic prop-erties of particles with dry diameters between 35 and 230 nm were measured. The setup comprises two DMAs connected in series combined with a condensation particle
15
counter (CPC). First a monodisperse aerosol is selected in the first DMA, then exposed to elevated relative humidity (typically 90 %) and the resulting size distribution is then measured using a DMA coupled to a CPC providing a GF distribution. The inversion of the HTDMA results was done with the algorithm proposed by Gysel et al. (2009). For a direct comparison to the WHOPS measurements the HTDMA GF-probability
den-20
sity functions (GF-PDF) were recalculated for RH=95 % using Eq. (5) in Gysel et al.
(2009). Note that the dry sizes selected by the WHOPS are larger compared to those selected by the HTDMAs, which focus on smaller particles.
2.3.2 Aerosol chemical composition
A high resolution time-of-flight aerosol mass spectrometer (HR-ToF-AMS; DeCarlo
25
ACPD
15, 9445–9505, 2015Vertical profiling of aerosol hygroscopic
properties
B. Rosati et al.
Title Page
Abstract Introduction
Conclusions References
Tables Figures
◭ ◮
◭ ◮
Back Close
Full Screen / Esc
Printer-friendly Version Interactive Discussion
Discussion
P
a
per
|
Discussion
P
a
per
|
Discussion
P
a
per
|
Discussion
P
a
per
|
which focuses particles of sizes between 100 and 700 nm into a narrow beam. The particle beam is impinging on a hot surface (600◦C), where the non-refractory com-ponents flash vaporize. The resulting vapors are ionized by electron impact ionization and measured with a time-of-flight mass spectrometer. The high mass spectral reso-lution of the employed mass spectrometer allows for identification and quantification
5
of peaks corresponding to classes of chemical species (e.g. nitrates, sulphates, chlo-ride, ammonia and organics). Where mass resolution is not sufficient or more than one
chemical species fragments to the same ion in the ionization process, known relation-ships between peaks at different mass to charge ratios are used to improve
quantifi-cation (fragmentation table, Allan et al., 2004). Two operational modes of the ToF-MS
10
(V- and W-Mode) were used during the flights. Specifications of the adaptation of the HR-ToF-AMS for the Zeppelin requirements can be found in Rubach (2013). A collec-tion efficiency (CE) of 1 was applied to the AMS measurements, based on a
compari-son between mass concentrations derived from particle size distributions measured by scanning mobility particle sizers (SMPS; TSI Inc., DMA Model 3081 and water – CPC
15
Model 3786) and WELAS, and the results of AMS and aethalometer measurements on the Zeppelin. Because a CE of 1 is higher than observed in other field studies and we cannot explain the differences, we must attribute an uncertainty of ∼50 % for the
Zeppelin AMS mass concentrations. The same procedure was applied to the ground measurements at SPC yielding the same conclusion that a CE of 1 has to be used.
20
In Cabauw the CE was corrected using the algorithm proposed by Middlebrook et al. (2012). The mass fractions of the compounds are independent of this uncertainty.
At the ground stations, both in Italy and the Netherlands, equivalent black carbon (eBC) mass concentrations were measured with a multi-angle absorption photometer (MAAP Thermo Scientific Model 5012; Petzold et al., 2005) with a resolution of five
min-25
ACPD
15, 9445–9505, 2015Vertical profiling of aerosol hygroscopic
properties
B. Rosati et al.
Title Page
Abstract Introduction
Conclusions References
Tables Figures
◭ ◮
◭ ◮
Back Close
Full Screen / Esc
Printer-friendly Version Interactive Discussion
Discussion
P
a
per
|
Discussion
P
a
per
|
Discussion
P
a
per
|
Discussion
P
a
per
|
the eBC mass concentrations. Results at a wavelength of 880 nm were used. Dur-ing the flights a maximal attenuation of 70 % and a 4 L min−1 flow were chosen. The data was used as retrieved by the manufacturers’ firmware using an apparent MAC of 16.6 m2g−1at a wavelength of 880 nm, which, however, contains already a correc-tion for the multiple scattering in the filter matrix. In order to get comparable eBC
val-5
ues from MAAP and aethalometer, both instruments should use the same MAC value. A comparison to the MAAP shows that the aethalometer multiple scattering correction factorC (Weingartner et al., 2003) is 3.48 (assuming to be wavelength independent). This value fits relatively well to previous results found at the rural background site of Cabauw of 4.09 by Collaud Coen et al. (2010). As the AMS roughly measures
parti-10
cles smaller than 1 µm and most of eBC is assumed to be present in the size range below 1 µm we refer to the chemical composition as of PM1(particulate mass with an
aerodynamic diameter smaller than 1 µm) in the following.
3 κ-Köhler theory
In order to link hygroscopicity measurements made at different RH using different
in-15
struments, it is common to use the semi-empiricalκ-Köhler theory introduced by Pet-ters and Kreidenweis (2007):
RHeq(Ddry, GF,κ)=a
w(GF,κ)·Sk(GF,Ddry)=
GF3−1
GF3−(1−κ)
·exp 4
σs/aMw
RT ρwDdryGF
!
(2)
Köhler theory relates the equilibrium RH (RHeq) over a solution droplet to the product
of the water activity aw representing the Raoult term, and factor Sk representing the
20
Kelvin term. Ddry describes the dry diameter, GF the growth factor (see Eq. 1), σs/a
is the surface tension of the solution/air interface, Mw the molecular mass of water,
R the ideal gas constant, T the absolute temperature and ρw the density of water. κ
is the semi-empirical hygroscopicity parameter introduced by Petters and Kreidenweis (2007), which captures the composition dependence of the Raoult term.
ACPD
15, 9445–9505, 2015Vertical profiling of aerosol hygroscopic
properties
B. Rosati et al.
Title Page
Abstract Introduction
Conclusions References
Tables Figures
◭ ◮
◭ ◮
Back Close
Full Screen / Esc
Printer-friendly Version Interactive Discussion
Discussion
P
a
per
|
Discussion
P
a
per
|
Discussion
P
a
per
|
Discussion
P
a
per
|
To deriveκ values from GF measurements at specific RHs, the relation betweenaw
and GF as described by Petters and Kreidenweis (2007) is used:
κmeas=(GF(RH) 3
−1)·(1−aw)
aw (3)
The subscript “meas” refers to the fact that this κ value is based on the measured GF. The water activity can be inferred from the RH and equilibrium droplet diameter
5
(Dwet):
aw= RH
exp 4σs/aMw RT ρwDwet
(4)
In our calculations the surface tension of water is assumed. For a composition-hygroscopicity closure, the κ values derived from the GF measurements (WHOPS) as described above are compared with theκvalues derived from the chemical
compo-10
sition measurements (AMS and aethalometer). Theκ values of a mixed particle, κmix, can be estimated from the pure component behavior using the Zdanovskii, Stokes and Robinson (ZSR; Stokes and Robinson, 1966) mixing rule. According to the ZSR mix-ing rule, κmix is simply the volume fraction weighted mean of the κ values, κi, of all components in pure form (Petters and Kreidenweis, 2007):
15
κmix=X
i
ǫiκi (5)
Whereǫi is the volume fraction of componenti in the mixed particle.
The mass concentrations of nitrate, sulfate, ammonia, organics and chloride ions as measured by the AMS were converted to neutral salts in order to apply Eq. (5) to calculate hygroscopic properties of the aerosol particles. To do so the ion paring
mech-20
ACPD
15, 9445–9505, 2015Vertical profiling of aerosol hygroscopic
properties
B. Rosati et al.
Title Page
Abstract Introduction
Conclusions References
Tables Figures
◭ ◮
◭ ◮
Back Close
Full Screen / Esc
Printer-friendly Version Interactive Discussion
Discussion
P
a
per
|
Discussion
P
a
per
|
Discussion
P
a
per
|
Discussion
P
a
per
|
densities as well asκ values for the corresponding pure compounds for the prediction of the hygroscopicity parameter are summarized in Table 1. For the inorganic salts, the bulk densities were taken from literature and theκ values were derived from AD-DEM predictions (Topping et al., 2005) which is a detailed model capable of calculating growth factors of inorganic aerosols with high accuracy. The finalκ values were
cal-5
culated for 95 % RH and a dry diameter of 500 nm. For the organics aκ value of 0.11 was used. This was inferred from the median O : C ratio of 0.5 measured during the flights and Fig. 7 in Duplissy et al. (2011), assuming that the organics measured in our studies behaved like organics in previous measurement campaigns and like secondary organic aerosol derived from the oxidation ofα-pinene. To determine the organic’s
den-10
sity a parametrization based on O:C and H:C ratios introduced by Kuwata et al. (2012) was used. The mean organics’ density and SD was found to be 1233±35 kg m−3. eBC
was assumed to haveκ=0 and a bulk density of 2000 kg m−3.
4 Results and discussion
4.1 Po Valley campaign 15
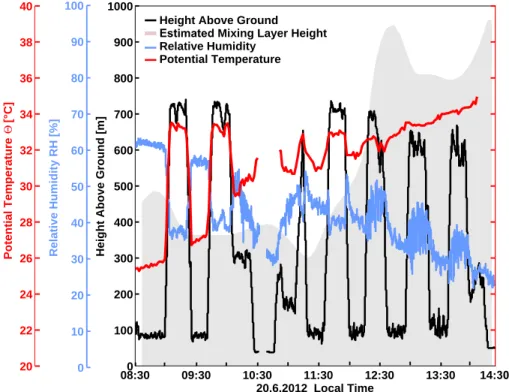
Here we present hygroscopicity results recorded with the WHOPS aboard the Zeppelin NT airship. The vertical flight pattern performed on the 20 June 2012 is shown in Fig. 3. During this day vertical profiles were measured near the SPC site from ∼08:30 LT
until approximately 14:00 LT with a refuel break in-between (∼10:00–11:00 LT). Two
different height levels were covered at approximately 100 and 700 m a.g. On this day
20
westerly winds and wind speeds around 2–3 m s−1prevailed. Therefore the airmasses originated from the Po Valley plain and due to the low wind speeds the influence of local pollution was highest. Figure 3 depicts the potential temperature (Θ) and RH
profiles during the flight together with the estimated mixing layer height provided by Ceilometer-Lidar data. The RH ranges from 30 % to a maximum of 60 % and shows
25
ACPD
15, 9445–9505, 2015Vertical profiling of aerosol hygroscopic
properties
B. Rosati et al.
Title Page
Abstract Introduction
Conclusions References
Tables Figures
◭ ◮
◭ ◮
Back Close
Full Screen / Esc
Printer-friendly Version Interactive Discussion
Discussion
P
a
per
|
Discussion
P
a
per
|
Discussion
P
a
per
|
Discussion
P
a
per
|
near the ground, while later in the day the opposite trend is visible. The evolutions of
Θand RH elucidate a clear layering during the beginning of the flight (seen as abrupt
change in Θ between 100 and 700 m a.g.), which slowly disappears towards the last
profiles. This development is also consistent with the evolution of the estimated mixing layer height, which indicates that during the morning hours (∼08:30–10:00 LT) we were
5
able to ascend into the RL and investigate the new ML at the lower altitudes. During the second half of the flight (∼12:00–14:00 LT) the fully developed ML was probed at
both altitudes.
4.1.1 Hygroscopic GF measured with the WHOPS
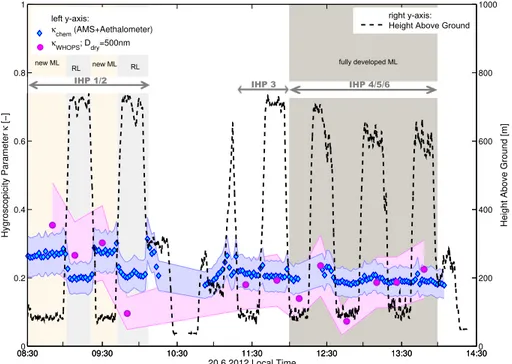
Figure 4 gives an overview of the flight day complemented by the time series of the
10
hygroscopicity parameters deduced from the WHOPS measurements (colored in vi-olet). The shaded area describes the accuracy of the WHOPS of 10 % (see Rosati et al., 2015 for more details). Variations of the particles’ hygroscopic properties can be observed as a function of altitude and time: The first two height profiles (∼08:30–
10:00 LT; from now on referred to as IHP1/2), depict higher hygroscopicity values close
15
to the ground (∼100 m a.g.) compared to those at elevated altitudes of ∼700 m a.g.
This altitude dependence implies different layers with distinct aerosol properties,
con-sistent with the vertical layering of the PBL suggested byΘand the estimated mixing
layer height illustrated in Fig. 3. Table 2 contains the mean GF(95 %) andκ values for both layers, averaged over both profiles. In the new ML the mean GF(95 %) is 1.88
20
which is equivalent to κ=0.34. These values considerably exceed the results in the
RL (GF(95 %)=1.61 and κ=0.19). After 11:00 LT a second set of profiles was
per-formed. To study particles in the fully developed ML the results from IHP4/5/6 (∼12:00–
14:00 LT) are considered, while IHP3 is excluded since the ML was not fully developed before noon (see Fig. 4). In the fully developed ML, hygroscopicity results show less
25
variability with no clear pattern for results at different altitudes. We observed one event
ACPD
15, 9445–9505, 2015Vertical profiling of aerosol hygroscopic
properties
B. Rosati et al.
Title Page
Abstract Introduction
Conclusions References
Tables Figures
◭ ◮
◭ ◮
Back Close
Full Screen / Esc
Printer-friendly Version Interactive Discussion
Discussion
P
a
per
|
Discussion
P
a
per
|
Discussion
P
a
per
|
Discussion
P
a
per
|
a much lower hygroscopicity compared to particles measured before and after. With ex-ception of this instance, the particle hygroscopic properties were homogeneous across all altitudes in the afternoon. This is in concordance with the findings fromΘand the
es-timated mixing layer height displayed in Fig. 3 which indicate the presence of only one layer below ∼700 m a.g. Once the fully developed ML is present vertical differences
5
in aerosol properties are expected to disappear. Only altitude dependent changes in temperature and RH could potentially lead to alterations of the particles e.g. through phase partitioning effects. Mean GF andκvalues at different altitudes in the fully
devel-oped ML, presented in Table 2, show less spread with values of 0.14 and 0.21 at 100 and 700 m a.g., respectively. The discrepancy can be attributed to the outlier described
10
above which causes a decreased mean value at an altitude of ∼100 m a.g., however
the results still agree within the measurement accuracy. In addition, the hygroscopic properties in the fully developed ML appear very similar to those measured in the RL.
4.1.2 Mixing state inferred from WHOPS measurements
The GF-PDFs of the humidified particles can provide information on the mixing state
15
of particles with respect to aerosol components of different hygroscopicity. Commonly
the mixing state of aerosol particles is classified as follows: if all particles of a cer-tain size have almost the same chemical composition, they are described as internally mixed, whereas if particles of equal size have different chemical composition, they are
referred to as externally mixed. Depending on the mixture the hygroscopic behavior will
20
change: internally mixed aerosols will grow uniformly with increasing RH, while exter-nal mixtures of substances with differing hygroscopic properties will result in multimodal
and/or broadened GF-PDFs.
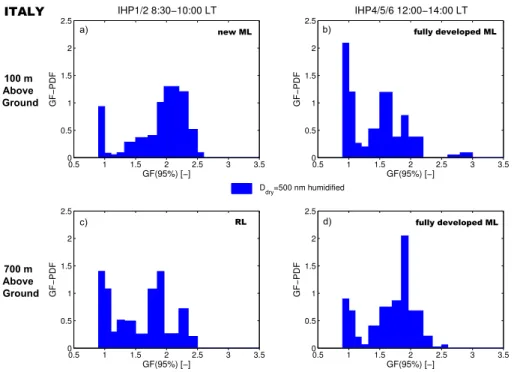
In order to further explore differences in hygroscopic properties between the diff
er-ent layers, Fig. 5 illustrates the GF-PDFs averaged for the same layers, i.e. the same
25
times and altitudes, as the mean values shown in Table 2. In general broad GF(95 %) distributions with values between 0.9 and∼2.5 were observed independently of flight
ACPD
15, 9445–9505, 2015Vertical profiling of aerosol hygroscopic
properties
B. Rosati et al.
Title Page
Abstract Introduction
Conclusions References
Tables Figures
◭ ◮
◭ ◮
Back Close
Full Screen / Esc
Printer-friendly Version Interactive Discussion
Discussion
P
a
per
|
Discussion
P
a
per
|
Discussion
P
a
per
|
Discussion
P
a
per
|
observed for the PDFs during IHP1/2 (Fig. 5a and c). The fraction of more hygroscopic particles (GF>1.5) is more pronounced in the new ML, while the fraction of particles with GF<1.1 is higher in the RL. This explains the higher mean particle hygroscopicity in the new ML compared to the RL.
In the early afternoon, the GF-PDFs measured during IHP4/5/6 do not exhibit any
5
clear vertical differences (Fig. 5b and d), supporting the above finding of being within
the fully developed ML at both altitudes. Subtle differences are a slightly higher
frac-tion of particles with GF<1.1 and a slightly lower fraction of particles with GF>1.5 at 100 m a.g. compared to 700 m a.g. This difference is for the most part caused by the
outlier at∼12:45 LT, as will be shown below with Fig. 6. When comparing the results
10
at fixed elevation at different times (Fig. 5a vs. b and c vs. d as well as Fig. 4) distinct
changes were only observed at the lower altitude in the transition from the new ML to the fully developed ML, while little changed at the higher altitude in the transition from the RL to the fully developed ML. This indicates that local aerosol sources have a stronger influence in the shallow new ML, while the fully developed ML is dominated
15
by background aerosol.
Figure 5 illustrates qualitative differences for distributions which were averaged over
a certain time period. Even though the GF-PDFs imply externally mixed aerosol par-ticles, this is not necessarily the case as the average of an internally mixed aerosol with variable composition could potentially yield the same result. Due to low counting
20
statistics highly time resolved GF-PDFs are not available. For this reason we divide the particles in different hygroscopic fractions in order to further investigate the time
dependent mixing state characteristics. Measurements forDdry=500 nm are classified
in three hygroscopicity categories: GF<1.1 (“non-hygroscopic”), 1.1<GF<1.5 (“mod-erately hygroscopic”) and GF>1.5 (“most hygroscopic”) which correspond to ranges
25
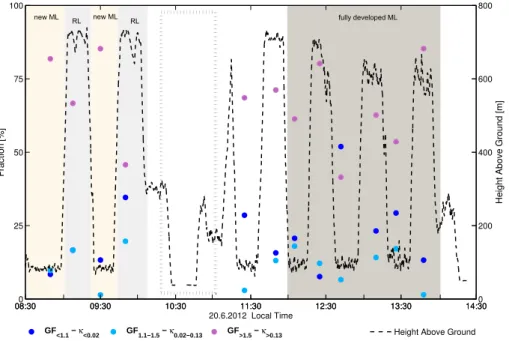
ofκ <0.02, 0.02< κ <0.13 andκ >0.13, respectively. Figure 6 presents the temporal
ACPD
15, 9445–9505, 2015Vertical profiling of aerosol hygroscopic
properties
B. Rosati et al.
Title Page
Abstract Introduction
Conclusions References
Tables Figures
◭ ◮
◭ ◮
Back Close
Full Screen / Esc
Printer-friendly Version Interactive Discussion
Discussion
P
a
per
|
Discussion
P
a
per
|
Discussion
P
a
per
|
Discussion
P
a
per
|
the flight. The moderately hygroscopic particles are almost always the smallest fraction, constantly accounting for less than 20 % of all particles (light blue dots in Fig. 6).The most hygroscopic particles are almost always the largest fraction, accounting for∼45–
85 % of all particles, while the non-hygroscopic particles contribute∼9–34 %, whereby
these values do not include the outlier. It is important to note that part of the temporal
5
variability of the number fractions shown in Fig. 6 is caused by limited counting statis-tics rather than true variability of aerosol properties. However, the outlier in the fully developed ML at 12:45 with a non-hygroscopic fraction as high as 50 %, reflects truly different aerosol properties rather than just statistical noise.
Previous mixing state studies, based on hygroscopic growth behavior measured with
10
HTDMAs, found similar substantial non-hygroscopic fractions in airmasses influenced by urban areas, where externally mixed black carbon (BC) was revealed as the major contributor (see e.g. Juranyi et al., 2013; Laborde et al., 2013; Lance et al., 2013). The number size distributions of freshly emitted BC particles typically peak in the range around∼100 nm (Rose et al., 2006). Therefore, externally mixed BC is less likely to
15
give a significant contribution to the total number of particles with a diameter of 500 nm, which is probed by the WHOPS, while substantial contributions from externally mixed BC can be expected in the lower accumulation mode size range probed by e.g. HTD-MAs, when being close to sources. Besides, externally mixed BC particles are known to have a low effective density due to their fractal-like morphology (Weingartner et al.,
20
1997), and the index of refraction of BC differs substantially from that of organic and
inorganic aerosol components (Bond and Bergstrom, 2006). These two effects, lead to
a systematic bias in the GF inferred from WHOPS measurements of externally mixed BC particles. Sensitivity analysis showed that it is very unlikely that non-hygroscopic externally mixed BC shows up at GF∼1.0 in the WHOPS, despite the fact that the two
25
effects counteract each other to some extent. BC-containing particles may potentially
ACPD
15, 9445–9505, 2015Vertical profiling of aerosol hygroscopic
properties
B. Rosati et al.
Title Page
Abstract Introduction
Conclusions References
Tables Figures
◭ ◮
◭ ◮
Back Close
Full Screen / Esc
Printer-friendly Version Interactive Discussion
Discussion
P
a
per
|
Discussion
P
a
per
|
Discussion
P
a
per
|
Discussion
P
a
per
|
the Po Valley by Decesari et al. (2014). The acquisition of coatings also increases the effective density of BC-containing particles and makes their effective index of refraction
more similar to that of BC-free particles (Zhang et al., 2008), however, the hygroscop-icity increases as well (e.g. Tritscher et al., 2011; Laborde et al., 2013). Thus, internally mixed BC-containing particles may give a significant contribution to particles with
di-5
ameters of∼500 nm, however, they are expected to be moderately hygroscopic and
they should be detected as such by the WHOPS. Based on the above arguments, we consider it unlikely that the non-hygroscopic particles measured by the WHOPS are for the most part BC-containing particles. Besides, non-BC products of biomass burning, like tar balls (Pósfai et al., 2004; Alexander et al., 2008) are also known to exist up
10
to diameters of∼500 nm. Their optical properties differ significantly from those of BC
leading to scattering cross sections similar to those for particles withm=1.43 (eff
ec-tive index of refraction measured in this study). Therefore, also these tar balls could describe a fraction of the non-hygroscopic particles.
Mineral dust is another substance known to be non-hygroscopic (e.g. Herich et al.,
15
2008, 2009), though it can potentially become more hygroscopic through atmospheric aging processes such as e.g. heterogeneous chemical reactions at the particle surface (Vlasenko et al., 2006). Fresh Saharan dust sampled at Cape-Verde was related to the non-hygroscopic particle mode (Schladitz et al., 2011). Aged Saharan dust, observed at the high-alpine site Jungfraujoch after long-range transport, was still reported to
20
be non-hygroscopic using HTDMA and humidified nephelometry techniques (Sjogren et al., 2008; Fierz-Schmidhauser et al., 2010). The number size distribution of min-eral dust particles is known to extend down to sub-micrometer sizes (e.g. Mahowald et al., 2014) and therefore into the range of the WHOPS measurements. The hygro-scopic growth factor of externally mixed dust particles could hypothetically explain our
25
non-hygroscopic fraction. Dust particles have an index of refraction that is approxi-mately 1.53−0.08i (Wagner et al., 2012), thus leading to similar scattering cross
sec-tions atDdry=500 nm as for the effective index of refraction determined for the whole
ACPD
15, 9445–9505, 2015Vertical profiling of aerosol hygroscopic
properties
B. Rosati et al.
Title Page
Abstract Introduction
Conclusions References
Tables Figures
◭ ◮
◭ ◮
Back Close
Full Screen / Esc
Printer-friendly Version Interactive Discussion
Discussion
P
a
per
|
Discussion
P
a
per
|
Discussion
P
a
per
|
Discussion
P
a
per
|
to the lowest atmospheric layers near the SPC site can be expected for the day of the Zeppelin flight reported here according to the HYSPLIT model for Saharan Dust Intrusions (http://www.ciecem.uhu.es/hysplit/; not presented here). Thus, mineral dust is a likely explanation for the non-hygroscopic particles (atDdry=500 nm) detected by
the WHOPS in the Po Valley.
5
A last potential candidate for non-hygroscopic particles is biological material, which is non-hygroscopic and exists in the sub-micron size range (e.g. Després et al., 2012). Virus particles, bacteria, fungal spores and plant pollen are commonly ranked among these species. The optical properties vary considerably between different types of
bio-aerosol. Values between 1.397–1.53 for the real part of the index of refraction are
10
reported in the literature (Balaev et al., 2003; Charrière et al., 2006; Limsui et al., 2008). This is close to the effective index of refraction applied in this study for the WHOPS data
analysis, such that non-hygroscopic bioparticles would correctly be measured at a GF of∼1 by the WHOPS.
4.1.3 Hygroscopicity comparison between airborne WHOPS and ground-based 15
HTDMA measurements
The ground stations were equipped with HTDMAs which measured GF-PDFs at RH=90 % in the dry diameter range below 230 nm. Since SPC is located in the valley
only the new ML and later the fully developed ML could be measured, while MTC, sit-uated on a mountain, probes air in the RL in the morning and the fully developed ML
20
later in the day. The fact that the fully developed ML extends to altitudes higher than the MTC site was previously reported by Van Dingenen et al. (2005). Figure 7 provides the WHOPS and HTDMA GF-PDFs measured on the Zeppelin, in SPC and MTC divided into results for the new ML, the RL and the fully developed ML. Note that the WHOPS cannot reliably detect particles with GF<1.5 andDdry=300 nm, as described in Rosati
25
ACPD
15, 9445–9505, 2015Vertical profiling of aerosol hygroscopic
properties
B. Rosati et al.
Title Page
Abstract Introduction
Conclusions References
Tables Figures
◭ ◮
◭ ◮
Back Close
Full Screen / Esc
Printer-friendly Version Interactive Discussion
Discussion
P
a
per
|
Discussion
P
a
per
|
Discussion
P
a
per
|
Discussion
P
a
per
|
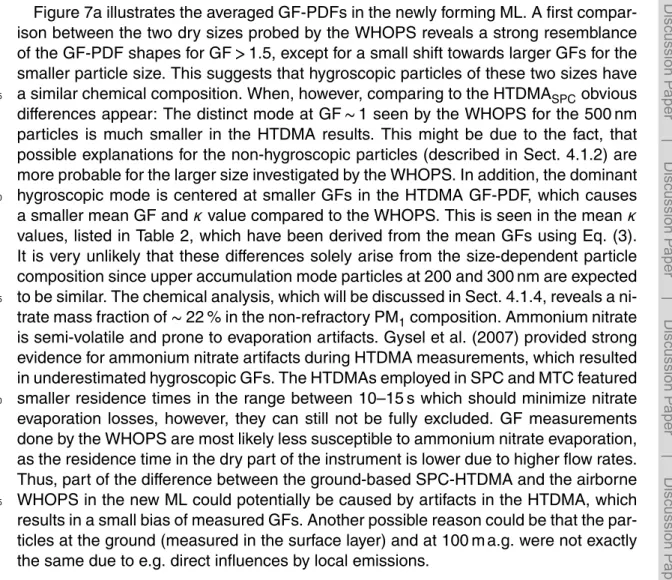
Figure 7a illustrates the averaged GF-PDFs in the newly forming ML. A first compar-ison between the two dry sizes probed by the WHOPS reveals a strong resemblance of the GF-PDF shapes for GF>1.5, except for a small shift towards larger GFs for the smaller particle size. This suggests that hygroscopic particles of these two sizes have a similar chemical composition. When, however, comparing to the HTDMASPCobvious 5
differences appear: The distinct mode at GF∼1 seen by the WHOPS for the 500 nm
particles is much smaller in the HTDMA results. This might be due to the fact, that possible explanations for the non-hygroscopic particles (described in Sect. 4.1.2) are more probable for the larger size investigated by the WHOPS. In addition, the dominant hygroscopic mode is centered at smaller GFs in the HTDMA GF-PDF, which causes
10
a smaller mean GF andκvalue compared to the WHOPS. This is seen in the meanκ
values, listed in Table 2, which have been derived from the mean GFs using Eq. (3). It is very unlikely that these differences solely arise from the size-dependent particle
composition since upper accumulation mode particles at 200 and 300 nm are expected to be similar. The chemical analysis, which will be discussed in Sect. 4.1.4, reveals a
ni-15
trate mass fraction of∼22 % in the non-refractory PM1composition. Ammonium nitrate
is semi-volatile and prone to evaporation artifacts. Gysel et al. (2007) provided strong evidence for ammonium nitrate artifacts during HTDMA measurements, which resulted in underestimated hygroscopic GFs. The HTDMAs employed in SPC and MTC featured smaller residence times in the range between 10–15 s which should minimize nitrate
20
evaporation losses, however, they can still not be fully excluded. GF measurements done by the WHOPS are most likely less susceptible to ammonium nitrate evaporation, as the residence time in the dry part of the instrument is lower due to higher flow rates. Thus, part of the difference between the ground-based SPC-HTDMA and the airborne
WHOPS in the new ML could potentially be caused by artifacts in the HTDMA, which
25
ACPD
15, 9445–9505, 2015Vertical profiling of aerosol hygroscopic
properties
B. Rosati et al.
Title Page
Abstract Introduction
Conclusions References
Tables Figures
◭ ◮
◭ ◮
Back Close
Full Screen / Esc
Printer-friendly Version Interactive Discussion
Discussion
P
a
per
|
Discussion
P
a
per
|
Discussion
P
a
per
|
Discussion
P
a
per
|
Figure 7b depicts the averaged GF-PDFs in the RL. For GF>1.5 the WHOPS results for both sizes agree well, again indicating similar chemical composition of particles with dry diameters of 300 and 500 nm. The GF-PDFs measured by the HTDMA at the MTC site are similar to the results from the airborne WHOPS measurements. Differences
in the fine structure of the GF-PDFs should not be over-interpreted, as they are
influ-5
enced by the data inversion algorithms for both instruments. Larger discrepancies are visible for the non-hygroscopic fraction. The HTDMA at MTC measured the GF-PDF for particles with a diameter of 230 nm, which could be too small to have a substantial fraction of dust or biological particles that are known to be non-hygroscopic and more abundant at larger sizes. Besides, MTC is situated at a much higher elevation than
10
the Zeppelin NT was flying and its location is approximately 100 km southeast of SPC, therefore different airmasses could be present which lead to additional discrepancies.
Figure 7c displays the results for the fully developed ML. There is again little diff
er-ence between the results for the two sizes probed by the WHOPS, as for the other two layers. The fully developed ML was probed by the HTDMA at both sites. The number
15
fraction of non-hygroscopic particles is again smaller compared to the WHOPS, while the dominant hygroscopic mode is similar except for small differences in its position,
which is also reflected in the meanκ values listed in Table 2.
4.1.4 Composition – hygroscopicity closure
The WHOPS measurements indicate distinct differences in hygroscopic particle
prop-20
erties between the probed layers in the PBL. Here we examine which chemical com-ponents cause these differences and whether closure is achieved between measured
particle hygroscopicity and that calculated from chemical composition. Figure 8 depicts the PM1mass fractions of carbonaceous and inorganic aerosol components, as well as the mean PM1mass concentrations for the SPC ground station (Fig. 8a and b) and the 25
ACPD
15, 9445–9505, 2015Vertical profiling of aerosol hygroscopic
properties
B. Rosati et al.
Title Page
Abstract Introduction
Conclusions References
Tables Figures
◭ ◮
◭ ◮
Back Close
Full Screen / Esc
Printer-friendly Version Interactive Discussion
Discussion
P
a
per
|
Discussion
P
a
per
|
Discussion
P
a
per
|
Discussion
P
a
per
|
Figure 8a, c and e illustrate results for the early morning hours. At this time of day, the highest PM1concentrations were measured in new ML with mean values of 22 and
20 µg m−3 at the ground site and ∼100 m a.g., respectively. This is expected as most
emissions from the ground, which accumulated during the night, are trapped in the new ML. The mean PM1concentrations in the RL at ∼700 m a.g., which is decoupled
5
from the emissions at the ground, were substantially lower (15 µg m−3). These vertical gradients in aerosol concentration disappeared and aerosol loadings dropped as the new ML evolved to a fully developed ML in the course of the day, which resulted in stronger dilution and better vertical mixing of fresh emissions from the ground. This is confirmed by the results of the afternoon flights, when consistently 12–13 µg m−3were
10
measured at both flight levels and the ground station (Fig. 8b, d and f).
Overall, organic compounds were with 43 to 62 % by mass the largest fraction of PM1, while the sum of inorganic species contributed between 29 and 48 % (Fig. 8). The
eBC mass fraction remained constantly below 12 % and chloride was always negligible with less than 1 %. During IHP1/2 a clear difference between the mass fractions in
15
the new ML with a high nitrate fraction of 20–22 % (Fig. 8a and c) and the RL with a nitrate contribution of only 5 % (Fig. 8e) were observed. This increased nitrate fraction in the new ML can be explained by the accumulation of nitrate species over night, which are formed in the nocturnal surface layer and are then entrained into the new ML after sunrise. The eBC fraction was slightly higher in the new ML compared to the
20
RL, whereas the organics and sulfate fractions were substantially lower. During the afternoon flights (IHP4/5/6; Fig. 8b, d and f) in the fully developed ML, the differences
in chemical composition between different altitudes disappeared as they did for the
aerosol loading. The mass fractions of all species were comparable at the ground and the two flight altitudes and also very similar to those in the RL probed in the morning.
25
ACPD
15, 9445–9505, 2015Vertical profiling of aerosol hygroscopic
properties
B. Rosati et al.
Title Page
Abstract Introduction
Conclusions References
Tables Figures
◭ ◮
◭ ◮
Back Close
Full Screen / Esc
Printer-friendly Version Interactive Discussion
Discussion
P
a
per
|
Discussion
P
a
per
|
Discussion
P
a
per
|
Discussion
P
a
per
|
stayed constant throughout the day, thus indicating small local influence, again consis-tent with our results. Previous airborne AMS measurements showed high ammonium nitrate concentrations in the Po Valley plume, thus indicating large nitrogen oxide and ammonium sources in the Po Valley region (Crosier et al., 2007).
A quantitative closure study between measured chemical composition and
hygro-5
scopic properties was done with the approach described in Sect. 3. For this purpose, Eq. (5) was used to calculated theκ value corresponding to the measured chemical composition from AMS and aethalometer. Resultingκ values averaged for the different
layers are listed in Table 2. Inorganic species are strongly hygroscopic, while organ-ics and BC are only weakly hygroscopic and non-hygroscopic, respectively (Table 1).
10
Consequently, the hygroscopicity of a mixture increases with increasing inorganic frac-tion. This explains why the highest composition-derivedκ values are obtained for the new ML (44–48 % inorganic mass fraction), both for the ground-based and airborne measurements at 100 m a.g., while those for the RL (35 % inorganic mass fraction) and the fully developed ML (29–30 % inorganic mass fraction) are distinctly lower. The
dif-15
ferences in the inorganic fraction between the different layers are mainly caused by
the variability of the nitrate fraction. Thus, the high nitrate mass fraction in the new ML is responsible for the increased particle hygroscopicity in this layer. Figure 4 (time-resolved data) and Table 2 (mean values for layers) further show that closure between composition-derivedκ values and WHOPS-derivedκ values is achieved within
experi-20
mental uncertainty.
Theκvalues derived from the HTDMA measurement at the SPC site are significantly lower than the corresponding composition-derivedκ values for the measurements in the new ML (Table 2). This disagreement might be caused as the result of ammonium nitrate evaporation artifacts in the HTDMA, as already speculated in Sect. 4.1.3.
Dur-25
ACPD
15, 9445–9505, 2015Vertical profiling of aerosol hygroscopic
properties
B. Rosati et al.
Title Page
Abstract Introduction
Conclusions References
Tables Figures
◭ ◮
◭ ◮
Back Close
Full Screen / Esc
Printer-friendly Version Interactive Discussion
Discussion
P
a
per
|
Discussion
P
a
per
|
Discussion
P
a
per
|
Discussion
P
a
per
|
coating on particles, which both lead to low hygroscopic growth. However, also evapo-ration artifacts could potentially play a role.
4.1.5 Comparison of hygroscopicity results with previous campaigns
The aerosol hygroscopic properties reported in this study were measured on 20 June 2012, a predominately cloudless summer day with low wind speeds. To better
under-5
stand whether this case study is representative of typical conditions in the Po Val-ley in the summer season, a comparison is made with literature data from previous campaigns that covered longer time periods. Meanκ values determined with different
methods and at different sites are shown in Fig. 9. Only measurements taken in the fully
developed ML are included in the averages (for the literature data, the time of day
be-10
tween 12:00 and 17:00 LT is assumed to be representative of the fully developed ML). Vertical gradients of aerosol properties are minimal in the fully developed ML. This en-sures comparability between the measurements taken at different altitudes. Previous
hygroscopicity measurements in the summer season were carried out with HTDMAs at MTC (Van Dingenen et al., 2005), at SPC (Bialek et al., 2014) and Ispra (Adam et al.,
15
2012). Ispra is located at 45◦49′N, 8◦38′E at 209 m a.s.l. approximately 60 km north of
Milan at the north-end of the Po Valley.
All meanκ values shown in Fig. 9 fall into the rather narrow range between 0.18 and 0.28, independent of location, method and dry sizes. These medium-lowκvalues can be explained with organic fractions of 50 % or larger (see e.g. Fig. 8). Additionally, the
20
temporal variability is small, such that the rangeκ=0.11–0.33 includes all data points
within±1 SD of the mean values. This means that aκvalue of∼0.22 is a good
approx-imation for the aerosol hygroscopic properties in the fully developed ML in the Po Valley in summertime. Such approximations can for example be useful, when estimating the cloud condensation nuclei activity at times or sites without concurrent hygroscopicity
25
ACPD
15, 9445–9505, 2015Vertical profiling of aerosol hygroscopic
properties
B. Rosati et al.
Title Page
Abstract Introduction
Conclusions References
Tables Figures
◭ ◮
◭ ◮
Back Close
Full Screen / Esc
Printer-friendly Version Interactive Discussion
Discussion
P
a
per
|
Discussion
P
a
per
|
Discussion
P
a
per
|
Discussion
P
a
per
|
The close agreement between aerosol hygroscopic properties observed in this study with available literature data from previous studies suggests that our case study is indeed representative of the Po Valley summertime aerosol. Combined with the results shown in Figs. 4–7 follows that ground based measurements taken in the afternoon at sites in the valley plain are representative of aerosol properties over the whole vertical
5
extent of the fully developed ML, whereas they may be representative of only a shallow layer at other times of day.
4.2 Netherlands campaign
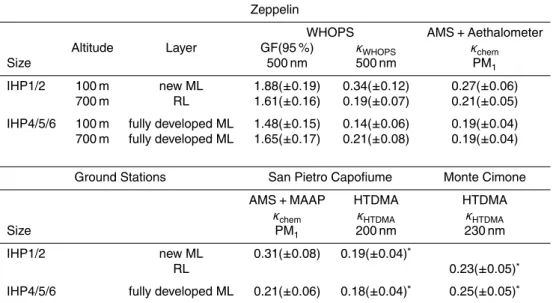
Here we present the findings of a Zeppelin flight on 24 May 2012 near the CESAR ground station in the Netherlands (Fig. 1). We performed a set of height profiles
be-10
tween approximately 11:00 and 14:00 LT, including longer legs at the following for al-titudes:∼100, 300, 500 and 700 m a.g. The first height profile (NHP1) was performed
from∼11:30–12:45 LT and the second height profile (NHP2) from ∼12:45–13:50 LT.
The wind direction was predominately from north-east and the wind speed on average between ∼3 and ∼4.5 m s−1. Therefore, the probed airmasses were most probably
15
originating from the continent and likely with some local/regional influence due to low wind speeds. Figure 10 displays the time series of the flight altitude, estimated mixing layer height, relative humidity and potential temperature (Θ). During the whole flight
relatively high RH dominated (40–80 %). The pattern of Θ reveals a vertical layering
during the first profile, showing a clear difference at∼700 m a.g. compared to the lower
20
altitudes. A similar but less pronounced vertical structure in the potential temperature can also be seen at the beginning of the second profile. A very similar development of the mixing layer height is captured by data calculated from a Ceilometer. This indicates that indeed we managed to fly above the new ML during the first profile at 700 m a.g. However, since the change inΘand the vertical distance to the ML height are rather
25