*Correspondence: T. P. Rojas. School of Pharmaceutical Chemistry, The University of Antioquia. Cll 65 # 53-108 of 157, Medellin, Colombia. E-mail: [email protected]
A
rti
Pharmaceutical Sciences vol. 47, n. 1, jan./mar., 2011
Effect of siliciication on the water sorption
properties of microcrystalline cellulose II
John Rojas Camargo
*, Carlos Andrés Ortiz Garcia
School of Pharmaceutical Sciences, University of Antioquia
The aim of this study was to investigate the water sorption behavior of cellulose II:SiO2 composites and to
determine the inluence of siliciication on this property. These composites were prepared by spray-drying at a cellulose II:SiO2 ratio of 98:2, 95:5, 90:10 and 80:20. The nonlinear models of
Guggenheim-Anderson-de Boer (GAB), Generalized D’Arcy and Watt (GDW) and Hailwood & Horrobin (HH), were used for the characterization and analysis of the isotherms. The infrared and powder X-rays characterization showed no signs of chemical modiication or change in the polymorphic form of cellulose II by SiO2.
The parameters derived from these models indicated that only a 20% level of siliciication was able to hinder the water sorption properties of cellulose. Silicon dioxide was the most hydrophobic material since it had a lower ability to form hydrogen bonds with water than cellulose II. This inding was relected in a delayed compact disintegration time when high levels of siliciication (20%) and compression pressures higher than 120 MPa were used.
Uniterms: Cellulose II. Silicon dioxide. Siliciication. Water sorption isotherms. Disintegration.
O objetivo deste estudo é investigar o comportamento de sorção de água a partir de misturas de celulose II e SiO2 e determinar a inluência da siliciicação nesse processo. Estas misturas foram preparadas por
nebulização (spray-drying) usando misturas de celulose II e SiO2 nas proporções de 98:2, 95:5, 90:10 e
80:20. Os modelos não-lineares de Guggenheim-Anderson-de Boer (GAB), “Generalized” D’Arcy e Watt (GDW) e Hailwood & Horrobin (HH) foram utilizados para caracterização e análise das isotermas. As misturas foram caracterizadas por infravermelho e raio-X e os resultados não mostraram indicativo de modiicação química ou polimórica da celulose II em combinação com SiO2. Os parâmetros derivados
desses modelos indicaram que as propriedades de sorção de água da celulose foram prejudicadas apenas quando empregado um nível de siliciicação de 20%. O dióxido de silício foi o material mais hidrofóbico, provavelmente por possuir uma menor capacidade de formar pontes de hidrogênio com a água quando comparado com a celulose II. Este resultado foi reletido em redução no tempo de desintegração, especialmente quando altos níveis de siliciicação (20%) e força de compressão (acima de 120 Mpa) foram utilizados.
Unitermos: Celulose II. Dióxido de silício. Siliciicação. Isotermas de sorção de água. Desintegração.
INTRODUCTION
The new microcrystalline cellulose II allomorph (UICEL®) was introduced as a new direct compression
excipient (Reus, Kumar, 2002; 2006). It is compatible with other excipients and active ingredients, offers high dilution potential, is a good disintegrant and relatively inexpensive. Recently, co-processing of cellulose II
stora-ge alone or combined with other materials in a dosastora-ge form under different ambient conditions. Studies of the water sorption ability of this composite material allow for comparing and establishing the appropriate storage conditions to maintain its quality requirements.
Equilibrium sorption refers to the equilibrium up-take of water as a function of water activity. Brunauer and collaborators proposed a classiication of isotherms into ive types according to their shape (Brunauer et al., 1938; 1940). Type I is the typical Langmuir isotherm which is applicable to microporous solids. Type II and type III isotherms describe adsorption of gases on macroporous or non porous solids, while type IV and V isotherms are applicable to both mesoporous or microporous solids. It is known that type II isotherms are common in hydrophi-lic polymers such as silk and wool, whereas, less hydro-philic materials such as ethylcellulose present a type III isotherm (Van der wel, Adan, 1999). The goal of this study was to evaluate the role of SiO2 in the water
sorp-tion properties of cellulose II:SiO2 composites by using
different mathematical models such as Guggenheim-Anderson-de Boer (GAB), Hailwood and Horrowin (HH), Darcy and Watt (GDW) models. The non-linear curve itting and the resulting parameters were obtained using the Statgraphic software vs. 5 (Warrenton, VA). Currently, no studies investigating the effect of SiO2 on
the water sorption behavior of cellulose II are available.
MATERIALS AND METHODS
Materials
Cotton linter (grade # R270) was obtained from Southern Cellulose Products, Inc., Chattanooga, TN). Sodium hydroxide (97.5%; lot # 051758), was obtained from Fisher Scientific, Fair Lawn, NJ. Concentrated hydrochloric acid (37%; lot # 2612KLHV) was purchased from Mallinckrodt Specialty Chemicals Co. (St. Louis, MO). Amorphous silicon dioxide (Cab-o-Sil M5, lot I107) was obtained from Cabot Corp. (Billerica, MA).
Preparation of cellulose II powder (CII)
Cotton linter strips (~0.5x5 cm) were soaked in 7.5 N NaOH for 72 h (cellulose:NaOH ratio 1:6, w/v) at room temperature. The cellulose II strips were then washed with distilled water until reaching a neutral pH. Approxi-mately 280 g of this material was hydrolyzed with 2 L of 1 N HCl for about 2 h at 105 °C. The cooled material was then iltered and washed with distilled water until neutra-lization. The material was then dried at room temperature.
Preparation of CII-SiO2 composites by spray-drying
Aqueous dispersions (5%, w/v) containing 98:2, 95:5, 90:10, and 80:20 weight-by-weight ratios of CII and SiO2 were prepared with a homogenizer (Biospec products,
Inc, Bartlesville, OK) for 10 min at 10,000 r.p.m. The dis-persions were spray-dried on a Yamato Pulvis spray-drier (Model GB-22, Yamato Scientiic, Co. Tokyo, Japan). The operational conditions used were: inlet air temperature of 195 °C; atomizing air pressure of 1.0 kg-f/cm2; drying
air rate of 0.44 m3/min; feed low rate of 2.0 mL/min and
nozzle diameter of 0.7 mm. Samples with silicon dioxide levels higher than 20% were not employed in this study since high levels of silicon dioxide rendered weak com-pacts showing signs of chipping and capping independent of the compression force used.
Fourier-Transform Infrared Spectroscopy (FT-IR) characterization
Approximately1.5 mg of sample was mixed with about 300 mg of dry Potassium Bromide (dried at 110 °C for 4 hours before use) with an agate mortar and pestle. The powdered sample was compressed into a pellet using a 13 mm lat-faced punch set and a die on a hydraulic press (Pasadena press, Pasadena Hydraulics, Inc, El Monte, CA) at ~15,000 lbs. The dwell time was ive minutes. A Nicolet 210 FT-IR spectrophotometer (Nicolet Corp, Madison, WI), equipped with Ommic software (Nicolet Corp, Ma-dison, WI), was used to obtain the spectrum between 650 to 4000 cm-1.
Powder X-Rays (PXRD) characterization
Powder X-ray diffractions (PXRD) measurements were conducted over a 5 to 45º 2θ range using a Siemens diffractometer (Model D5000, Siemens Energy and Auto-mation, Inc., Madison, WI), equipped with monochroma-tic CuKα (α1=1.5460 Å, α2= 1.54438 Å) X-ray radiation. The step width was 0.020º 2θ /min with a time constant of 0.5 sec. The Difrac® plus Eva software, version 2.0
(Siemens Energy and Automatization, Inc, Madison, WI) was used for calculation of the areas.
Water sorption isotherms
Water sorption isotherms were conducted on a VTI®
Mil-ford, MA) at 25 °C. The water activity range employed was between 0 and 0.9. Water uptake was considered at equilibrium when the sample weight change of no more than 0.01% was reached. Samples were analyzed in tri-plicate.
Moisture sorption models
The Guggenheim-Anderson-de Boer (GAB) model
This model was derived independently by Gugge-nheim (1966), Anderson (1946), and de-Boer (1953). It has been adopted widely among scientists (Koskar, Kmetec, 2005) since it its data of non-ideal water sorption at water activities from 0 to 0.95 (Jonquieres, Fane, 1998).
The GAB model is based on the sorption theory of water on the surface of solids developed by BET (Bru-nauer, Emmet, and Teller) (Brunauer et al., 1940). This model assumes that the partition functions for the secon-dary and higher layers of sorbed water to be energetically the same, but different from that of liquid water, as well as different from the primary sorbed water (Villalobos et al., 2006). The model assumes that the heat of adsorption in the multilayer system is less than the heat of liquefaction. The GAB model is expressed as depicted in equations 1-3 (Vega-Mercado, Barbosa-Canovas, 1993):
Equation 1
Equation 2
Equation 3
Where, m is the fractional moisture content, aw
is the water activity, and mo is the monolayer moisture
content. This value can be used to estimate the optimum moisture content for the stability and preservation of food and pharmaceutical additives (Oliveira et al., 2009). HM, HN and HC are the molar sorption enthalpies of the
monolayer, multilayer and heat of condensation of water, respectively. R is the gas constant (8.31 J/Kmol), T is the absolute temperature, and D and B are entropic accom-modation factors, respectively. K is the energy constant related to the multilayer properties. Thus, it represents the partition function of the secondary sorbed molecules to that of external condensed liquid. This constant is usually less than 1 (Perrin et al.., 1997). The C constant is rela-ted to the energetic properties of the monolayer. It is the ratio of the partition function of the primary molecules to that of the external condensed water (Kachrimanis et al., 2006).
Generalized D’Arcy and Watt (GDW) Model
This model assumes the existence of monolayer and multilayer adsorption sites on the solid surface and the possibility that one water molecule attached to a primary center can give rise to more than one secondary adsorp-tion site (Furmaniak et al., 2007). This means that not all water molecules adsorbed on the primary sites will create secondary centers. Thus, the number of secondary sites created from primary molecules will be different, making the multilayer coverage non-homogeneous. This model is expressed as shown in equation 4:
Equation 4
where: m is the total fractional moisture content , m0 the
monolayer capacity, aw the water activity, w a parameter
determining what fraction of water molecules adsorbed on primary sites convert into secondary adsorption sites, and K and C have the same meaning as mentioned in the GAB model (Vieira, Rocha, 2006).
Hailwood & Horrobin model (HH)
This solid-solution model was created to descri-be the water sorption properties of cotton and can descri-be used to determine the sorption properties of cellulosic materials. This model considers that water can be absorbed as a multilayer and monolayer (hydrated) form. It assumes that unhydrated polymer, hydrated polymer and multilayer water are in equilibrium (Hill et al., 2009). The HH model is expressed as shown in equation 5 and 6:
Equation 5
Equation 6
Where, m is the total fractional moisture content, mh and ms are the fractional moisture contents of the
monolayer, and multilayer water, respectively. W is the molecular weight of polymer per sorption site, aw is the
water activity, 18 g/mol is the molar mass of water and K1 and K2 are the equilibrium constants for the formation
the hysteresis phenomena of microporous materials. Mh is related to the number of primary sorption sites
(OH groups) in the polymer. This value can be used to determine the number of accessible OH groups in each material (Hartley et al., 1992).
Compact disintegration studies
Approximately 500 mg of powder was com-pressed on a hydraulic press (Model C, Carver Press, Menomonee Falls, WI) at pressures ranging from 10 to 260 MPa using a round lat-faced 13 mm punch and die set at a dwell time of 30 seconds. The upper punch was equipped with a load cell (Model: LCGD-10K, Serial No. 188578, Range 0-10000 lbs, Omega Engineering, Inc., Stamford, CT) and a strain gauge meter (Model: DP25B-S, Serial No. 033252291, Omega Engineering, Inc., Stamford, CT). Tablets were kept in a dessicator over Drierite for 48 h before analysis. The disintegration test was performed in ive replicates in distilled water at 37 ºC employing an Erweka GmbH disintegration apparatus (type 712, Erweka, Offenbach, Germany) at 30 strokes/min.
RESULTS AND DISCUSSION
FT-IR characterization
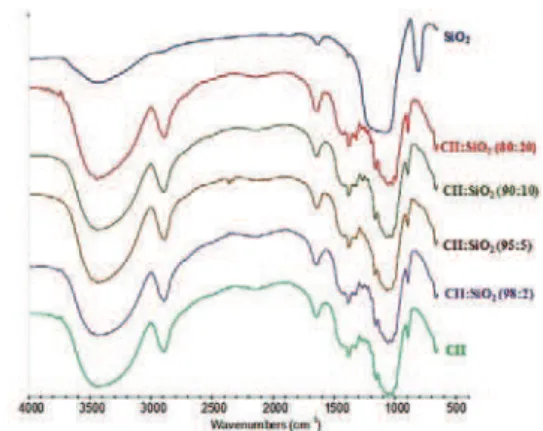
As seen in Figure 1, the incorporation of silicon dioxide had no effect on the cellulose II infrared bands. These results are not surprising since it is well known that co-processing does not cause any change in the chemical structure of cellulose (Tobyn et al., 1998). Cellulose II samples showed the following characte-ristic vibration peaks: 3445 cm-1 corresponding to
in-tramolecular OH stretching, including hydrogen bonds, 2893 cm-1 due to CH and CH
2 stretching, 1642 cm-1
corresponding to OH from absorbed water, 1427 cm-1
due to CH2 symmetric bending, 1379 cm-1 due to CH
bending, 1330 cm-1 due to OH in plane bending, 1255
corresponding to C-O-H bending, 1161 due to C-O-C asymmetric stretching (β-glucosidic linkage), 1061 due to C-O/C-C stretching and 895 cm-1 due to the
asymme-tric (rocking) C-1 (β-glucosidic linkage) out-of-plane stretching vibrations. This band is associated to the cellulose II lattice (Carrillo et al., 2004; Zhbankov, 1964). Amorphous silicon dioxide showed vibration bands at: 3445 cm-1 due to OH stretching (sylanol
moieties), 1080 cm-1 and 810 cm-1due to the asymmetric
stretching and symmetric stretching modes of Si-O-Si, respectively (Wang et al., 1999).
PXRD characterization
The PXRD of CII, SiO2, and CII:SiO2 composites
are shown in Figure 2. Independent of the siliciication level, all the cellulose II materials showed peaks at 12, 20 and 22° 2θ corresponding to the 1 ī 0, 110 and 200 relections, respectively, conirming the presence of the cellulose II lattice (Klemm et al., 1998). In contrast, SiO2
showed a diffused halo indicating its amorphous nature. It is clear that siliciication had no effect on the polymorphic nature of cellulose II.
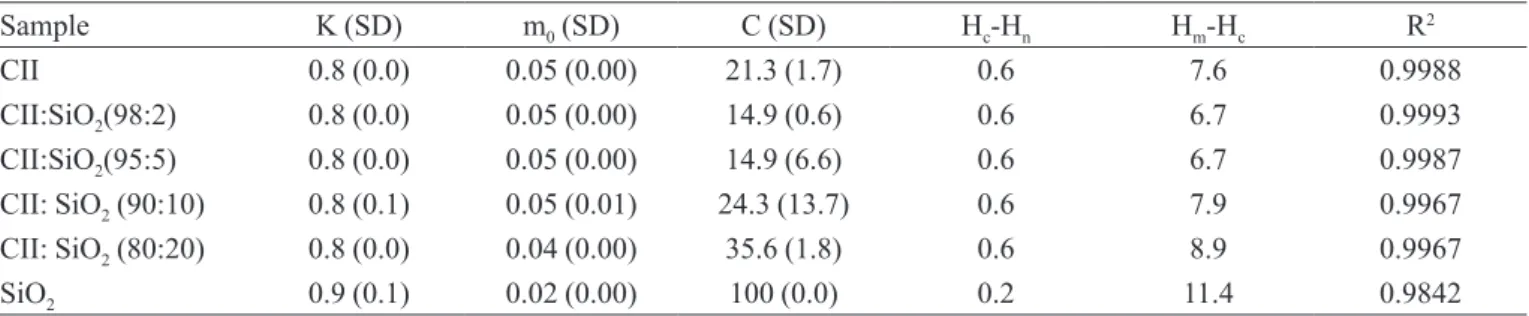
The Guggenheim-Anderson-de Boer (GAB) model
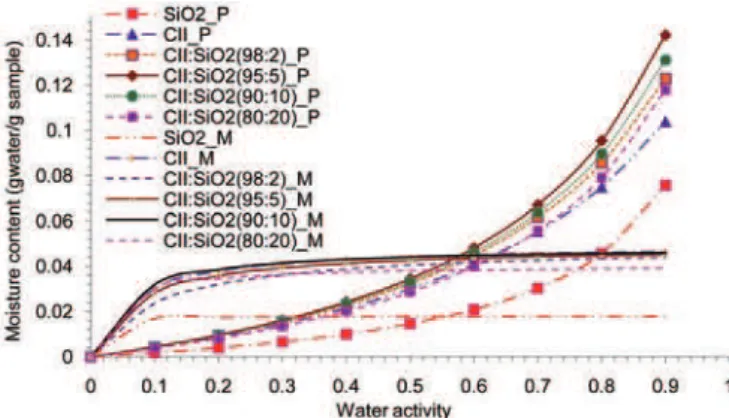
Figure 3 shows the itting curves for water sorption of the materials and Table I shows the parameters derived from the GAB model. Figure 3 also shows that SiO2 was
the least hydrophilic material compared to the CII:SiO2
composites. Except for SiO2, correlation coefficients
were higher than 0.9967 indicating a good it of the data to the experimental model. Since CII is highly hydrophi-lic, the monolayer sorption capacity (m0) indicates that
the afinity of CII for water decreased by 20% (0.04 g water/g cellulose) only at the 20% siliciication level. In other words, the surface area covered by a monolayer of water molecules decreased by 20%. This means that the
FIGURE 1 - FT-IR spectra of the CII:SiO2 composites.
primary sites of CII are already interacting via hydrogen bonding with the sylanol groups of SiO2 leaving few
hydroxyl groups of CII available for hydrogen bonding with water molecules. The energy constant of multilayer sorption (k) and the Hm-Hc difference did not change
with siliciication (0.8 and 0.6 kJ/mol, respectively). By contrast, the energy constant of monolayer sorption (C ) only increased signiicantly at the 20% siliciication level (35.6). Similarly, at this level the largest Hm-Hc difference
was observed (8.9 kJ/mol).
In all cases, the enthalpy difference found for the monolayer was higher than that for the multilayer (Hm-Hc
> Hc-Hn) indicating that the energetic for the formation of
a monolayer is more prevalent than that of the multilayer. The enthalpy difference for the monolayer (Hm-Hc) was
the highest at a siliciication level of 20% and for SiO2. As
CII becomes less hydrophilic, water molecules are sorbed more tightly in the active sites and thus, the formation of a monolayer is energetically more favored than the for-mation of multilayer. Conversely, the enthalpy difference (Hc-Hn) remained unchanged indicating that siliciication
inluences the afinity of cellulose II for water mainly by inducing changes in the monolayer enthalpy.
The low afinity of SiO2 for water was relected in the
lowest mo value (0.02 g water/g polymer). This indicates that
the material has only 40% of the hydrophilicity shown by CII. As SiO2 contains fewer hydroxyl groups than CII, it is
inferred that the better afinity of water for CII is due to its stronger interaction with the hydroxyl groups compared to the interaction with the sylanol groups of SiO2.
SiO2 presented the lowest Hc-Hn and the
hi-ghest Hm-Hc enthalpy values among all the samples
(0.2 kJ/mol and 11.4 kJ/mol, respectively). This indicates that the formation of a monolayer is more likely to occur and remain in this state than to form secondary and on-going water layers. In this case, the multilayer formation is less favored since its energetic is very low indicating a very weak interaction.
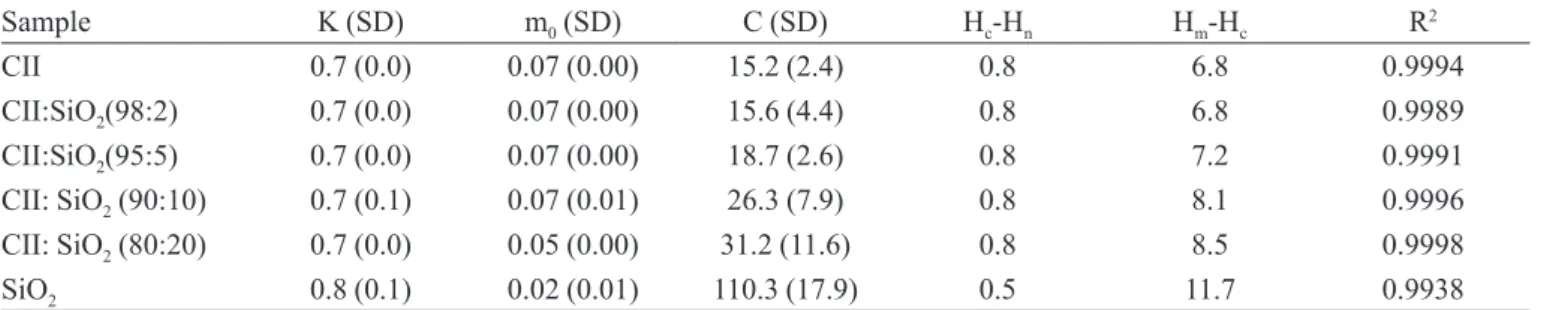
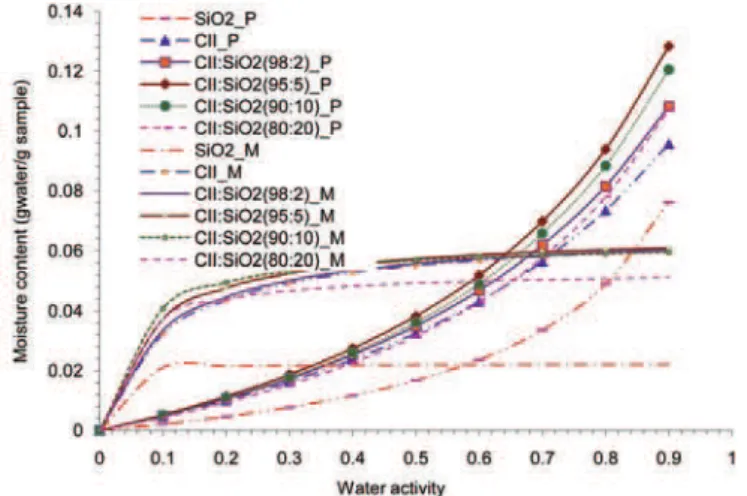
Figure 4 and Table II show the data obtained from the desorption isotherms according to the GAB model. Correlation coeficients were higher than 0.9938 indica-ting a good it to the experimental data.
As seen for the sorption isotherms, the energetic for the multilayer sorption (k and Hc-Hn values) was not
affec-ted by siliciication (0.7 and 0.8 kJ/mol, respectively), but the C and Hm-Hc values increased with siliciication. The
enthalpies of the multilayer adsorption were 25% lower than the enthalpies of desorption, indicating that the mul-tilayer formation is more favorable during adsorption than the desorption stage. Conversely, there were no signiicant differences among the monolayer enthalpies of adsorption and desorption, respectively.
The monolayer capacity (m0) of the desorption
iso-therms decreased 29% at a SiO2 level of 20%. In general, m0 values were 40% higher than the those obtained from
the adsorption isotherms, except for SiO2 in which it re-mained constant (0.02 g water/g SiO2). Results proved that
desorption isotherms of CII:SiO2 composites were larger
FIGURE 3 - Moisture sorption behavior of the CII:SiO2
composites itted by the GAB models.
TABLE I- GAB parameters obtained from sorption isotherms of CII:SiO2 composites
Sample K (SD) m0 (SD) C (SD) Hc-Hn Hm-Hc R2
CII 0.8 (0.0) 0.05 (0.00) 21.3 (1.7) 0.6 7.6 0.9988
CII:SiO2(98:2) 0.8 (0.0) 0.05 (0.00) 14.9 (0.6) 0.6 6.7 0.9993
CII:SiO2(95:5) 0.8 (0.0) 0.05 (0.00) 14.9 (6.6) 0.6 6.7 0.9987
CII: SiO2 (90:10) 0.8 (0.1) 0.05 (0.01) 24.3 (13.7) 0.6 7.9 0.9967
CII: SiO2 (80:20) 0.8 (0.0) 0.04 (0.00) 35.6 (1.8) 0.6 8.9 0.9967
SiO2 0.9 (0.1) 0.02 (0.00) 100 (0.0) 0.2 11.4 0.9842
SD = standard deviation of three replicates; K= energy constant of multilayer sorption; C= energy constant of monolayer sorption; Hc-Hn, = enthalpy for multilayer sorption; Hm-Hc= enthalpy for monolayer sorption; mo= monolayer capacity; R2= correlation
than the desorption isotherms, indicating hysteresis in the water uptake behavior. It has been reported that hysteresis is a common phenomenon in highly hydrophilic materials due to the ink drop theory. This phenomenon is less evident for SiO2.
Generalized D’Arcy and Watt (GDW) model
The GDW model assumes the existence of primary (Langmuir-type) adsorption sites on the surface. Each site adsorbs one water molecule, which could serve as secondary adsorption sites for the consecutive molecules. Figure 5 shows that the CII:SiO2 composites were more
hygroscopic than SiO2 alone. The high water afinity of
these composites is due to the large number of hydrophilic groups (binding sites) present in their structure. Table III shows the parameters obtained from the GDW model. All samples presented an excellent it to the sorption data (>0.9984).
The water sorption capacity decreased as the amount of SiO2 increased. This effect could be attributed to
possi-ble hydrogen bond interactions between hydroxyl groups
of cellulose and sylanol groups of SiO2, reducing the
num-ber of active sites for water adsorption. As water activity increases, changes in the supra-molecular structure of CII may occur, modifying the CII-SiO2 interactions.
Table III shows the parameters derived from the GDW model for the sorption data. Except for SiO2,
cor-relation coeficients were higher than 0.9984, indicating a good it to the experimental data. Even though CII materials are highly hydrophilic, the fraction of prima-ry sites which became centers for secondaprima-ry sorption (W) was less than 1, ranging from 0.38 to 0.87. This indicates that the secondary centers were not energeti-cally the same. In this case, the lowest fractions were obtained at SiO2 levels greater than 10% and for pure
SiO2. This implies that siliciication hinders the forma-tion of secondary and higher levels of water layering. In fact, for pure SiO2 only 25% of the strongly bound water molecules become centers for the formation of a multilayer. It is plausible that the surface of water molecules become rough since the thickness will not be constant throughout the entire surface.
TABLE II - GAB parameters obtained from desorption isotherms of CII:SiO2 composites
Sample K (SD) m0 (SD) C (SD) Hc-Hn Hm-Hc R2
CII 0.7 (0.0) 0.07 (0.00) 15.2 (2.4) 0.8 6.8 0.9994
CII:SiO2(98:2) 0.7 (0.0) 0.07 (0.00) 15.6 (4.4) 0.8 6.8 0.9989
CII:SiO2(95:5) 0.7 (0.0) 0.07 (0.00) 18.7 (2.6) 0.8 7.2 0.9991
CII: SiO2 (90:10) 0.7 (0.1) 0.07 (0.01) 26.3 (7.9) 0.8 8.1 0.9996
CII: SiO2 (80:20) 0.7 (0.0) 0.05 (0.00) 31.2 (11.6) 0.8 8.5 0.9998
SiO2 0.8 (0.1) 0.02 (0.01) 110.3 (17.9) 0.5 11.7 0.9938
SD= standard deviation of three replicates; K= energy constant of multilayer sorption; C= energy constant of monolayer sorption; Hc-Hn, = enthalpy for multilayer sorption; Hm-Hc= enthalpy for monolayer sorption; mo= monolayer capacity; R2= correlation
coeficient
FIGURE 4 - Moisture desorption behavior of the CII:SiO2 composites itted by the GAB models.
The monolayer constant (m0) ranged from 0.06
to 0.08 g water/g polymer and was not correlated to the siliciication level. However, for pure SiO2 the maximum
sorption on the primary sites was very low (0.03 g water/g SiO2) showing the most hydrophobic properties among
all materials.
The monolayer energy constants (C) were higher than the multilayer energy constants (k). This indicates that the monolayer water molecules are strongly attached to the surface of the polymer whereas the secondary and further water molecules are weakly attached. The values of C and k indicate that silicification had virtually no affect on the energetic of the system. SiO2 exhibited the
highest C value indicating the prevalence of energetic for the formation of a monolayer. This high value is relected in the high monolayer enthalpy obtained (7.7 kJ/mol). In
contrast, this model predicts an enthalpy for multilayer formation (Hm-Hc) of 0.0 kJ/mol for SiO2.This indicates
that the formation of secondary and further sorption sites is not favored in this material.
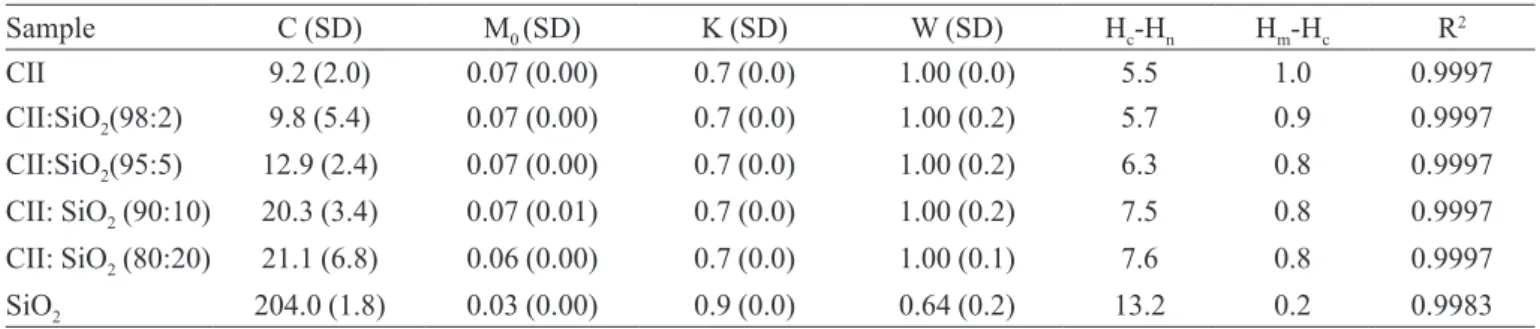
Table IV shows the desorption parameters obtained from the GDW model. The model its to the data very well (R2>0.9983). The desorption isotherms showed that the
C energy value increased with siliciication (from 9.2 to 21.1). This observation was also relected in the enthalpy values of monolayer (from 5.5 to 7.6 kJ/mol). In other words, siliciication eased the formation of a monolayer as opposed to a multilayer. However, the k value remained virtually unchanged and was the highest for SiO2. The
frac-tion of primary sites which became centers for secondary sorption (W) was equal to one for all cellulosic materials. This indicates that all primary sites serve as centers for the creation of secondary sites independent of SiO2 content.
The monolayer constant (m0) was 0.07 g water/g
polymer and decreased at the 20% silicification level. This means that the high concentration of SiO2 on the
surface of CII hindered the formation of hydrogen bonds between cellulose and water. However, for pure SiO2, the
maximum sorption on primary sites was the same as that shown by the sorption isotherm (0.03 g water/g SiO2) thus
demonstrating its hydrophobic property.
Hysteresis is defined as the difference between the amount of water desorbed and sorbed, respectively. This difference creates a loop in the isotherm and is very common in hydrophilic materials. Figure 6 shows the relationship between percentage of hysteresis formation
TABLE III- GDW parameters obtained from the sorption isotherms of CII:SiO2 composites
Sample C (SD) m0 (SD) K (SD) W (SD) Hc-Hn Hm-Hc R2
SiO2 22.1 (1.4) 0.03 (0.00) 1.0 (0.0) 0.25 (0.14) 7.7 0.0 0.9986
CII 8.1 (1.4) 0.07 (0.00) 0.8 (0.0) 0.47 (0.07) 5.2 0.4 0.9997
CII:SiO2(98:2) 7.7 (4.1) 0.06 (0.01) 0.8 (0.0) 0.87 (0.10) 5.1 0.5 0.9994
CII:SiO2(95:5) 7.0 (1.5) 0.07 (0.01) 0.9 (0.0) 0.56 (0.07) 4.8 0.3 0.9992
CII: SiO2 (90:10) 6.1 (2.3) 0.08 (0.04) 0.9 (0.0) 0.38 (0.10) 4.5 0.2 0.9988
CII: SiO2 (80:20) 8.9 (1.0) 0.06 (0.00) 0.9 (0.0) 0.38 (0.05) 5.4 0.2 0.9984
SD= standard deviation of three replicates; k= energy constant of multilayer sorption ; C= energy constant of monolayer sorption; Hc-Hn, = enthalpy for multilayer sorption; Hm-Hc= enthalpy for monolayer sorption; mo= monolayer capacity; w= fraction of primary
sites which become centers for secondary sorption; R2= correlation coeficient.
TABLE IV - GDW parameters obtained from the desorption isotherms of CII:SiO2 composites
Sample C (SD) M0 (SD) K (SD) W (SD) Hc-Hn Hm-Hc R2
CII 9.2 (2.0) 0.07 (0.00) 0.7 (0.0) 1.00 (0.0) 5.5 1.0 0.9997
CII:SiO2(98:2) 9.8 (5.4) 0.07 (0.00) 0.7 (0.0) 1.00 (0.2) 5.7 0.9 0.9997
CII:SiO2(95:5) 12.9 (2.4) 0.07 (0.00) 0.7 (0.0) 1.00 (0.2) 6.3 0.8 0.9997
CII: SiO2 (90:10) 20.3 (3.4) 0.07 (0.01) 0.7 (0.0) 1.00 (0.2) 7.5 0.8 0.9997
CII: SiO2 (80:20) 21.1 (6.8) 0.06 (0.00) 0.7 (0.0) 1.00 (0.1) 7.6 0.8 0.9997
SiO2 204.0 (1.8) 0.03 (0.00) 0.9 (0.0) 0.64 (0.2) 13.2 0.2 0.9983
SD= standard deviation of three replicates; k= energy constant of multilayer sorption; C= energy constant of monolayer sorption; Hc-Hn, = enthalpy for multilayer sorption; Hm-Hc= enthalpy for monolayer sorption; mo= monolayer capacity; w= fraction of primary
with water activity of the CII:SiO2 composites. In all
ca-ses, the percentage of hysteresis was the lowest at a water activity of 0.9 and the highest at a water activity of 0.1. The degree of hysteresis remained virtually unchanged from 0.2 to 0.7. Results indicate that hysteresis occurred throughout the sorption range and not just in the capillary condensation region as reported previously (Parker et al.., 2006). It is well known that the higher moisture content obtained when a polymer is desorbing from a saturated state is due to microcapillary deformation accompanied by the creation of more permanent hydrogen bonds which are no longer attainable in subsequent re-wetting processes. This phenomenon is known in cellulose as horniication. Thus, when cellulose sorbs water it swells slightly because microcapillaries expand due to the thermal motion of inco-ming water molecules forinco-ming new internal surfaces. Once water is removed, relaxation of the matrix to the original state is prevented. As a result, microcapillaries become greater on desorption compared to the adsorption step.
Hailwood & Horrobin model (HH)
The HH model assumes the formation of three species in equilibrium (anhydrate polymer, polymer with a monolayer and polymer with a multilayer). The HH is a solution-based theory and is not based on the layering method as described in the GAB model.
Figures 7 and 9 show the fitted HH models and Figures 9 and 10 show the deconvoluted curves in which the monolayer and multilayer are shown as saturation and exponential curves, respectively. The formation of a monolayer starts at a water activity of 0.1 for both the sorption and desorption curves. The shape of these mo-nolayers resembles the Brauner type I isotherms. Silicon dioxide presented the lowest amount of water necessary to form a monolayer. It reached a plateau at a water activity of 0.1 and then remained constant. This indicates a low
afinity for water since the formation of hydrogen bonds occur only through the sylanol groups. Thus, all the syla-nol groups available for binding are occupied rapidly at a water activity of 0.1. Conversely, all CII:SiO2
compo-sites exhibited a great afinity for water molecules. This is explained by the great number of hydroxyl groups of the polymer which can form hydrogen bonds with these water molecules. In this case, there is a steady increase of sorbed water up to a water activity of 0.5. Further water sorption only accounts for around 7% of the whole mo-nolayer coverage.
The fraction of water molecules which are part of the multilayer are shown in Figure 7. This shape is simi-lar to the Brauner type III isotherm. These curves exhibit an exponential increase with water activity. In contrast, water molecules in the multilayer presented the lowest increasing tendency for silicon dioxide. It is also observed that, initially at a low water activity, molecules of water prefer binding to an empty site rather than to an already monomolecular occupied site. Nevertheless, at a 0.5 water activity an incoming water molecule has the same proba-bility of binding a monomolecular occupied or an empty
FIGURE 6 - Degree of hysteresis for the CII:SiO2 composites.
FIGURE 7 - Moisture sorption behavior of the CII:SiO2 composites itted by the HH model.
site. Further, at water activities higher than 0.55, incoming water molecules are more likely to be attracted to already occupied sites than to the few remaining empty centers.
Table VI shows the parameters of the HH itting. Except for SiO2, the correlation coeficients from the
non-linear itting were higher than 0.9967, indicating a good it of the experimental data to the model. Siliciication
increased the k equilibrium constant, while the C constant remained unchanged. This indicates that the presence of SiO2 favors the formation of a monolayer and makes no
contribution to the formation of a multilayer. In fact, a surface formed by sylanol groups is more likely to form almost a complete monolayer with incoming water mole-cules (~90% coverage) at a very low water activity (0.1) than the hydroxyl groups of cellulose. The w value indica-tes the grams of water per mole of sorption siindica-tes. It is clear that the amount of water which binds to the sorption sites decreases with the presence of SiO2. This means that SiO2
occupies part of the surface area of cellulose, consuming part of the hydroxyl groups available for binding water molecules. As a result, a low amount of hydroxyl groups of cellulose will be able to bind water molecules. Silicon dioxide is able to bind only ~ 1/3 of the water molecules which cellulose II alone binds.
Figure 10 shows the deconvoluted desorption curves according to the HH model. This model shows that the monolayer formation of most materials starts as early as 0.1 water activity. Thus, at a water activity of 0.1, nearly 90% of most materials are already covered by a monolayer. However, it is possible that secondary sorption centers start emerging before the monolayer is complete.
Table VI shows the itting parameters obtained from the desorption isotherms. Except for SiO2, the correlation
coeficients from the non-linear itting were higher than 0.9938, indicating a good it of the experimental data to the model. Table VI also shows the k and C equilibrium constants for the formation of a monolayer and multi-layer, respectively. Siliciication favored the formation of a monolayer over a multilayer, particularly at a 20% siliciication level. In fact, the w values for the desorp-tion isotherms showed a significant reducdesorp-tion (0.97 g water/mole polymer) at this level of siliciication. Silicon dioxide is considered the most hydrophobic material among all samples since it had the lowest w value (0.4 g water/mole polymer). Comparison of w parameters from
FIGURE 9 - Moisture desorption behavior of the CII:SiO2
composites itted by the HH model.
FIGURE 10 - Deconvoluted desorption curves of the CII:SiO2
composites itted by the HH model.
TABLE V - HH parameters obtained from sorption isotherms of CII:SiO2 composites.
Sample K (SD) w SD C (SD) R2
CII 20.3 (1.7) 0.90 (0.02) 0.8 (0.0) 0.9988
CII:SiO2(98:2) 11.6 (4.2) 0.89 (0.03) 0.8 (0.0) 0.9993
CII:SiO2(95:5) 16.3 (2.8) 0.88 (0.02) 0.8 (0.0) 0.9986
CII: SiO2 (90:10) 23.3 (3.7) 0.88 (0.16) 0.8 (0.0) 0.9967
CII: SiO2 (80:20) 34.6 (1.8) 0.73 (0.03) 0.8 (0.0) 0.9967
SiO2 200.0 (0.00) 0.32 (0.06) 0.9 (0.0) 0.9842
Table V and VI clearly illustrates that more water mole-cules are able to interact through hydrogen bonding with the substrate during the desorption than the sorption phase (0.4 vs 0.32 g water/g SiO2, respectively).
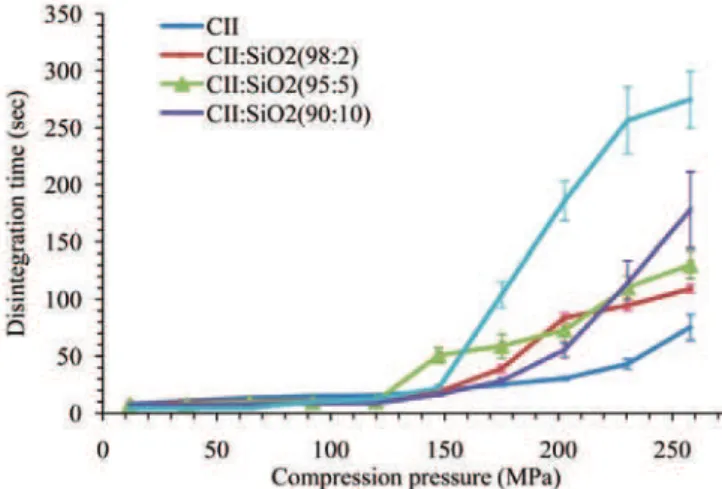
COMPACT DISINTEGRATION
This test was conducted to determine how silici-ication could affect the fast disintegrating properties of cellulose II. As seen in Figure 11, the fast disintegrating properties of cellulose II were not affected (~18 sec.) by siliciication up to 120 MPa. However, at compression pressures higher than 150 MPa, compacts disintegrated slowly and disintegration times were inversely related to the siliciication level. In other words, at 260 MPa, cellu-lose II alone showed the fastest disintegration (70 sec) whereas the sample with a 20% siliciication level showed the slowest disintegration ability (270 sec.). These results agreed with the trend observed in the water sorption ability of cellulose II with siliciication. This means that high levels of amorphous silicon dioxide (20%) hinder the interaction of cellulose II, with water delaying the water accessibility into the compact necessary for rapid tablet disintegration.
CONCLUSION
The water sorption and desorption property of the cellulose II:SiO2 composites was affected only at the 20%
siliciication level. In this case, cellulose II became more hydrophobic. All the models employed had an excellent it to the data, showing a type II Brunauer isotherm. These composite materials showed a hysteresis loop which is characteristic of cellulosic materials when the capillaries shrink during desorption. In contrast to the GAB model, the GDW and HH models assume sorption and desorption as a dynamic process in which the primary centers are illed up throughout the whole water activity range and
TABLE VI - HH parameters obtained from desorption isotherms of CII:SiO2 composites
Sample K (SD) w (SD) C (SD) R2
CII 14.2 (2.4) 1.2 (0.1) 0.7 (0.0) 0.9994
CII:SiO2(98:2) 14.6 (4.4) 1.2 (0.0) 0.7 (0.0) 0.9989
CII:SiO2(95:5) 17.7 (2.6) 1.2 (0.0) 0.7 (0.0) 0.9991
CII: SiO2 (90:10) 25.3 (7.9) 1.1 (0.1) 0.7 (0.1) 0.9996
CII: SiO2 (80:20) 30.2 (11.5) 1.0 (0.1) 0.7 (0.0) 0.9998
SiO2 200 (0.1) 0.4 (0.0) 0.9 (0.0) 0.9938
SD= standard deviation of three replicates; k= monolayer equilibrium constant; C= multilayer equilibrium constant; w= grams of water per mole of sorption sites; R2= correlation coeficient
do not require the formation of a monolayer to form a multilayer as shown by the GAB model. Only compacts made with the sample that had a 20% siliciication level presented a delayed disintegration time at high compres-sion pressures. Silicification had no effect on the fast disintegrating properties of cellulose II at compression pressures lower than 120 MPa.
ACKNOWLEDGMENTS
The authors would like to thank Dr. Vijay Kumar at The University of Iowa for the inancial support of this project.
REFERENCES
BRUNAUER, S.; EMMET, P. H.; TELLER, E. Adsorption of gases in multimolecular layer. J. Am. Chem. Soc., v.60, p.309-319, 1938.
BRUNAUER, S.; DEMING, W. E.; TELLER, E. On a theory of the van der Waal adsorption of gases J. Am. Chem. Soc., v.62, p.1723-1732, 1940.
CARRILLO, F.; COLOM, X.; SUNOL, J. J.; SAURINA, J. Structural FTIR analysis and thermal characterization of lyocel and viscose-type ibers. Eur. Polym. J., v.40, p.229-234, 2004.
HARTLEY, D. I.; KAMKE, F. A.; PEEMOELLER, H. Cluster theory for water sorption in wood. Wood Sci. Technol., v.26, p.83-99, 1992.
HILL, A. S. C; NORTON, A.; NEWMAN, G. The water vapor sorption behavior of natural ibers. J. Appl. Polym. Sci., v.112, p.1524-1537, 2009.
JONQUIERES, J.; FANE, A. J. Moisture in organic coating- a review. Appl. Polym. Sci., v.67, p.1415-1430, 1998.
KACHRIMANIS, K.; NOISTERNIG, M. F.; GRIESSER, U. J.; MALAMATARIS, S. Dynamic moisture sorption and desorption of standard and siliciied microcrystalline cellulose. Eur. J. Pharm. Biopharm., v.64, p.307-315, 2006.
KLEMM, D.; PHILIPP, B.; HEINZE, T.; HEINZE, U. Comprehensive cellulose chemistry: functionalization of cellulose. New York: John Wiley, 1998. 389 p.
KOSKAR, R.; KMETEC, V. Evaluation of the moisture sorption of several excipients by BET, GAB and microcalorimetric approaches. Chem. Pharm. Bull., v.53, p.662-665, 2005.
KUMAR, V.; REUS, M.; YANG, D. Preparation, characterization, and tableting properties of a new cellulose-based pharmaceutical aid. Int. J. Pharm., v.235, p.129-140, 2002.
OLIVEIRA, E. G.; ROSA, G. S.; MORAES, M. A.; PINTO, L. A. A. Moisture sorption characteristics of microalgae Spirulina platensis. Braz. J. Chem. Eng., v.26, p.189-197, 2009.
PERRIN, L.; NGUYEN, T. Q.; SACCO, D. P. Experimental studies and modelling of sorption and diffusion of water and alcohols in cellulose acetate. Polym. Int., v.42, p.9-16, 1997.
PARKER, M. E.; BRONLUND, J. E.; MAWSON, A. J. Moisture sorption isotherms for paper and paperboard in food chain conditions. Packag. Technol. Sci., v.19, p.193-209, 2006.
ROJAS, J. Preparation and evaluation of cellulose II powders and cellulose II: Silicon dioxide composites as direct compression excipients. Iowa City, 2010. p.1-447. [PhD Thesis. University of Iowa].
REUS, M.; KUMAR, V. Evaluation of cellulose II powders as a potential multifunctional excipient in tablet formulations. Int. J. Pharm., v.322, 202-209, 2006.
TOBYN, M. J.; McCARTHY, G. P.; STANIFORTH, J. N.; EDGE, S. Physicochemical comparison between microcrystalline cellulose and siliciied microcrystalline cellulose. Int. J. Pharm., v.169, p.183-194, 1998.
VAN DER WEL, G. K; ADAN, O. C. G. Moisture in organic coating: a review. Prog. Org. Coat., v.37, p.1-14, 1999.
VEGA-MERCADO, H.; BARBOSA-CANOVAS, G. Comparison of moisture sorption models in freeze-dried pineapple pulp. J. Agric. Univ. P. R., v.77, p.112-128, 1993.
VIEIRA, M. G. A.; ROCHA, S. C. S. Mathematical modeling of handmade recycled paper drying kinetics and sorption isotherms. Braz. J. Chem. Eng., v.25, p.299-312, 2006.
VILLALOBOS, R.; HERNANDEZ, P.; CHIRALT, A. Effect of surfactants on water sorption and barrier properties of hydroxypropyl methylcellulose ilms. Food Hydrocolloids, v.20, p.502-509, 2006.
WANG, J.; ZOU, B.; EL-SAYED, M. A. Comparison between the polarized Fourier-transform infrared spectra of aged porous silicon and amorphous silicon dioxide ilms on Si (100). surface. J. Molec. Struct., v.508, n.1/3, p.87–96, 1999.
ZHBANKOV, R. H., (Ed.). Infrared spectra of cellulose and its derivatives. New York: Consultants Bureau, 1966. 333 p.
Received for publication on 25th June 2010