*Correspondence: P. J. Rolim-Neto. Laboratório de Tecnologia dos Medicamentos, Departamento de Ciências Farmacêuticas, Universidade Federal de Pernambuco. Av. Prof. Arthur de Sá, s/n - Cidade Universitária, 50740-521 - Recife – PE, Brazil. Phone/Fax: (+55 81) 3272-1383.E-mail: [email protected]
A
vol. 47, n. 1, jan./mar., 2011
Development and validation of a HPLC analytical assay method for
efavirenz tablets: a medicine for HIV infections
Osnir de Sá Viana
1, Flávia Patrícia Morais Medeiros
2, Severino Grangeiro-Júnior
2, Miracy Muniz
Albuquerque
1, Mônica Felts La Roca Soares
1-3, José Lamartine Soares-Sobrinho
1-3, Lariza Darlene
Santos Alves
1, Larissa Araújo Rolim
1, Keyla Emanuelle Ramos da Silva
1, Pedro José Rolim-Neto
1*1Laboratory of Medicine Technology, Pharmaceutical Sciences Department, Pernambuco Federal University, 2Pernambuco State Pharmaceutical Laboratory – LAFEPE,
3Pharmaceutical Technology Nucleus, Department of Biochemistry and Pharmacology, Piauí Federal University
Efavirenz is a reverse transcriptase non analog nucleoside inhibitor used to treat HIV infections. A simple assay method by high performance liquid chromatography was developed and validated for efavirenz tablets. The physical chemical characteristics of efavirenz were investigated to developing the method. The method was validated observing the parameters described in USP 29. Analyses were performed by an ultraviolet detector at a 252 nm wavelength, on a reverse-phase column (C18, 250 mm x 3.9 mm,
10 µm), using an isocratic mobile phase containing acetonitrile/water/orthophosphoric acid (70:30:0.1). The validation parameters used were: selectivity, linearity, precision, accuracy, robustness, detection and quantiication limits, and all resulting data were treated by a statistical method. The results obtained conirmed an alternative assay method for efavirenz tablets adequate for routine industrial use.
Uniterms: Efavirenz/tablet assay. High performance liquid chromatography/quantitative analysis.
O efavirenz é um inibidor não análogo de nucleosídeo da transcriptase reversa, utilizado no tratamento da infecção por HIV. Um método simples, por cromatograia líquida de alta eiciência, foi desenvolvido e validado para quantiicação do efavirenz em comprimidos. O desenvolvimento do método levou em consideração as características físico-químicas do efavirenz. O método foi validado seguindo os parâmetros da USP 29. A análise foi realizada por meio de detector ultravioleta, utilizando um comprimento de onda de 252 nm, com coluna de fase reversa (C18, 250 mm x 3.9 mm, 10 µm) e fase móvel isocrática contendo
acetonitrila/água/ácido ortofosfórico (70: 30: 0.1). Os critérios usados para validação foram: seletividade, linearidade, precisão, exatidão, robustez e limites de detecção e quantiicação do método. Foi utilizado método estatístico em todas as etapas do processo de validação. Os resultados obtidos mostraram que o método é uma alternativa para quantiicação do efavirenz em comprimidos, tornando viável seu uso na rotina industrial e laboratórios analíticos.
Unitermos: Efavirenz/determinação em comprimidos. Cromatograia líquida de alta eiciência/análise quantitativa.
INTRODUCTION
Efavirenz is an antiretroviral agent employed in the treatment of HIV infections. It is a non analog nucleoside antiretroviral and non competitive reverse transcriptase
inhibitor. Efavirenz is directly connected to the enzyme and blocks RNA and DNA-dependent, DNA-polymerase activities, causing destruction of the enzyme catalytic site. It has a molecular form of C14H9ClF3NO2, and is optically
active with a molecular weight of 315.68. This crystalline powder has a white or slightly yellowish appearance. The substance has a melting point ranging from 136.0 ºC to 141 ºC, is nearly water insoluble but is soluble in methanol and dichloromethane (Clercq, 2001).
the majority seek to determine efavirenz by the HPLC technique associated with other antiretroviral drugs or their metabolites in biological luids (Sarasa-Nacenta et al., 2001; Matthews et al., 2002).
For pharmaceutical forms, Montgomery and
col-laborators(2001)used reverse phase chromatography to
analyze efavirenz and the impurities present in raw mate-rial and capsules. In the cited study, the authors used a cyan column and a gradient mobile phase, with different proportions of methanol, water, and triluoroacetic acid, and a 40-min run time. However, we sought to develop a method in order to facilitate the pharmaceutical indus-try’s quality control routine, and thus should combine fast analyses with reliable results.
The present study describes the development and validation of an analytical assay method for efavirenz raw material and tablets by HPCL. The isocratic method was used together with a reverse-phase C18 column, acetonitrile
mobile phase and water acidiied with orthophosphoric acid, and a 7 min run time, according to the parameters
described in USP 29(2006) and ICH(2005). The method
developed offers advantages over other methods described in the literature.
MATERIAL AND METHODS
Equipment
The previously described chromatographic system
comprised: Class VP (Shimadzu®) HPLC, Membrane
Degas-ser, LC-10ADVP pumps, SIL-10ADVP self-injector, SPD-10 AVP detector, SCL-10 AVP controller, and CTO-10ASVP oven; C18 column (Lichcrocart®) 250 x 4 mm (10 µm) and C8
column (Symmetry Waters®) 250 x 4.6 mm (5 µm).
Materials
The Efavirenz 600 mg coated tablet was develo-ped in Pernambuco State Pharmaceutical Laboratory (LAFEPE ), and has the following composition:
efavi-renz (Hetero Labs®, EF0230703); sodium sulfate lauryl
(Nuclear®); hydroxypropylcellulose (Denver®); cellulose
microcrystalline 250 and 101 (Blanver®);
polyvinylpyr-rolidone (Xiamem®); crospovidone (ISP Technologies®);
croscarmellose (Rellance celulose®); magnesium esterase
(Blanver®); colloidal silicon dioxide (Henkel®), opadry
Y-1-7000 (Colorcon ). The placebo used in the validation study was prepared with excipients only.
The following reagents were used: HPLC-grade
acetonitrile (ACN) (JT Baker®), HPLC-grade methanol
(JT Baker®), orthophosphoric acid (H
3PO4) at 85% for
analysis (Merck®). The puriied water used was obtained
using the reverse osmosis system (Milli-Q Millipore Corporation®).
Chromatographic conditions
The chromatographic conditions used to validate the dosage method for efavirenz, substance and inished product, were as follows: isocratic system with a mobile
phase made up of ACN: water: 85% H3PO4 (70:30:0.1);
low of 1.0 mL.min-1; oven temperature of 30 ºC;
injec-tion volume of 20 mL; λ = 252 nm; a C18 250 x 4 mm (10
µm) column. The asymmetry factor (As) was calculated as 10% of the height of the chromatographic band (Sny-der et al., 1997).
Standard solution preparation
Efavirenz supplied by Hetero Labs (lot WS.EF0202, with 99.93% purity), substance chemical reference (SQR), was used for standard solution preparation. The efavirenz standard stock solution was prepared in a mobile phase ACN/water/85% H3PO4 (70:30:0.1), at a concentration of
400 mg.mL-1. Dilutions with mobile phase were performed
in order to obtain solutions with concentrations between
10 and 40 µg.mL-1, where an average concentration of
20 mg.mL-1 was deined as 100%.
Analytical method development
Different columns, mobile phase, low, and column temperatures were tested in the development of the analyti-cal method. C8 and C18 columns of the same length and
diameter were also tested, keeping the same parameters and conditions (1 mL.min-1 low, mobile phase, injection
volume of 20 mL, temperature 30 ºC). For the mobile
phase, methanol/water, ACN/water and ACN/water/85% H3PO4 mixtures were tested, with the other parameters
kept constant. The mobile phase holdup time, resolution, efavirenz peak asymmetry, and quantity of fractions dei-ned by the reading of area integrations from the chromato-grams were assessed. The concentration of tested samples was 20 mg.mL-1 throughout method development.
Validation study
Robustness
The method’s robustness represented a measure of its ability to resist change in response to minor and delibe-rate variations in analytical parameters(ICH, 2005). Ro-bustness was determined based on temperature variations, mobile phase proportion, low, and different acetonitrile manufacturers (robustness for inished product assessed). The analyses were performed in sextuplicate.
Linearity
Linearity denotes the ability of the method to pro-vide results directly proportional to the concentration of substance in question within a given application range (Swartz, Krull, 1998; ICH, 2005; USP, 2006). The me-thod linearity was assessed by linear regression analysis using the least-squares methods for the average points of three authentic calibration curves, at concentrations
of 10, 15, 20, 25, 30 and 40 mg.mL-1. The variation
range tested was 50-150% of analysis concentration. Linear model adjustment and regression validity tests were performed in order to check regression equation signiicance.
Precision
The method precision was assessed on two levels: repeatability and intermediate precision. The method was tested for these two precision levels based on 6 de-terminations (ICH, 2005) at 20 mg.mL-1 concentrations.
Intermediate precision was determined on different days by different analysts. Repeatability was expressed by the coeficient of variation (CV), whereas intermediate pre-cision was expressed as CV and average reliance interval by Student’s t test (Ribani et al., 2004).
Accuracy
The method accuracy was assessed at three con-centration levels: 40, 100 and 160% for raw material, where 100% corresponded to 20 µg.mL-1. In tablets, the
evaluation was performed at concentrations of 70, 100 and 130%, which were incorporated into a given amount of placebo. The tests for both the raw material and tablets were conducted in sextuplicate for each concentration le-vel and were assessed using Student’s ttest by comparing results obtained against theoretical values deined for each analyzed concentration.
Selectivity
To determine selectivity, the analyte was compared to placebo solution, verifying that no interference exists between the formulation excipients in the analysis method (Swartz, Krull, 1998; Ribani et al., 2004).
RESULTS AND DISCUSSION
Analytical method development
Despite presenting similar characteristics and behavior, a signiicant difference in the mobile phase
holdup time using the C8 and C18, columns was
ob-served, being shorter in the latter. On the tests with a mobile phase, no signiicant difference was observed between the results obtained with the mobile phase aci-diied with orthophosphoric acid and the mobile phase without acidiication. However, the acidiied mobile phase provides for better separation of probable syn-thesis impurities from the efavirenz, reducing the risks of interaction with other peaks.
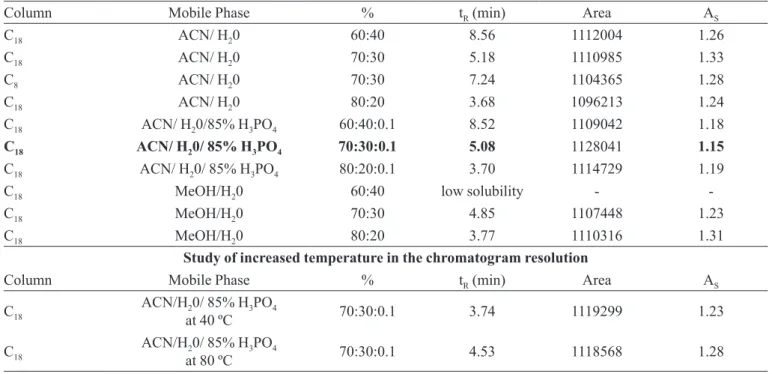
The mobile phase made up of methanol and water at a (60:40) proportion produced efavirenz precipitation inside the column, although good results were obtained at 70:30 and 80:20 proportions. The mobile phase cho-sen for analytical method validation consisted of ACN/ water/ 85% H3PO4 (70:30:0.1), presented a mobile phase
holdup time of 5.08 min, ease of manipulation, with good resolution and peak deinition in the chromatogram. Tests were performed using the mobile phase and column deined, with the efavirenz being submitted to tempera-tures of 40 ºC and 80 ºC to assess the analyte behavior under these conditions. There was no variation in the integration of peak areas obtained at these temperatures, where a reduction occurred only within the mobile phase holdup time, due to the reduced viscosity of the mobile phase (Table I).
Analytical method validation
Linearity
The linear regression equation obtained by the proposed method using three authentic calibration curves was, y = 56456.61x + 245.033, where y represents the in-tegrated peak area in the chromatogram, and x represents efavirenz concentration in µg.mL-1.
The correlation coefficient obtained of 0.99997 demonstrates the good quality of the calibration curve, as the lower the dispersion of the set of points, the lower the uncertainty of the estimated regression coeficients. Using variance analysis, the model validation and the statistical signiicance of the adjusted curve can be tested. The data variance analysis demonstrated that the method is linear within the tested concentration range (10-40 µg.mL-1), and
Robustness
The results for temperature robustness, mobile phase proportion, and acetonitrile supplier for the inished product dosage method, were statistically treated and are described in Table II. The method proved to be robust for the variations in the column temperature and mobile phase proportion assessed. The results of the variance analysis of Student’s t test for assessed parameters showed no sta-tistically signiicant difference between the variations in temperature and mobile phase proportion or the acetoni-trile manufacturers assessed, with a 95% reliance interval.
Precision: Finished Product
· Repeatability: Method repeatability can be
ob-served with a standard sampling deviation of 0.05% and a variation coeficient of 0.25%.
· Intermediate Precision:The intermediate
preci-sion results for the inished product showed the variation coeficient to be lower than 2% in all instances .On the significance tests assessing the method precision test
results for the coated tablets analyzed, no statistically sig-niicant differences among average values between days or between analysts was found. The calculated t was 0.53; 1.80; 2.04 and 0.16 for between analysts day 1; between analysts day 2; between days analyst 1 and between days analyst 2, respectively, with all values lower than the cri-tical t (2.23).
Accuracy
The results of the method accuracy study yielded a CV of 1.4; 0.61 and 0.53% for the theoretical concen-trations of 70, 100 and 130%, respectively. A statistical signiicance analysis was conducted using Student’s t test. The calculated t was 0.22; 1.04; 2.46 respectively, with all values lower than the critical t (2.57).
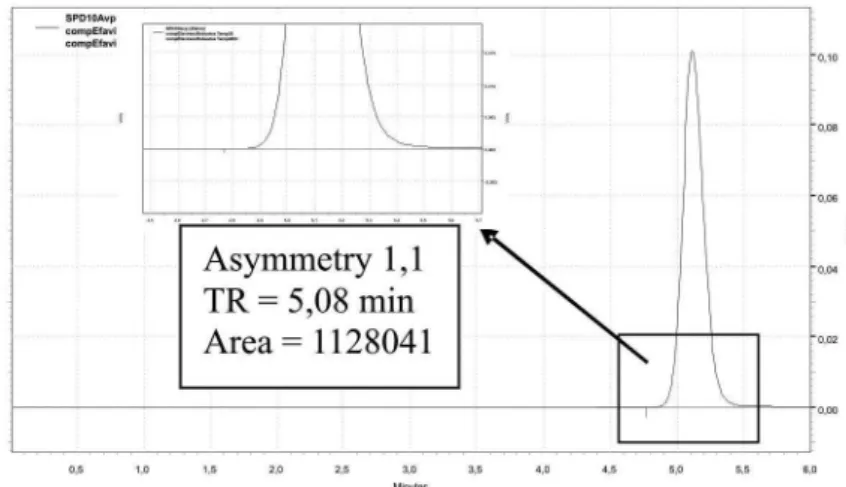
In Figure 1, an efavirenz chromatogram obtained under chromatographic conditions shows a single well-deined peak of efavirenz, with a 1.1 asymmetry. Based on the data observed from the method accuracy study, no statistically signiicant difference was found, with a 95% TABLE I - Composition deinition of the mobile phase and column for validation
Column Mobile Phase % tR (min) Area AS
C18 ACN/ H20 60:40 8.56 1112004 1.26
C18 ACN/ H20 70:30 5.18 1110985 1.33
C8 ACN/ H20 70:30 7.24 1104365 1.28
C18 ACN/ H20 80:20 3.68 1096213 1.24
C18 ACN/ H20/85% H3PO4 60:40:0.1 8.52 1109042 1.18
C18 ACN/ H20/ 85% H3PO4 70:30:0.1 5.08 1128041 1.15
C18 ACN/ H20/ 85% H3PO4 80:20:0.1 3.70 1114729 1.19
C18 MeOH/H20 60:40 low solubility -
-C18 MeOH/H20 70:30 4.85 1107448 1.23
C18 MeOH/H20 80:20 3.77 1110316 1.31
Study of increased temperature in the chromatogram resolution
Column Mobile Phase % tR (min) Area AS
C18 ACN/Hat 40 ºC20/ 85% H3PO4 70:30:0.1 3.74 1119299 1.23
C18 ACN/Hat 80 ºC20/ 85% H3PO4 70:30:0.1 4.53 1118568 1.28
TABLE II - Finished product statistical study
PARAMETERS F cal. P value F critical t cal. t critical
Temperature (ºC) 0.14 0.87 3.68 -
-Mobile phase (ACN/H20 acidif.) 3.37 0.06 3.68 -
reliance interval, between the obtained results and the deined theoretical values, showing that the method for determination of the efavirenz in tablets is accurate.
Selectivity
Comparison of the chromatograms obtained for the placebo solution and efavirenz tablets revealed no signii-cant interference of formulation excipients for the mobile phase holdup time of 5.08 min, using the same chroma-tographic conditions for both samples. Figure 2 depicts chromatograms of placebo and efavirenz tablets showing that the method is selective for the analyte concerned.
CONCLUSION
The method presented proved to be a straight-forward alternative assay for efavirenz raw material and ta-blets, being robust, linear, precise, accurate, and selective, with well-deined peak reproduction and good resolution. The method developed therefore represents an
alterna-FIGURE 1 - Representative chromatogram obtained with the method precision
FIGURE 2 – Efavirenz Tablet chromatogram obtained for selectivity parameter
tive method in the laboratory routine of pharmaceutical industries, particularly those developing and producing anti-retroviral medications. The results obtained showed that the method complies with good laboratory practice requirements and meets the validation criteria set forth in USP and ICH guidelines.
ACKNOWLEDGMENTS
This study was supported by a grant from Pernam-buco Federal University.
REFERENCES
CLERCQ, E. D. Antiviral drugs: current state of the art. J. Clin. Virol.,v.22, n.1, p.73-89, 2001.
MATTHEWS, C. Z.; WOOLF, E. J.; MAZENKO, R. S.; HADDIX-WIENER, H.; CHAVEZ-ENG, C. M.; CONSTANZER, M. L.; DOSS, G. A.; MATUSZEWSKI, B. K. Determination of efavirenz, a selective non-nucleoside reverse transcriptase inhibitor, in human plasma using HPLC with post-column photochemical derivatization and luorescence detection. J.Pharm. Biomed. Anal., v.28, n.5, p.925-934, 2002.
MONTGOMERY, E. R.; EDMANSON, A. L.; COOK, S. C.; HOVSEPIAN, P. K. Development and validation of a reverse-phase HPLC method for analysis of efavirenz and its related substances in the drug substance and in a capsule formulation. J. Pharm. Biomed. Anal., v.25, n.2, p.267-284, 2001.
RIBANI, M.; BOTTOLI, C. B. G.; COLLINS, C. H.; JARDIM, I. C. S. F. Validation in chromatographic and electrophoretic methods. Quim. Nova, v.27, n.5, p.771-780, 2004.
SARASA-NACENTA, M.; LÓPEZ-PÚA Y.; LÓPEZ-CORTÉS, L. F.; MALLOLAS, J.; GATELL, J. M.; CARNÉ, X. Determination of efavirenz in human plasma by high-performance liquid chromatography with ultraviolet detection. J. Chromatogr., B: Biomed. Sci. Appl., v.763, n.1/2, p.53-59, 2001.
SNYDER, L. R.; KIRKLAND, J. J.; GLAJCH, J. L. Practical
HPLC method development. 2.ed New York: Wiley, 1997. 765 p.
SWARTZ, M. E.; KRULL, I. S. Validação de métodos
cromatográicos. Pharm. Technol., v.2, n.3, p.12, 1998.
UNITED States Pharmacopoeia. 29.ed. Rockville: United States Pharmacopeial Convention, 2006. p.1567-1572.