ISSN online: 1807-1775
_____________________________________________________________________________________ Recebido em/Manuscript first received: 30/1/2007 Aprovado em/Manuscript accepted: 31/06/2007 Endereço para correspondência/ Address for correspondence
Jan Capek, is a Professor of Managerial Informatics at the Faculty of Economics and Administration, University of Pardubice, Pardubice, The Czech Republic, He is currently working as a dean of the Faculty. He received his CSc. degree (approx Ph.D.) at the Czech Technical University in Prague E-mail: capek@upce.cz
Robert Bata, is currently working as a Assistant Professor at the Faculty of Economics and Administration, University of Pardubice, Pardubice, The Czech Republic, He received his Ph.D. degree at the Faculty of Economics and Administration, University of Pardubice, Pardubice, E-mail: robert.bata@upce.cz
Institut of System Engineering and Informatics, Faculty of Economic and Administration, University of Pardubice, Studentska 95, 530 10 Pardubice
ISSN online: 1807-1775
WORKFLOW MODELLING WITHIN SELECTED
DEPARTMENTS OF THE PUBLIC ADMINISTRATION FOCUSED
ON THE REGIONAL OFFICE
Jan Capek
University of Pardubice, Pardubice, The Czech Republic
Robert Bata
University of Pardubice, Pardubice, The Czech Republic
_____________________________________________________________________________________
ABSTRACT
E-government means more likely transformation in nature, affecting the management of human, technological and organisational resources processes. Some authorities state that an integrated process model should make it easy to identify possible ways for improvement. Instruments like Petri-Nets can be suitable for partial solutions in public administration. The main advantages of Petri nets are their graphical notation, their simple semantics, and the rich theory for analyzing.
Keywords: Workflow modelling, Petri nets, public administration, e-government.
1 INTRODUCTION
of the United Nations indicated that in 2003, more than 173 countries had prepared government web sites. E-government is predicated on leveraging the capabilities and power of ICT to deliver services provided by governments at local, municipal, state and national levels. Beyond service delivery, e-government offers additional channels of interaction among governments, businesses, and citizens, separately or collectively (UN, 2003). However, e-government is more than a technical solution. It more likely means transformation in nature, affecting the management of human, technological, and organisational resources processes. In literature there is a number of different definitions of e-government. Some of them are rather narrow, focusing on using ICT, particularly the Internet, as e.g. “the use of technology to enhance the access to and delivery of government services to citizens, business partners and employees”, (Deloitte, 2004). Others view e-government more broadly like transformation of government as such. Examples can be:
¾ Electronic information-based services for citizens (e-service) with reinforcement of participatory elements (democracy) to achieve objectives of balanced e-government (Bertelsmann Foundation , 2001)
¾ The use of information and communication technologies, particularly the Internet, as a tool to achieve better government (OECD, 2003).
¾ The use of ICT in public administration combined with organisation changes and new skills, in order to improve public services and democratic processes and strengthen support to public policies. COM (2003).
¾ The use by the government of Web-based Internet applications and other ICTs, combined with processes that implement these technologies, to
1) enhance the access to and delivery of government information and
services to the public, other agencies, and to government entities; or 2) bring about improvements in government to operations that may include
effectiveness, efficiencies, service quality, or transformation” (US government, 2002).
These definitions may be useful in describing e-government in a broad-based manner, but don’t help follow some deeper issues and considerations relating to the construct, and fail to capture the more complex aspects of transforming government or acknowledging the role of the ICT elements.
Consequently, most implementation activity centres on service delivery dedicate little emphasis on real transformation of the services themselves or the processes associated with their delivery (Grant, Gerald and Chau, Derek, 2005).
The next claim ‘any conceptualization of e-government’ needs to address a variety of concerns beyond the service delivery elements. Based on a comprehensive literature review, they suggest this definition. In the work on eGovernment in the EU Commission, they focus on these overall objectives (COM, 2003):
• A public sector that is open and transparent, that is understandable and accountable to the citizens, and open to democratic involvement and scrutiny.
• A public sector that is at the service of all, being inclusive and exclude no one from its services.
• A productive public sector that delivers maximum value for taxpayer’s money.
institutions, citizens, businesses and civil society and thereby distinguishing between 3 different dimensions (Grønlund, 2002):
1) the democratic dimension, focusing on political processes and interaction between the constituents and the government,
2) the service dimension which comprises the delivery of all types of electronic services, and
3) the administrative dimension including various types of management work, internal routines etc. This may be illustrated in the following way (Thomas et al., 2004; Jansen, 2005) and we are focused on the e-service part:
Fig.1. Objective of the e-Government
2 GOVERNMENT PROCESSES MODELLING
Outstanding results of customer service orientation are the installation of call-centres, service pages, and the connection with quality management. But, the change in internal processes will not be easy since the state cannot exclusively focus on the customers’ needs and benefits. The internal workflow of public authorities is governed by a legal framework. Furthermore, there are hundreds of decrees for almost each administrative process. These decrees seldom contain any instruction about the output, but they usually regulate how to create a required one. The following aspects have to be taken into account as a result when modelling government processes (Wimmer, Traunmüller, 2003):
¾ Internal and external views on the workflows differ considerably. Public online services offered in portal solutions should use a customer oriented workflow; This is a perspective in which the state has little experience. Thus, current laws do rarely support efficient and effective workflows.
¾ E-Government modelling methods are called to respect the characteristics of public services. While most of the existing modelling methods were developed in order to optimize supply chains or production, the goals in the public administration are usually defined in a different way.
¾ The synchronisation of political and strategic perspectives is imported. Political influence and its dependency on election terms have to be understood and need to be well separated from the long term strategic perspective of modernizing the state’s processes.
Each of these aspects has to be analyzed individually for every country at a more detailed level. Laws and decrees are often the major barrier to re-engineering public workflows (Lenk, Traunmüller, Wimmer, 2002).
Each step of an administrative process has to be analyzed and, if necessary, modified (Lenk, Traunmüller, 1999). Another reason for neglecting process modelling is the fact that the main goal has been to offer information and communication online. This could be a good introduction but will not be enough to fulfill the high expectations in e-Government. To provide services at the transaction level, it is crucial to remodel public processes towards e-Government. A lot of methods exist for the modelling of business processes. Some of these methods are used to represent the processes embedded in major enterprise resource planning software (e.g. SAP R/3, ARIS...). In principle, these methods can be used to model government processes as well (Becker, 2004).
Some authorities have declared that an integrated process model should make it easy to identify possible ways for improvement. It should be easy to understand and hence to be accepted by the authorities. Highly formal modelling languages like Petri Nets or the Unified Modelling Language do not seem suitable for e-Government (Thomas et al., 2004). The modelling approach should be independent of the primary purposes (e.g. customers needs, higher efficiency, cost reduction, etc.) of the re-engineering efforts (Šimonová, Lešák, Kalhous, Vávra, 2007), (Šimonová, Naiman, Kopackova, Bilkova, Jonasova, 2007). But other authors have different opinions and experiences.
The Semantic Process Language (SPL) is a formal language suitable for the specification of process sets and their verification concerning process properties (Simon, 2006). It is a novel language based on Petri nets (Petri, 1962), (Reisig, 1986) – especially a variation of Petri nets called Workflow nets (Aalst, 2007) – and previous work on a Logic of Actions (Genrich, 1978; Lautenbach, Simon, 2000; Simon, 2002). Opposite to other formal languages, the meaning of the SPL words (which are called modules) is not defined by grammar but by building rules which take modules as input and synthesize a special class of Petri nets (called Module nets). Specific firing sequences of these nets are then interpreted as the (sequential) processes defined by a module.
problems of improving the quality of public processes which are discussed in this paper. Petri nets are a well-accepted formalism for modelling concurrent and distributed systems in various applications like Workflow management, embedded systems, production systems, or traffic control. The main advantages of Petri nets are their graphical notation, their simple semantics, and the rich theory for analyzing.
Petri net consist of the places p denoted as ○, transitions t denoted as ▬▬ and directed arcs (connections) denoted as →.
3 OUR APPROACH
We have focused our research on E-services (see fig. 1). The elaborate information flow model is described in Figure 3. Individual symbols represent the pages of applications that go through the modelled department. Initial place is the transition t1,
generating the processes (in this case it is the pages of incoming documents) into the system. Place p1 serves as a “waiting room” of the documents to be further processed.
Transition places t2 – t7 withdraw the delivered documents. The transition places
represent the moment of a document assignment to the appropriate department. Transition performance is determined by the probability of 16.6%. This value is determined by the number of departments of the appropriate division and will be different at the divisions with different number of subdepartments. The model describes the Department of environment and agriculture of the Regional Office of Pardubice with 6 subdepartments, therefore the value reaches 100/6=16.666.
An essential prerequisite is equal load of all the departments, which corresponds to the real state. Assignation of symbols to places p2 – p7 presents the moment of a
document processing. Transitions t14 – t19 and analogically t20 – t25 up to t44 – t49
demonstrate the moment when a department has finished processing an application and transferred it onto another one. Performance of the transitions is determined by the probabilities. The probabilities of the individual transitions performance are determined by a table of probabilities indicating the number of documents and the number of the involved departments. To provide for a document processing by an accurate number of departments, different colours are used to symbolize transitions t15 – t19, analogically at
t21 – t25…., t45 - t49. The colours correspond to the colour of an arc that comes out of the
appropriate transition. Therefore a symbol, with the probability of 15% (an application processed by one department) continues to p9, and with the probability of 85% to p8,
with an assigned colour. If a symbol gets through a transition t19, t25, t31, t37 or t49, the
colour orange is assigned and continues via p8 into one of the transitions t8 – t13.
Transitions t8 – t13 are of predicate type; the predicates prevent an application from
going into one department more than just once. Symbols go through one of the transitions p2, p3,…., p7, and via an orange arc they enter an appropriate transition and
from that places to the transitions t54, t59,….. t79 where the arc colour changes into
yellow. The symbol continues to p8, and further to t8 – t13 the same way. Analogically, it
goes through one of the places p2 – p7. The colour gradually changes from orange to
yellow, blue, green and red. The red colour symbol then continues, upon making an appropriate transition, into place p9 as a black colour symbol. Transitions t14 – t79 are of
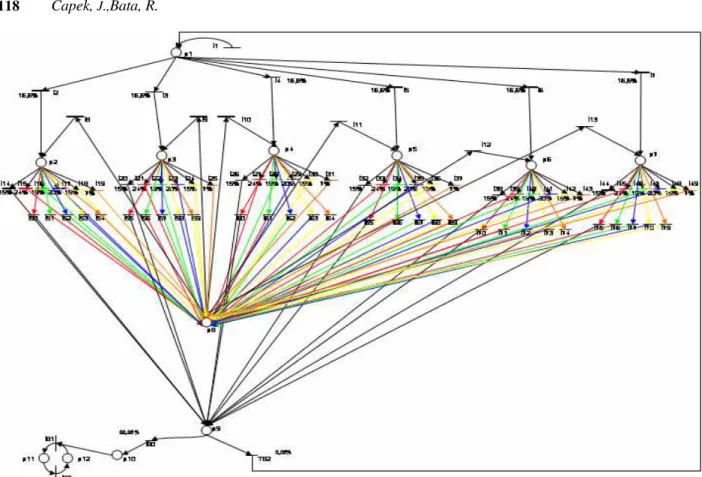
Fig. 2. The information flow model showed at a department level with the link to appropriate subdepartments.
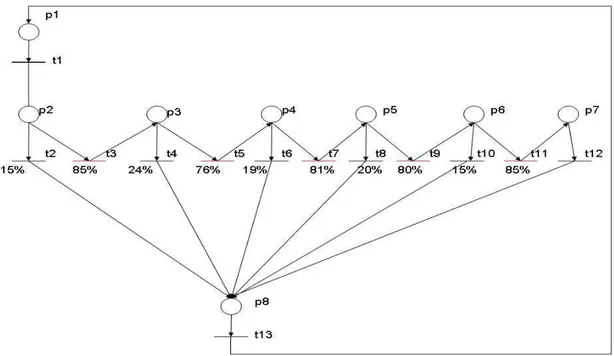
Fig. 3: Simplified model of the existing state of environmental information flows at the Regional Office
Table 3: Description of net in Fig. 3
p1 Application assigned to the
head of a department.
t1 Head of dpt. (assigns an
application to processing)
p2 First department t2 First dpt. processed the application
(one dpt. processes 15% of an application)
p3 Second department t3 Application transferred to second
dpt. (100 – 15 =85).
p4 Third department t4 Second dpt. processed the
application
(24% of an application processed by two dpts.).
p5 Fourth department t5 Application transferred onto third
dpt. (100 – 24 = 76).
p6 Fifth department t6 Third dpt. processed the application
(19% of an application processed by three dpts.)
p7 Sixth department t7 Application transferred onto the
fourth dpt. (100 – 19 = 81). p8 Processed application assigned
to the head of department
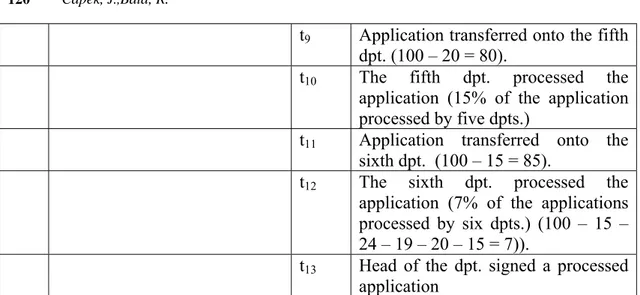
t8 The fourth dpt. processed the
t9 Application transferred onto the fifth
dpt. (100 – 20 = 80).
t10 The fifth dpt. processed the
application (15% of the application processed by five dpts.)
t11 Application transferred onto the
sixth dpt. (100 – 15 = 85).
t12 The sixth dpt. processed the
application (7% of the applications processed by six dpts.) (100 – 15 – 24 – 19 – 20 – 15 = 7)).
t13 Head of the dpt. signed a processed
application Resource: the authors
Transitions t2 - t7, are indicated in this model, or their equivalents, marking the
individual departments of the division of environment and agriculture of the Regional Office of Pardubice. Place p1 represents the department which was involved first; p2 is
the second in the given order, etc.
It is essential to integrate the time aspect, so that the model really describes the course of an application being processed by a monitored department. The performance of transitions t2, t4, t6, t8, t10 and t12 must be determined by the time of processing. The
appropriate values are then adjusted to the requirements of a given environment in which the model was applied. The given model is sufficiently simplified to be easily transferred into software tools and further processed.
The simplified model indicated in Fig. 3, implemented by means of the HPSim programme and graphically expressed in its environment is in Fig. 4
agriculture in the HPSim environment.
The simulation results could be exported from HPSim into MS Excel via an output file for further processing. The simulation starts with the initial marking of 15 tokens in p2 and 0 in other places. A first step of simulation represents abnormal
conditions until a queue of tokens in p7 – p11 is reached for each department. Every
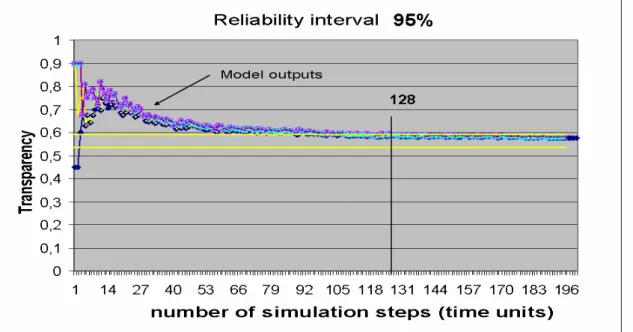
simulation step is in progress in time. To define reliability of simulation results it is necessary to determinate how many steps of simulation must be effected. The required number of simulation steps and the 95% reliability interval per 128 time units were determined experimentally for this model. The accuracy of the results and the reliability interval are indicated in Fig. 5. Simulations, however, were carried out for a higher number of steps, due to a better comparability of the model outcomes with the empirical data.
Fig. 5: Reliability interval
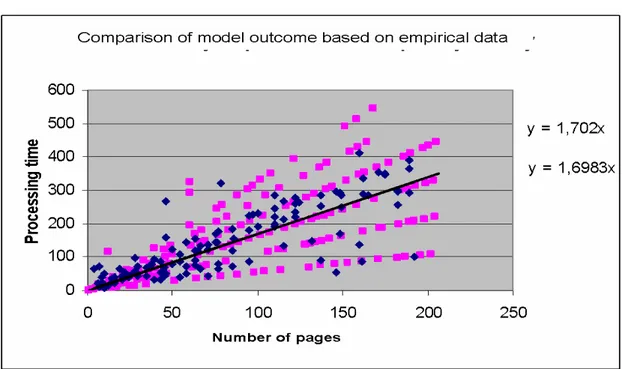
Fig. 6: Graphic comparison of model outcome in the HPSim programme based on empirical data.
The graph lists the trend-connections equations. The first equation at the top belongs to the empirical data, the second to the model outcome. Line 1 (purple points) describes the model outcome, line 2 (blue points) describes the empirical data. As the trend connections show, the model successfully reflects the real state. Both lines are almost parallel, the modelled data deviation is very small; it is propably caused by a small number of check up data. The comparison of the empirical data with the modelled values demonstrates that the model reflects the real state with sufficient accuracy. The figure clearly shows that the model respects the distribution of empirically collected data, which grows with the increasing number of pages in an application. Such distribution increase complies with the assumptions about the application processing procedure.
The transparency calculated from a simplified model of the existing state for 492 simulation steps at 0.568 pages/day can be, in relation with the 95% reliability interval, interpreted as a value deviating from the real value by ± 0,000284 pages/day. The 492 simulation steps have matched in this event for 3 years. Such an exactness for use in public administration is more than necessary, because the interpretation of this value can be, that the model can calculate with exactness ± 0,5 letter for one page as well. But this exactness will be reached with only 128 simulation steps, what represents 9,3 months. So that can be the model used for calculations in relatively short time periods with very good results.
4 CONCLUSIONS AND FUTURE WORKS
The results of our experiments show that the model successfully reflects the real state. Both lines (purple and blue) are almost parallel.indicating that the modelled data deviation is very small. It is probably caused by a small number of check up data.
The figure clearly shows that the model respects the distribution of empirically collected data, which grows with the increasing number of pages in an application. Such distribution increase complies with the assumptions about the application processing procedure.
The simulation models converge in a relatively fast manner to the stable points and, from the exactness point of view for the application within the public administration offices, it is more than sufficient.
This model will have to be improved, in the future, taking in the account time outgoings for necessary internal processes.
5 BIBLIOGRAPHY
AALST, W. M. P., van der. The Application of Petri Nets to Workflow Managemen [on line]. 1998 [05.01.2007]. < http://is.tm.tue.nl/staff/wvdaalst/publications/p53.pdf>.
BECKER, J. et all. Prozessorientierte Reorganisation in öffentlichen Verwaltungen –
Erfahrungen bei der Anwendung eines Referenzmodells, MobIS [on line]. 2004
[04.06.2004] <http://kom.wi-inf.uni-essen.de/mkwi04/teilkonferenzen _detail.htm>
BERTELSMANN FOUNDATION. Balanced e-government – Connecting efficient
administration and responsive democracy [on line]. 2001 [5.2.2001]
http://en.bertelsmann-stiftung.de/index.html.
COM Communication from the Commission to the Council [on line]. 2003 [5.12.2003]
http://europa.eu.int/information_society/eeurope/2005/doc/all_about/egov_ communication_en.pdf.
DELOITTE RESEARCH PUBLIC SECTOR INSTITUTE. At the dawn of
e-government. The citizens as customer [on line]. 2004 [04.06.2004]
http://www.deloitte.com/dtt/article/0,1002,sid%253D37085%2526cid%253D60672,00. html.
GRANT, GERALD AND CHAU, DEREK. Developing a Generic Framework for E-Government. Journal of Global Information Management [on line]. , 13(1), 1-30, Jan-March 2005.http://www.igi-online.com/downloads/pdf/ITJ2725_dGLKgMR9SK.pdf .
GENRICH, H.. Ein Kalkül des Planens und Handelns. In: Ansätze zur
Organisationstheorie rechnergestützter Informationssysteme. Oldenbourg Verlag, 1978. GMD Bericht 111, pp. 77-92.
GRØNLUND, Å. Eds. (2002) Electronic Government: Design Visions and
Management. 1st printing, 2002. Idea Group Publishing, 2002. 388 pages. ISBN: 1-930708-19-x.
Koblenz: Universität Koblenz-Landau. 2000. p 19-24.
LENK, K.; TRAUNMÜLLER, R.; WIMMER, M.: The Significance of Law and Knowledge for Electronic Government. In: Grönlund (Ed.) Electronic Government – Design, Applications and Management. New York: Idea Group Publishing. 2002. p. 61-77.
LENK, K.; TRAUNMÜLLER, R.: Öffentliche Verwaltung und Informationstechnik –
Perspektiven einer radikalen Neugestaltung der öffentlichen Verwaltung mit Informationstechnik, Verwaltungsinformatik Nr. 20. 1. printing. Heidelberg: Marcel Decker Verlag, 1999.
OECD. The case of e-government: Experts from the OECD Report “The E-government imperative.” OECD Journal on Budgeting. 2003, 3(1) p. 62-96. ISSN 1608-7143.
Thomas O., et. al. EPK-Referenzmodelle für Verwaltungsverfahren. In: M. Nüttgens, F. Rump (Hrsg.) EPK 2004 – Geschäftsprozessmanagement mit Ereignisgesteuerten Prozessketten, 3. Workshop der Gesellschaft für Informatik e.V. Luxemburg: Institut für Wirtschaftsinformatik, 2004. p.39-54.
PETRI, C. A. Kommunikation mit Automaten, Schriften des Institutes für instrumentelle Mathematik. Bonn. 1962.
REISIG, W. Petrinetze: eine Einführung, 2. printing. Berlin: Springer-Verlag 1986. ISBN 3-540-16622-X.
SIMON, C. A Logic of Actions to Specify and Verify Process Requirements. In: The
Seventh Australian Workshop on Requirements Engineering. Melbourne, Australia:
AWRE 2002.
SIMON, C. Integration of Planning and Production Processes, Mathmod 2006, Special Session: "Petrinets: Current Research Topics and their Application in Traffic Safety and Automation Engineering", Wien, Österreich, (accepted).
UN. UN Global E-government Survey [on line]. c2003 [08.12.2003].
http://unpan1.un.org/intradoc/groups/public/documents/UN/UNPAN016066.pdf .
US GOVERNMENT. The e-government act of 2002. HR 2458 [on line]. 2002.
http://csrc.nist.gov/policies/HR2458-final.pdf.
WIMMER, M.; TRAUNMÜLLER, R. Geschäftsprozessmodellierung in e-Government:
eine Zwischenbilanz, eGov days 2003 Arbeitskreis Organisation [on line]. 2003.
http://falcon.ifs.uni-linz.ac.at/eGovProzessmodellierung/wimmer_traunmueller.pdf (20-10-2004).
ŠIMONOVÁ, S., NAIMAN, K., KOPACKOVA, H., BILKOVA, R., JONASOVA, H.
Easy Business Intellingence Tools for Data Analysis. In Transactions on
Communications. Venice: WSEAS-Press, 2007. Issue 1, Volume 6, January 2007. ISSN 1109-2742, p. 250-255.