* Associate Professor, Escola Politécnica da Universidade de São Paulo, Departamento de Engenharia de Transportes. Av. Prof. Luciano Gualberto, travessa 3, n.380 – Cidade Universitária. 05508-900 São Paulo – SP – Brasil. [email protected]
** Full Professor, Faculdade de Filosofia e Ciências Humanas, Departamento de História, Universidade Federal de Minas Gerais (UFMG). Av. Antônio Carlos, 6627, Caixa Postal 253 – Pampulha. 31270-901 Belo Horizonte – MG – Brasil. [email protected]
Méridionale
: a comparative Amazonian
cartography in perspective
Jorge Pimentel Cintra* Júnia Ferreira Furtado**Resumo
O artigo analisa do ponto de vista da cartografia comparada alguns mapas da região amazônica, de meados do século XVIII, tendo como eixo a Carte de l’Amérique Méridionale, de 1748, de au-toria de Bourguignon D’Anville, cartó-grafo francês que trabalhou com o em-baixador português dom Luís da Cunha, visando a produção de um mapa que servisse de base para as negociações do Tratado de Madri. O documento é cote-jado com um mapa atual, com o mapa resultante da expedição de La Condami-ne (1744, desenhado por D’Anville), e com o chamado Mapa das Cortes (Lis-boa, 1749), produzido sob os auspícios de Alexandre de Gusmão, o documento efetivamente utilizado para subsidiar as negociações desse Tratado de 1750 que efetuou a partilha da América setentrio-nal. Conjuga-se uma análise da política diplomática europeia com um
rastrea-Abstract
divi-In the 1720s when he served in Paris, the Portuguese ambassador Dom Luís da Cunha first became close to the young French geographer Jean-Baptiste Bourguignon D’Anville, contracting him for the service of the Portuguese crown.1 Two decades later, the two worked together in the production of a
general map of South America entitled Carte de l’Amérique Méridionale, dating from 1748, which presented a draft of the new frontiers to be established between the crowns of Portugal and Spain in the Americas. For this task the ambassador provided D’Anville with the documents he had at the time and which became fundamental for the geographer to establish the morphology of the interior of Brazil.2 D’Anville was a cabinet geographer, as all his extensive
cartographic work (more than 211 manuscript and printed maps are attributed to him, as well as 23 works about geography) was produced in his atelier in Paris. He thus need plenty of documentation which when analyzed and submitted to the force of his criticism would result in a synthesized cartographic document of his authorship.3
A first version of Carte de l’Amérique Méridionale, dating from 1737, is a manuscript and very simple, as well as being in a reduced size, having been made for the private use of the Duc d’Orleans.4 There is another version, very
similar to this, also in manuscript, but without a precise date and without a dedication.5 The most thorough and most complete version was printed for
the first time in 1748. This first version was altered afterward in some aspects, and was reprinted on successive occasions, without however altering the date
mento das fontes cartográficas, confir-mado pela cartografia digital.
Palavras-chave: história da cartografia; análise cartográfica; Jean Baptiste Bour-guignon D’Anville; La Condamine; Mapa das Cortes; dom Luís da Cunha.
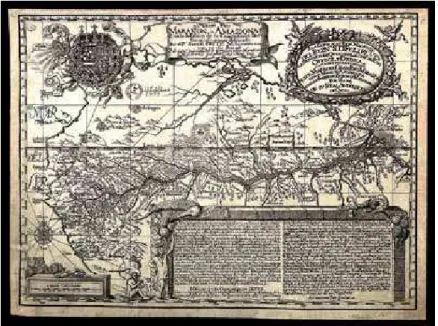
of the chart. For the effects of this study the manuscript version, used to the produce the first printing, will be analyzed.6 Due to the complexity and
extension of the map, D’Anville divided it into three sheets, from north to south, corresponding to three separate pages, in which the first represents South America between the parallels of latitude 13º a -10º (Figure 1); the second from -10º to -35º, and the third from -35º to -55º. In degrees of longitude, referring to the meridian of Ferro Island, the map varies from -17º to -63º. Each of the three pages is 41 cm high (with a width of 76.5 cm), which means that the entire map is 1 meter 23 cm high.
Dom Luís da Cunha and D’Anville, who shared the enlightened vision that maps should be perfect mirrors of the territory presented, intended to realize the most precise map of South America produced until then. In this case a perfect mathematical correspondence between the map and the real space was what they aimed to achieve, since geometry was supposed to measure the relationship between territory and its cartographic representation. Despite this intention, it cannot be forgotten that every map is a representation of the territory and needs to be analyzed as such.7 An initial objective of this article
is to verify the degree of precision effectively achieved on the map, using statistics and digital cartography methods. For this we used Page 1 of Carte de l’Amérique Méridionale, which corresponds to the Amazon region, comparing
Figure 1 – Carte de l’Amérique Méridionale, Jean-Baptiste Bourguignon D’Anville, 1748, Page 1
the measurements of latitude and longitude of 56 geographic points chosen on it with measurements taken from current maps.8 It is also interesting to
investigate the maps that served as a source for the production of this part of Carte de l’Amérique Méridionale, and like this served as a source for other maps. This research sought to interlink historic clues and sources with the comparative cartographic analysis to detect process of copying the of use of information and morphology.
Dom Luís da Cunha hoped that the Carte de l’Amérique Méridionale would be used for the diplomatic negotiations over the frontier then underway between Portugal and Spain. For this reason the map shows the frontiers of the different nations on the continent in distinct colors. In addition, in 1747 Dom Luís sent a preliminary version to Count of Vila Nova de Cerveira, the Portuguese ambassador in Madrid, where the first negotiations between the two Iberian crowns about their borders in America had started.9 However, orders
came from Portugal, directly from the pen of the secretary of the king, Alexandre de Gusmão, telling Cerveira not to show the Spanish the maps he possessed, including the one provided by Dom Luís da Cunha. He was told that a new map was being prepared in Portugal, in which the frontiers would present the real interests of the crown. In December 1748, Cerveira was advised that the “general map promised to Your Excellency and which would be enough to demonstrate everything is still not finished.”10 After it was completed, this map was sent, and
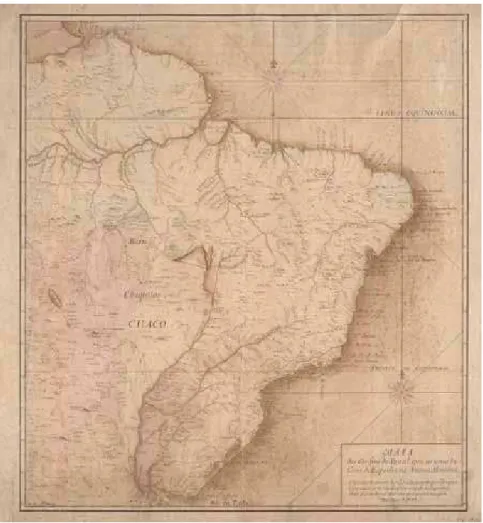
it was this one which served as the basis for the 1750 Treaty of Madrid. Entitled Mapa dos Conins do Brasil com as terras da Coroa de Espanha na América, produced in 1749, it was drafted in Lisbon under the auspices of Alexandre de Gusmão, and became known as Mapa das Cortes (Figure 2).11
One of the questions which still mobilizes the Historiography are the cartographic sources used to draft Mapa das Cortes, imprecisely cited by Alexandre de Gusmão.12 To clarify this point, it is also an aim of this article to
highlight the proximities between this map and Carte de l’Amérique Méridionale, investigating if the latter served as a source for the former, despite Alexandre de Gusmão prohibition of showing D’Anville’s map to the Spanish. Although this was not known until now, it actually occurred and certainty of this can be found by observing the correspondence between the two documents in the configuration of the basins of the Rupunuwini, Essequebé and Negro rivers, which appear in Page 1 of Carte de l’Amérique Méridionale, and the same section of Mapa das Cortes.13 This form of the representation of the hydrography
drawn by a Prussian called Horstman,14 who had traveled from Cayenne using
the Amazonian hydrography. This manuscript was given to him by the French savant Charles Marie de La Condamine, who had met Horstman in Belém, and served for D’Anville to propose a near connection (a beaching) between the Amazon, Negro and Essequebé.15
La Condamine was one of the participants in the 1735 Franco-Spanish geodesic expedition near Quito, which had the objective of measuring a
meridian close to the Equator in order to elucidate the shape of the earth.16 In
his return voyage to Europe, the French scholar descended the Amazon River, intending to be responsible for the most perfect understanding of the route of the river made until then.17 On his arrival, he published a report of his
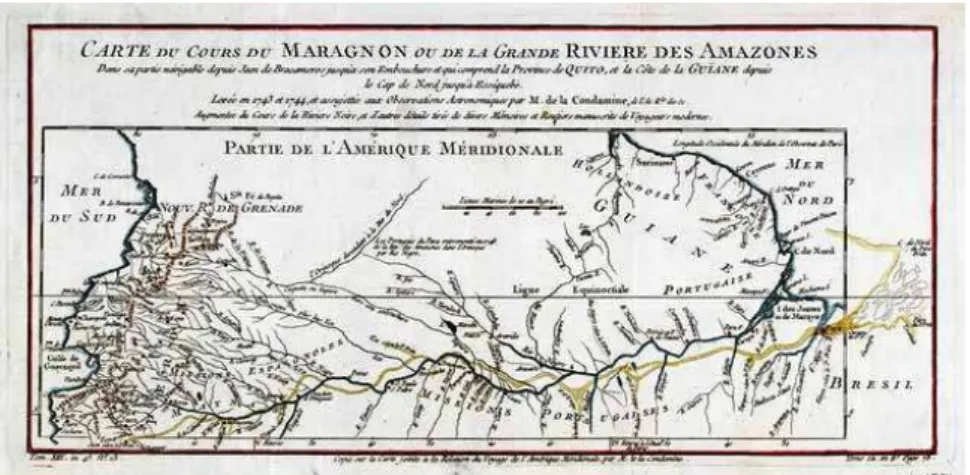
achievements and in 1744 D’Anville draw a map of the river to accompany this publication entitled Carte du cours du Maragnon ou de la grande riviere des Amazonas (Figure 3),18 according to the observations made by La Condamine.
In French the verbs lever and dresser made a distinction between surveying the land and drawing the map, a division of tasks very common to desk based cartography at that time.19 In the case of Carte du cours du Maragnon, the first
task was carried out by La Condamine and the second by D’Anville. After La Condamine’s survey, D’Anville was responsible for drawing the map. In the cabinet geography of that time drawing a map also signified gathering and concatenating a series of data, both the direct observations of land as the ones made by La Condamine, based on astronomic measurements he made when descending the river between 1743 and 1744, and a series of other documents, maps and reports as the ones he had collected during the journey. In the preface of his book, the French traveler said that these documents were “communicated in the country by various missionaries or intelligent travelers,” and that D’Anville, “whose skills are recognized,” was responsible, using his
Figure 3 – Carte du cours du Maragnon ou de la grande riviere des Amazonas, La Condamine and D’Anville
critical cartographic method, for “concatenating and writing these sparse materials.” 20
Another objective of this article is, thus, to verify the similarities and differences between Carte du cours du Maragnon and Carte de l’Amérique Méridionale and to verify to which extent the former served as a source to establish the Andean and Amazonian regions, which appeared in Page 1 of the latter. It is of interest to us to also investigate if these two maps, in turn, served as sources for the preparation of the Mapa das Cortes. In this paper, using digital cartographic resources and statistics, the three maps are compared for the effects of verifying concordances and dissonances between them in the establishment of various geographic coordinates in the northern region of Brazil. In the case of Carte de l’Amérique Méridionale the conclusions obtained will be collated with the writings of D’Anville about the process of its production.
Page 1 of D’Anville’s
Carte de l’Amérique Méridionale
To comparatively examine various geographic points in the north of Brazil included in Page 1 of D’Anville’s Carte de l’Amérique Méridionale and later in the others (Carte du cours du Maragnon and Mapa das Cortes), the process starts with the registration of this map in a digital cartography program, in this case MapInfo®. The first operation, called registration or geo-referencing, consists of choosing well defined points and providing the program with their coordinates. After this the program identifies the coordinates of the point which the cursor is at and allows its extraction and recording. In this operation the network of coordinates provided by D’Anville’s map was used. Its meridian of origin is Le Prémier Méridian, in other words Ferro’s meridian, established in 1634 in the reign of Louis XIII, and used frequently in French maps since that date.
Following this, first control sample 56 points that were well defined on D’Anville’s map were picked, corresponding to the basin of the Amazon river from Jaén de Bracamoros to Belém, and along the coast of the North Sea (Atlantic), from Marajó Island to Paramaribo. In these sections La Condamine had measured longitude and latitude, as appeared in his travel report.21 The
coordinates of the same points (latitude and longitude) were also obtained from current maps22 and exported to a spreadsheet, in this case Excel. With the
longitudes were converted from their origin (Ferro’s meridian) to Greenwich, using the following formula:
lg = lf + 18,1° (Equation 1)
In this equation:
lg – Longitude of the point in relation to Greenwich
lf – Longitude of the same point taken from the map, and thus in relation to Ferro’s meridian
18.1º – Constant to be added
In relation to this formula two observations can be made. The first is to the plus sign (and not minus) because D’Anville, to the contrary of what was conventional for Ferro’s meridian, counted the positive longitudes increasing to the west, and not from 0º to 360º to the east. After obtaining the longitude value the negative sign is added to obey the current convention (negative to the West of Greenwich). The second observation refers to the constant 18.1º: it corresponds to longitude of Ferro meridian in relation to Greenwich and can be obtained from good maps, even though many works adopted 17º38’ (17.6º) due to the influence of the value provided imprecisely by an authorized work.23
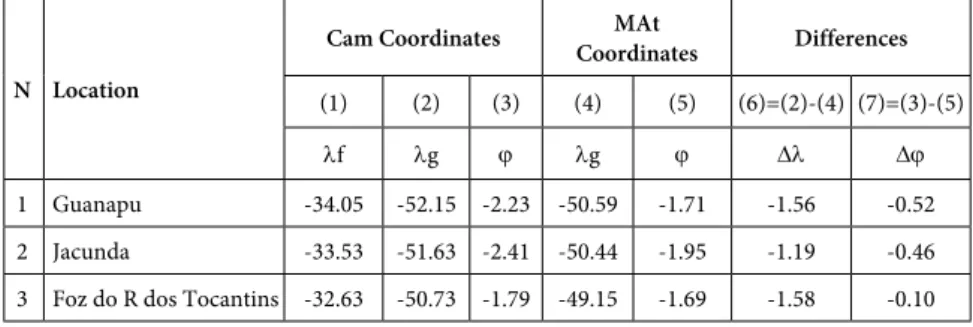
Table 1 provides the results of these calculations. Columns (1) and (3) contain for the various points highlighted the data obtained from Carte de l’Amérique Méridionale, from D’Anville, and columns (4) and (5), from current maps; column (2) comes from Equation 1, and columns (6) and (7) are the differences between columns (2)-(4) and (3)-(5), respectively, calculated in the spreadsheet.
Table 1 – Latitudes (j) and Longitudes (l), in decimal degrees, from Carte de l’Amérique Méridionale (CAm), from D’Anville,
compared with the values of Current Maps (MAt)
N Location
Cam Coordinates MAt
Coordinates Differences
(1) (2) (3) (4) (5) (6)=(2)-(4) (7)=(3)-(5)
35 Yupurá 2 -48.16 -66.26 -3.17 -64.80 -3.17 -1.46 0.00 36 Yuruá -48.94 -67.04 -2.65 -65.73 -2.61 -1.31 -0.04 37 Yutaí -49.86 -67.96 -2.66 -66.95 -2.73 -1.01 0.07 38 Içá -50.76 -68.86 -3.23 -67.96 -3.13 -0.90 -0.10 39 S. Paulo de Omaguas -51.80 -69.90 -3.54 -68.79 -3.46 -1.11 -0.08 40 S. Pedro -52.00 -70.10 -3.70 -69.38 -3.76 -0.72 0.06 41 Yahuavari -52.22 -70.32 -3.97 -70.00 -4.36 -0.32 0.40 42 S. Ignacio de Pevas -53.55 -71.65 -3.44 -71.83 -3.15 0.18 -0.29 43 Napo -54.16 -72.26 -3.46 -72.68 -3.39 0.43 -0.07 44 Nanay -54.63 -72.73 -3.98 -73.22 -3.78 0.49 -0.20 45 S. Ioachim de Omaguas -54.78 -72.88 -4.22 -73.28 -4.17 0.40 -0.05 46 Ucayale -55.05 -73.15 -4.39 -73.44 -4.50 0.29 0.11 47 Tigre -55.73 -73.83 -4.50 -74.06 -4.41 0.23 -0.09 48 Samiria -56.06 -74.16 -4.75 -74.28 -4.72 0.12 -0.03 49 Chambira -56.50 -74.60 -4.65 -74.83 -4.44 0.23 -0.21 50 Gualaga (Laguna) -57.47 -75.57 -5.03 -75.56 -5.28 -0.01 0.25 51 Pastaza -57.96 -76.06 -4.89 -76.41 -4.89 0.35 0.00 52 Marona -58.42 -76.52 -4.69 -77.06 -4.72 0.54 0.03 53 Borja -59.01 -77.11 -4.48 -77.53 -4.41 0.42 -0.07 54 Jaén de Bracamoros -60.69 -78.79 -5.48 -78.61 -5.73 -0.18 0.24 55 Cuenca -60.94 -79.04 -2.86 -78.97 -2.92 -0.07 0.06 56 Quito -60.43 -78.53 -0.22 -78.49 -0.27 -0.05 0.05
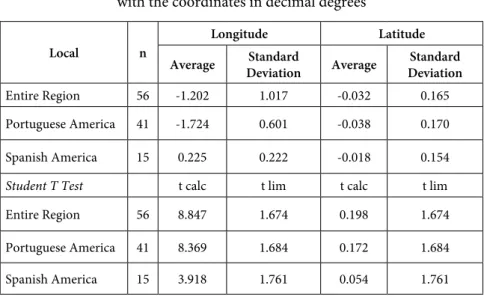
Table 2 – Summary of statistical parameters, with the coordinates in decimal degrees
Local n
Longitude Latitude
Average Standard
Deviation Average
Standard Deviation
Entire Region 56 -1.202 1.017 -0.032 0.165
Portuguese America 41 -1.724 0.601 -0.038 0.170
Spanish America 15 0.225 0.222 -0.018 0.154
Student T Test t calc t lim t calc t lim
Entire Region 56 8.847 1.674 0.198 1.674
Portuguese America 41 8.369 1.684 0.172 1.684
Spanish America 15 3.918 1.761 0.054 1.761
To read and interpret Table 2 it has to be understood that the value of the standard deviation is a measure of the precision of the historic map compared with a current map that it is supposed has the most precise mathematical correspondence in relation to the territory it represents. The average corresponds to the value of a possible systematic deviation, which is confirmed or rejected through the statistical Student T Test,24 presented in the second part
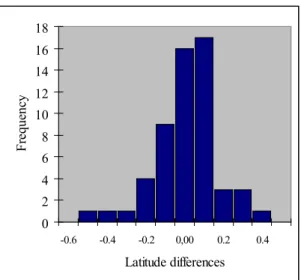
of the table, both for longitude and latitude. For the entire region (56 points) in relation to longitudes, the average (-1.202º) corresponds to a systematic deviation, since the T value calculated is 8.847, which is greater than the limit T value of 1.674 (value obtained from the statistical table for this test, with 56 points and a confidence level of 95%). In latitude the deviation is much lower (-0.032º) and does not correspond to a systematic deviation, since the T calculated (0.198) is lower than the limit (1.674). In turn, the standard deviation corresponds to the precision of the coordinates: 1.017º in longitude and 0.165º in latitude.
0 2 4 6 8 10 12 14 16 18
-0.6 -0.4 -0.2 0,00 0.2 0.4
Latitude differences
F
re
q
u
en
cy
Figure 4 – Histogram of latitude frequencies
Analyzing Table 1 together with the histograms in Figures 4 and 5, a number of conclusions are possible. In latitude there are two divergent points, specifically the first two, Guanapu (0.52º of difference) and Jacunda (0.46º of difference), in which the value is located at an average distance more than three times the standard deviation. These deviations can also be visualized in Figure 4, observing the first two frequency bars, counting from the left, which correspond to the two points located in the south of Marajó Island, whose form, even in a visual analysis of the map, is clearly elongated in the north-south direction, which also occurs in Carte du cours du Maragnon and Mapa das Cortes.
These deviations25 in latitude in Carte de l’Amérique Méridionale are
with a large amount of land, instead of a group of smaller islands.26 During
these incursions he not only established various measures of distance, but also obtained the latitudes of various points and produced a manuscript cartography which highlighted various numbered intervals, indicating the points where the observations were made. The D’Anville collection holds not only the original from the pen of La Condamine of the northern section of Marajó island, but a colored copy, made by the geographer himself, of the southern part, between Yaraoubi and Anajaheba.27 D’Anville also possessed fragments of chapter of a
travel diary, with geographic notes and observations from the mouth of the Amazon, entitled De l’entré du Pará. Copied in his own handwriting, the texts have no clear authorship, but everything indicates they are also from the pen of La Condamine.28 Why, having so many of La Condamine’s documents about
the region and drawing on them, did D’Anville alter the latitude measurements for the Southern part of Marajó island? In one of the memorials he wrote about the production process of Carte de l’Amérique Méridionale,29 states that in
relation to the mouth of the Amazon, he also used a manuscript map from Fr. Inácio Reis (Anville, Premiere Lettre..., p.555). The priest was a Mercedarian “who had spent 12 years on the banks of the river” Amazon. D’Anville found it in the house of Portuguese man, a friend of Dom Luís da Cunha, who lived in Paris.30 After this meeting, which occurred in 1729, according to the
instructions and memorials which the priest had provided him, he drew some
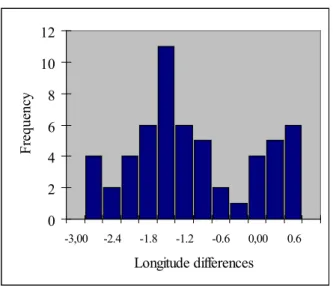
0 2 4 6 8 10 12
-3,00 -2.4 -1.8 -1.2 -0.6 0,00 0.6
Longitude differences
F
re
q
u
en
cy
drafts of the parts of the Amazon and its tributaries and a manuscript map of the river mouth, even publishing this map, printed in 1729, entitled Carte particuliere du cours de la rivière des Amazones ou de Maragnon. The non-use of La Condamine’s data in this region points to the use of information obtained from this priest and perhaps also from a map of Tocantins, as will be seen below. Nevertheless, this abandonment reduced the precision of the map in these points and there resides the challenge to understand this decision.
In relation to longitudes, presented in Table 1 and visualized in Figure 5, it can be noted that the deviations between Carte de l’Amérique Méridionale and current maps are relatively large. For example in Belém do Pará the deviation is 1.6º, and increases until it reaches high values of 2º or more between the Xingu River and Caloa; afterwards it decreases, reaching low values in Spanish territory, until it falls to almost zero in the region of Cuenca, where La Condamine, Bouguer, Goudin and Maldonado, participants in a Franco-Spanish expedition for measuring the meridian arc near the Equator, had made their observations.
have their internal coherence, about which there will be more considerations below. Mathematical cartography thus provides some clues for later analyses.
Comparative perspective of the Amazon River channel in
Carte du cours du Maragnon and Carte de l’Amérique
Méridionale
As has already been stated, D’Anville was a cabinet geographer, who analyzed his sources and pondered their value before putting them into his synthesized map, having developed a very particular and sophisticated system for criticizing the sources he used (Furtado, in print, Chapter. 4). In the text in the legend of Carte de l’Amérique Méridionale, he acknowledges that he was in debt to the participants in the Franco-Spanish mission. He especially thanks La Condamine, especially in relation to the establishment of the course of the Amazon river and its tributaries.31 Actually the latter had descended this caudal,
from Jaén de Bracamoros, the beginning of the navigable section, to Pará, or Santa Maria de Belém do Grão Pará,32 and both had worked together on the
production of Carte du cours du Maragnon.
To observe the degree of influence that the shape La Condamine attributed to the course of the Amazon had on the position that D’Anville gave to this river in Carte de l Amérique Méridionale, a comparative study, using the same digital cartography methodology, was made of the two maps, especially Page 1, which contains all of the region mapped in Carte du cours du Maragnon. In addition to the Amazon, Carte du cours du Maragnon presents part of the northern coast of South America, nowadays where French Guiana, Suriname (the old Dutch Guiana) and Amapá are located. These lands included what was then called the North Cape, disputed by Portugal and France, and Suriname, and extended from the north of Marajó island to the mouth of the Essequebé River. In Carte du cours du Maragnon, the basins of the Rupunuwini, Essequebé and Negro rivers have the same configuration as Horstman’s map, which, as has been stated, was also reproduced in the first print version of Carte de l Amérique Méridionale in 1748. Another important characteristic of the morphology of the hydrography in Carte du cours du Maragnon was the establishment of a connection between the Amazon and the Orenoco, made through the Negro River, a connection defended by La Condamine,33 which
du Maragnon nor the latter are based solely on the direct observations of La Condamine, since the French traveler did not go to all the tributaries of the Amazon. Therefore, to cover the entire Amazonian channel, both maps had to use other sources, as was the case of the already mentioned map by Horstman, but also “various memorials, journals and notes,” many brought by the traveler himself (La Condamine, 1984[1745], p.34).
One of his sources was the map of Fr. Fritz, who had been a missionary at the service of the Spanish among the Omagua and Maina Indians, and had made many journeys through the Amazon region (1686-1725). In one of these he descended the river until close to its mouth in the city of Belém do Pará. He produced a diary or manuscript report about the experience that he accumulated, which was used by another Jesuit, Padre Pablo Maroni, as the basis of his Noticias Autenticas del Famoso Rio Marañon. La Condamine brought a copy of this diary when he returned to Paris.35 With the purpose of
defending the dominion of Spain in the region, Fritz drew various maps of the area, but only very few have come to us. One of them, dated 1691 and entitled Mapa Geographica del Rio Marañon o Amazonas, was also brought to Europe by La Condamine. This version possessed a legend with a geographic description of the river and its inhabitants. Another, a little different, was engraved in Quito, in the Jesuit College in 1707, and with small modifications was incorporated in the edition of Volume 12 of Lettres édiiantes et curieuses, from 1717, which became very well known in Europe.36 In Carte du cours du
Maragnon (Figure 3), D’Anville and La Condamine traced a weaker line of the course of the river in the map they projected. With this expedient, which is very visible in the lower Amazon, at its mouth and Marajó island, showing accentuated movements to the east in the case of Fritz’ map, both seek to show the corrections which they introduced into the course of the river in relation to the Jesuit’s map, until then considered the most precise map of the region. Despite disagreeing with Fritz to a large part of the positioning of the river channel, D’Anville ensures that in Carte de l Amérique Méridionale all the detailing of the lands in the upper part of the Amazon River or Marañon is due to Father Fritz, who had lived with the Omagua Indians, since La Condamine had not gone through these parts.37 This will be confirmed by the
cartographic-mathematical analysis, which will show how and precisely in which part this usage occurred.
scientific ambitions, it was produced to illustrate La Condamine’s book. In some version the map was colored. It covers a narrow strip around the great river, it is in a plane chart38 and uses as a reference the Paris meridian.
D’Anville’s Carte de l Amérique Méridionale covers all the South American continent. It is a much more elaborate cartographic piece, with a significant size, which makes it appropriate for detailing the various geographic entities that it covers and it is also very fruitful in the toponymies. It is oriented by the Ferro’s meridian and had a meri-cylindric projection, “frequently used by D’Anville to represent the hemispheres.” 39 The map was primarily aimed at
the scientific knowledge of the territory, having been submitted to the Paris Academy of Science, but also had commercial purposes, having been put for sale in the author’s atelier.40 He marks in distinct colors the boundary lines
between the territories of the European crowns in America, denoting its purpose in serving the diplomatic game of defining frontiers, and more specifically as the basis for negotiation between the parties, as was the desire of Dom Luís da Cunha.
In order to compare the two maps – Carte du cours du Maragnon and Carte de l Amérique Méridionale – in a scheme similar to the former, 46 points common to the two documents were taken, and Table 3 was prepared. This was similar to Table 1, though with some differences. For the comparison the meridian of Paris was standardized, thus the following transformation equation could be used:
lp = lf + k (Equation 2)
In this:
lp – Longitude of the point in relation to Paris
lf – Longitude of the same point in relation to Ferro’s meridian
k – Constant to be added, corresponding to 20.43º which is the sum of 18.1º (Ferro-Greenwich) and 2.33º (Greenwich-Paris); or, as an alternative, according to the supposition of the time, 20.0º precisely.
l Amérique Méridionale, D’Anville stated that the difference between the First Meridian and that of Paris was “exactly 20º.” 41 For this reason in the
comparative study, k was taken as equal to 20.0º, which was the constant he used in Carte de l Amérique Méridionale to establish the difference between the two meridians.
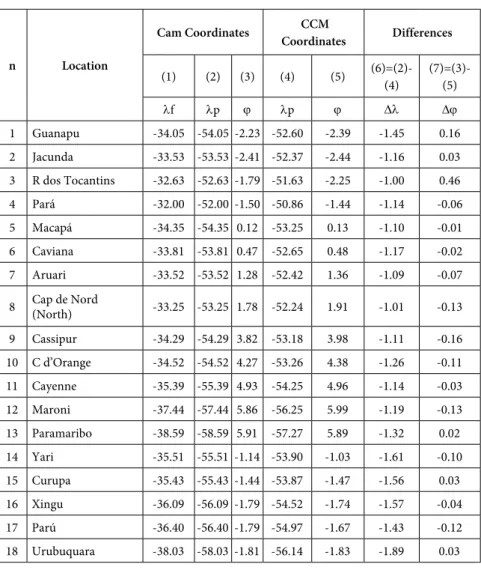
Table 3 – Longitudes (l) and Latitudes (j)
in Carte de l’Amérique Méridionale (CAm) compared with the values in Carte du cours du Maragnon (CCM)
n Location
Cam Coordinates CCM
Coordinates Differences
(1) (2) (3) (4) (5) (6)=(2)-(4)
(7)=(3)-(5)
lf lp j lp j Dl Dj 1 Guanapu -34.05 -54.05 -2.23 -52.60 -2.39 -1.45 0.16 2 Jacunda -33.53 -53.53 -2.41 -52.37 -2.44 -1.16 0.03 3 R dos Tocantins -32.63 -52.63 -1.79 -51.63 -2.25 -1.00 0.46 4 Pará -32.00 -52.00 -1.50 -50.86 -1.44 -1.14 -0.06 5 Macapá -34.35 -54.35 0.12 -53.25 0.13 -1.10 -0.01 6 Caviana -33.81 -53.81 0.47 -52.65 0.48 -1.17 -0.02 7 Aruari -33.52 -53.52 1.28 -52.42 1.36 -1.09 -0.07
19 Curupatuba -38.55 -58.55 -2.11 -56.63 -2.07 -1.92 -0.04 20 Tapajós -39.46 -59.46 -2.44 -57.50 -2.38 -1.96 -0.06 21 Trombetas (Pauxis) -40.38 -60.38 -1.93 -58.26 -1.90 -2.12 -0.03 22 Jamunda -40.88 -60.88 -2.24 -58.50 -2.10 -2.38 -0.14 23 das Madeiras -42.97 -62.97 -3.21 -60.51 -3.37 -2.46 0.16 24 Negro -43.84 -63.84 -3.28 -61.43 -3.22 -2.41 -0.05 25 Puruz -45.18 -65.18 -3.80 -62.58 -3.84 -2.60 0.04 26 Coari -46.97 -66.97 -4.05 -64.35 -4.00 -2.62 -0.04 27 Tefé -48.10 -68.10 -3.34 -65.64 -3.29 -2.46 -0.05 28 Yuruá -48.94 -68.94 -2.65 -66.38 -2.59 -2.56 -0.06 29 Yutaí -49.86 -69.86 -2.66 -67.34 -2.75 -2.52 0.10 30 Içá -50.76 -70.76 -3.23 -68.10 -3.25 -2.66 0.02
31 S. Paulo de Omaguas -51.80 -71.80 -3.54 -69.16 -3.58 -2.64 0.04 32 Yahuavari -52.22 -72.22 -3.97 -69.55 -4.10 -2.67 0.14 33 S. Ignacio de Pevas -53.55 -73.55 -3.44 -71.00 -3.61 -2.55 0.17 34 Napo -54.16 -74.16 -3.46 -71.82 -3.51 -2.34 0.05 35 Nanay -54.63 -74.63 -3.98 -72.55 -4.06 -2.08 0.08
In the analysis in Table 3, which contains statistical tests made for Carte de l Amérique Méridionale and for Carte du cours du Maragnon, similar to what was done in Table 1, it can be seen in relation to the latitudes there are no systematic differences between the two maps (the average differences are 0.04º) and in this case the standard deviation or precision of the differences is very small (0.13º), and the actual width of the rivers can produce a difference of this magnitude. In relation to longitudes, the existence of systematic differences between both was found (average of -1,65º).
The approximations between the two maps, especially in relation to the latitudes, reveals that to establish the route of the Amazon River in Carte de l Amérique Méridionale, there is no doubt whatsoever that D’Anville used Carte du cours du Maragnon as an important source, which he had produced in conjunction with La Condamine. However, the differences between the two maps, especially in relation to longitudes, shows that D’Anville did not use this source alone. In reality, it is clear from the magnitude of the values of column 6 in Table 3 that the royal cartographer significantly modified the measures taken by the latter. The information in the legend of Carte de l Amérique Méridionale that the French traveler had been the person greatly responsible for the positioning given to the river (see note 31), is undermined by these differences, but it is patent and clear if we understand how this map was constructed. For this it will be necessary to study through digital cartography other sources to put the puzzle together.
Méridionale, D’Anville positioned Quito at 60 degrees and 20 plus minutes to the west of the Ferro’s meridian,42 considering that a deviation of 7 to 8 minutes
would not cause great deviations on the map (Anville, Premiere Lettre..., p.524-525). The sum to show the equivalence of the values is simple: just use equation (2) and then subtract from 80º15’ (La Condamine’s value) the 20º of difference between Ferro and Paris, thereby obtaining 60º15’, which differs by 7 or 8’ from the 60º and 20’ plus proposed by D’Anville: an insignificant difference. However, there is another very reasonable coincidence in Jaén (-0.25º), showing that in this point D’Anville accepted the measurements made by La Condamine between Quito and this location, despite the difficulties encountered to take them.
However, this difference increases while descending the river, reaching the maximum value of 2.60º, in Coari and Purus, afterwards declining to values of around 1.14º in Belém do Pará. To explain these differences, the particularities of Carte du cours du Maragnon have to be taken into account (Cintra; Freitas, 2011). First, it has to be emphasized that it has differences in relation to what is written in La Condamine’s report, although he is the author of both. This is the case of Cuenca, where a difference of 0.49º is found between the two, the mouth of the Napo with 0.57º, and Belém do Pará with 0.17º. It appears to us that these differences occurred due to adjustments in the drawing and composition of the map, made by D’Anville, when the data obtained by La Condamine was collated with the other documents used to produce the map, which certainly counted on the consent of the latter. The modification of the position of Belém do Pará in Carte du cours du Maragnon, even though small, should not have occurred, since La Condamine, using astronomical methods, measured at three different moment the longitude of Belém do Pará (nominated in the maps as just Pará), which certainly resulted in a very precise measurement.43 In effect, in his report the longitude of Belém has a deviation
of only 0.06º in relation to current measurements, and this adjustment creates a greater deviation on the map at this point, although it is still relatively small. In the case of the Carte de l Amérique Méridionale, the adjustments in the environs of Belém were greater, and because they did not just use the field data of La Condamine, they have a residual deviation of 1.6º of longitude in this town when compared to the current value (Table 1). In relation to the mouth of the Napo River,44 the Carte du cours du Maragnon has a deviation of 3.79º
analysis, he principally used Fritz’s data from a map entitled El gran rio Marañon (Figure 6),45 to redo the calculations of this geographic accident.
From the above it is clear that in Carte de l Amérique Méridionale D’Anville did not uncritically accept the measurements of the French traveler and, as will be seen below, in some points adjusted La Condamine’s observations, even though in the legend he paid tribute to him for being responsible for the configuration of the river channel. These discrepancies also show that, for this map, as he mentioned in his memorials, he collated other sources to establish the position of the Amazon, in detriment to the conformation that he had imprinted with La Condamine in 1744 in Carte du cours du Maragnon. During their first collaboration there were no reasons, nor even any way, for D’Anville to suspect or alter the data obtained by the French traveler during his voyage down the Amazon. At the moment the Carte de l Amérique Méridionale was being drafted, however, access to the Portuguese sources provided by Dom Luís da Cunha allowed him to discard various measurements and to alter the positions of various points along the Amazon. Some of these alterations improved the map, others did not.
Figure 6 – El gran rio Marañon, O Amazonas con la mission de la Compañia de Jesus geographicamente delineado por el P. Fritz, missionero continuo, en este Rio, P.J.
Sources for the composition of Page 1
of
Carte de l’Amérique Méridionale
In relation to the documents used to establish the position of the course of the Amazon in Carte de l Amérique Méridionale, D’Anville in part detailed these in his memorials.46 The writing of memorials which reveals the process
of criticizing maps, a central part of the process of the construction of cabinet cartography, was aimed at the savants of the time and gave the map credibility within the scientific community. D’Anville, initially did not accompany the map with its respective memorial, which created protests. Two memorials came to light in 1750, published in the Journal des Savants, by D’Anville, critically scrutinizing parts of the process of the map producing. Until them, only the map legend made any references to some of the sources, all linked to the Franco-Spanish mission of measuring the equator.
In reference to the Amazon, in Carte de l Amérique Méridionale cartouche’s legend D’Anville declared that he was greatly in tribute to the expedition that descended the river initiated by La Condamine, but the memorials revealed that various other sources were collated to establish the river channel. This expedition included another member of the Franco-Spanish meridian mission. This was Pedro Vicente Maldonado, an enlightened Spanish criollo, governor of the province of Esmeraldas, in Quito Audience, who was sent by the Spanish crown to Paris to make contact with the French savants. In La Condamine’s diary,47 as in D’Anville’s memorials about Carte de l Amérique Méridionale, it
Pastaça River, from where Maldonado had come, reaching the mouth of that river and from there he descended La Laguna, located at the mouth of Guallagua.48 When La Condamine reached this village on 19 July, he met
Maldonado who already had been there for six weeks (La Condamine, 1984[1745], p.64).
D’Anville said that to establish in Carte de l Amérique Méridionale the section between Quito and Laguna, he used and compared the observations of La Condamine and Maldonado on the two routes they used to reach the Amazon (Anville, Premiere Lettre..., p.535-538), with the latter being used to trace the course of the Pastaça (La Condamine, 1984[1745], p.64) for which he had brought a compass and a portable gnomon.49 Both left Quito with the
same coordinates and took measurements of latitude, directions, the velocity of water and distances covered, but neither of them took measurements of longitude before the mouth of the Napo River, located eight days by canoe upstream from Laguna.50 In this village, despite the efforts of La Condamine,
vapors on the horizon had prevented the satellites of Jupiter from being seen (La Condamine, 1984[1745], p.65). Since no longitude had been observed, D’Anville had to calculate them based on the measurements of distance covered between various points collated by the two travelers between Quito and Laguna, passing by the mouth of the Pastaça, as well as using other subsidiary documentation. The fact that they had chosen two different itineraries allowed the geographer to compare the measurements taken separately and, based on this comparison, to establish the difference in longitude between the two points. In these calculations it was necessary to take into account the direction of the watercourses taken with a compass, the angle between the magnetic and true azimuth and distance covered in function of the speed of the vessel in relation to the river bank; by expressing these quantities he had to take into account the use of different leagues: French, Spanish, maritime, or common, something which D’Anville, as an experienced cartographer was aware of.51 He
in the construction process of the desk bound cartographer.52 Figure 7,
prepared for this paper, shows the different itineraries followed, also including what Pedro Teixeira had done almost a century before, as well as the different locations through which they had passed.
In Carte de l Amérique Méridionale, Jaén was practically positioned in the same position as in Carte du cours du Maragnon, which shows that until this section D’Anville used the measures taken by La Condamine since Quito, despite the fact that he apologized for the imprecision of the measurements the latter took between Loxa and Jaén de Bracamoros, due to the undulating nature of the land (Anville, Premiere Lettre..., p.537). Between Jaén de Bracamoros and Laguna, D’Anville once again excused La Condamine for his imprecision, this time for having minimized the wind strength, which influenced the calculation of the distance covered on canoe in this part of the river (ibidem, p.540-541).
From this location (Jaén), still using La Condamine’s data, he positioned Santiago and Borja on the channel of the river, which allowed him to establish on the map the first point of the Amazon or Marañon. After this point he stated that he used various documents to continue the drawing of the river, in the direction both towards the mouth and its spring. The first of these was a large
Figure 7 – Different access routes to the Amazon Routes
manuscript map drawn by Fr. Magnin, presented to La Condamine in Borja, capital of the Mainas, and, even though the geographer did not consider this map perfect, since it did not followed “geometric rigor,” which resulted “in an exaggeration of the extension of the spaces,” he incorporated some of its information. In this section, according to his words, he also used the original map of the Jesuit Fr. Fritz which La Condamine had brought from Quito, and also various memoirs given to him by Maldonado (Anville, Premiere Lettre..., p.438-439), when the two had worked together in the preparation of Carta de la provincia de Quito, which is discussed later.53
Between Jaén and the mouth of the Pastaça, D’Anville had two principal data options – those of La Condamine and the Jesuit missionary. He established, as has been seen, the longitude of Jaén basing himself on La Condamine, and used the differences in distances (converted into longitudes) measured by Fr. Fritz, as it involved the choice of a source which in principal was most trustworthy, since the Jesuit has often travelled on this section to visit the villages given to his responsibility by his order. This hypothesis was confirmed by the mathematical analysis.
In the region between the mouth of the Pastaça and Laguna, D’Anville came to have a third source: the data which Maldonado had collected in loco with the purpose of positioning the course and the mouth of the river. It has already been seen in Table 3 that D’Anville modified the longitude of the mouth of the Pastaça in relation to Carte du cours du Maragnon (a difference of -1.26º), correcting this data which La Condamine believed to be more precise, after comparing it with the measurements collected by Maldonado, which permitted him to calculate the longitude through the distances covered and the directions followed. This occurred because after making the calculations based on the measurements taken by the two travelers on different paths and locations between Quito and Laguna, passing through the mouth of the Pastaça, he concluded that those of Maldonado were more accurate. This type of comparison or discordance also occurred in other locations in the province of Quito. For example, in relation to the distance between San Juan and a bridge on the upper Pastaça, the former had calculated 35 leagues, Maldonado 45, and he himself estimated it as 46 leagues, much closer to Maldonado`s data (Anville, Premiere Lettre..., p.537-538).
stepped on French soil.Maldonado reached Paris in December 1746 and there was charged by the Spanish government with producing a map of the Province of Quito.54 This was done in collaboration with D’Anville, in other words, as
usual Maldonado provided the survey data and the geographer drew the map itself. The title of the map refers to the death of Maldonado, which occurred in 1748: Carta de la provincia de Quito y de sus adjacentes, obra posthuma de don Pedro Maldonado... hecha... sobre las proprias demarcaciones/del difunto autor por el S. D’Anville”.55 As analyzed by Neil Safier, not only was this
collaboration marked by various misunderstandings about the exact position of various geographic points, but in the majority of these D’Anville took the side of La Condamine, who became an active collaborator in the map, especially after the death of the Spanish criollo.
What is interesting is that the discordances with La Condamine and the adoption in Carte de l Amérique Méridionale of Maldonado’s data in this section (Quito Province) appear clearly justified in the memorials he wrote about the map (see note 28), however in the legend of the map it appeared in a mitigated form. In this D’Anville stated that “he owed to Mr. de La Condamine, from the Royal Academy of Sciences of Paris, the communication of all that is active and clarified curiosity which he sought of knowledge and memorials, independent of their observations, which were principally about the course of the Amazon river, and the rivers that flow into it.” As will be seen, this is only true for a determined part of the Amazon, in other words the positioning of Jaén and the section of the Amazon after the Javari River. He also used La Condamine’s data in other regions, as well as the toponomy he suggested. In relation to Maldonado, he said that he had “instructed the various circumstances of details on the northern part of Peru.” In other words, he does not stress the latter’s extremely important contribution for the indirect establishment of longitude (through distances and directions) at the mouth of the Pastaça and Laguna and the course of the Pastaça, in which D’Anville used his measurements and not La Condamine’s information.56
Furthermore, D’Anville’s text does not highlight his divergences with La Condamine and to an extent covers up the disagreements between the two expeditionaries, making a vague reference to the memorials which the latter had brought from America which, as has been stated, was based on the data of Fr. Fritz in various locations, especially the land in the upper part of the Amazon,57
publics and functions at which they were aimed. The first sought to validate the map with a wide audience, anchoring it in the prestigious geodesic mission and its internationally recognized members. Its laudatory tone allowed the geographer to honor the important contribution of the mission to the development of geography, without taking sides in the disputes which had dilacerated the group. The memorials were aimed at a more restricted and specialized public of savants, especially those in the Royal Academy of Science of Paris, and sought to submit the process of the critical cartography of the map to this qualified audience, without which it would not have received the approval of the institution, fundamental for consolidating its scientific fortune. In this case guaranteeing the credibility of the map signified using the data considered to be most trustworthy, irrespective of its origin.
We thus examined the sources for the positioning of Belém do Pará and points close to the mouth of the Amazon. In relation to Belém, D’Anville differs from the value given by La Condamine, but also, as will be seen, does not use the position given for the location by Fr. Fritz in El gran rio Marañon. It is suggestive that in all the versions of memorials found in which D’Anville dissects the process of criticizing the sources and the production of Carte de l Amérique Méridionale, to the contrary of what he does in other points and important cities in America (such as Cayenne, Buenos Aires, Valparaíso, Santos, São Vicente, Olinda and many others), in none of these documents does he mention the measurement of longitude taken by La Condamine in Belém and much less does he refer to the sources or the data used, nor the calculations used for the positioning of the location. In a sole document, as already mentioned, entitled De l’entré du Pará,58
probably from the pen of La Condamine and copied by D’Anville, there is mention of the position of the city of Pará, but this only deals with latitude, which coincides with the values found by this French traveler (around 1º20’ to the south of the Equator), and not longitude, referring only to distances in relation to other points located at the mouth of the river. In Carte de l Amérique Méridionale the repositioning of these other close locations, as well as those close to the Amazon, as in the case of Guanapu and Jacunda, or in its immediately upper section, the case of the mouth of the Tocantins River, may also have contributed to the repositioning of Belém.
In addition to the manuscript map of Fr. Inácio Reis, which has already been mentioned, the positioning in this region was also influenced by a long manuscript map of the course of the Tocantins River brought from Pará by La Condamine and Maldonado.59 This map and another provided to him by the
locate on Carte de l Amérique Méridionale the position of the course of this river and its mouth in the Amazon in terms of longitude. This position, for the better or the worse, was achieved thanks to the establishment of the coordinates of the village of Meia Ponte on the Upper Tocantins, close to its source. According to the positions which this cartography helped him point out, D’Anville located the mouth of the Tocantins at 32.63º longitude. As can be seen in Table 1, its mouth thus was moved 1.58º when compared with a current map. Using this data, instead of the longitude of Belém provided by La Condamine, led him to incur in a series of deviations in both latitude and longitude in the surrounding areas of Belém, as shown by Table 1.
Comparison between
Carte du cours du Maragnon, Carte de
l’Amérique Méridionale and el gran rio Marañon
Cartographic comparison between Carte du cours du Maragnon, Carte de l Amérique Méridionale and El gran rio Marañon will allow us to show the probably manner in which D’Anville used the available data to mount his synthesis. This can commence with the comparison established between the map El gran rio Marañon, from Fr. Fritz, and the map Carte du cours du Maragnon, prepared by La Condamine.
the coincidence in Jaén may be misleading. This is clearly observed in Figure 8, comparing the deviations in longitude in Carte du cours du Maragnon and El gran rio Marañon, it can be seen that the two maps attribute disparate longitudes to Jaén, with a difference of amplitude of around 2º between them. The manner in which Fritz’s course of the Amazon river was traced in Carte du cours du Maragnon molded in an almost indelible manner the evaluation that has been made up to now of the Jesuit’s map, which tended to agree with La Condamine and D’Anville, who in their writings stated that the map was very imprecise in relation to the river channel. Let us look at this.
For the effects of the visualization of the differences between the Carte du cours du Maragnon, Carte de l Amérique Méridionale and El gran rio Marañon, which allowed a comparison between them, Table 4 was used, with the precision in longitude and the graph from Figure 8, which compares the deviations of longitude in the three maps in question. To do this 27 points in common were taken, ordered by latitude from west to east, demarking in each point the deviation in longitude in relation to current maps. Table 4includes the precision (standard deviation) achieved in each, while the value of 1.02º given to Carte de l Amérique Méridionale was removed from Table 2 (rounding the value of 1.017º) and the others from analogous tables, omitted for brevity. The minimum and maximum values can be obtained from the same tables and from Figure 8, while the amplitude is merely the difference between these two values.
Figure 8 – Comparison of degrees of deviations in the three maps: Carte du cours du Maragnon, Carte de l’Amérique Méridionale and El gran rio Marañon
Madeira Napo
Borja Xingu
Jaén
Javari Ucayale
Negro Purus Iça
Pará Yutai
Tefé
-3.0 -2.0 -1.0 0.0 1.0 2.0 3.0 4.0
-80 -75 -70 -65 -60 -55 -50 -45
Longitude (current maps)
Carte du cours du Maragnon Carte de l' Amérique Méridionale El gran rio Marañon
Table 4 – Comparison of precision in longitude and the maximum and minimum values in degrees
Map Precision Min-Max Amplitude
Carte du cours du Maragnon 1.14º -0.5º to + 3.2º 3.7º
El gran rio Marañon 1.01º -1.8º to + 1.7º 3.5º
Carte de l’Amérique Méridionale 1.02º -2.9º to + 0.5º 3.4º
The analysis of Figure 8together with Table 4shows that from west to east the variations of deviations in Carte du cours du Maragnon follows an increasing pattern from Jaén onwards, reaching a maximum corresponding to a deviation of 3.2º at the mouth of the Napo and falling to zero in Belém, where La Condamine measured the longitude with great precision, as indicated by the values presented. The deviations of Fr. Fritz’s map in El gran rio Marañon, start
with a large value of around -2º at the first point, stabilize in a band of between -1º and 0º and afterwards rise to almost 2º. In Carte de l Amérique Méridionale the deviations are very small in Spanish America, including the mouth of the Napo, and afterwards obey a decreasing pattern similar to Carte du cours du Maragnon until the Madeira river (a point which has a deviation of almost zero, both in Carte du cours du Maragnon and El gran rio Marañon); afterwards the pattern is one of growth, in a similar form to Fritz’s deviations.
After analyzing the tendencies and the variation patterns, Figure 9 was created, which uses the idea that D’Anville suggested to La Condamine: the pairing of the river in different representations. Thus the pairings were made; first, with that of Fr. Fritz (El gran rio Marañon) not in Jaén, as they had done, but in Borja. What was found is an almost absolute coincidence of the two charts between Borja and Javari, including Napo (the average error is 0.06º). After this the pairing was made with the map prepared by the two Frenchmen (Carte du cours du Maragnon), from Napo onwards (or Javari, with an identical result). A very large coincidence was also found with the two charts up to Tapajós and Curupatuba (the average error is 0.04º). The discrepancy increased significantly in the Xingu, due to the influence of the positioning of its mouth in Carte de l Amérique Méridionale, which the maps of Fr. Reis and Tocantins contributed to.
a fundamental longitude in Quito; the use of the difference of longitude calculated by La Condamine between Quito and Jaén; use of the differences of longitude in the map of Fr. Fritz from Jaén and Borja to Napo and Javari; after that the use of the differences of longitude calculated by La Condamine and finally from Xingu to the mouth, the extraction of coordinates from other Portuguese maps.
Comparisons between
Carte de l’Amérique Méridionale,
Mapa das Cortes
and the Current Map of Brazil
As is known Mapa das Cortes (1749) is posterior to Carte de l Amérique Méridionale (1748) and as was mentioned at the beginning of the article, the author(s) of the former had access to D’Anville’s map and clearly used it to establish the region of the Essequebé river. It is agreed among scholars that Mapa das Cortes, presumably orientated by the meridian of Rio de Janeiro, has various imprecisions in terms of longitude, and much has been discussed about whether or not these distortions are intentional (see Ferreira, 2007). Figure 10 presents a comparison between Carte de l Amérique Méridionale and Mapa das
Madeira Napo Borja Xingu Jaén Javari Ucayale Negro Purus Iça Pará Yutai T efé -4.0 -3.0 -2.0 -1.0 0.0 1.0 2.0 3.0 4.0
-80 -75 -70 -65 -60 -55 -50 -45
Longitude (current maps)
L o n g it u d e d if fe re n c e s
Carte du cours du Maragnon
Carte de l’Amèrique Méridionale
El gran rio Marañon
Figure 9 – Comparative analysis in degrees between the three maps with a partial coincidence in Borja and in Napo, to show the composition
Cortes and confirms, as is to be expected, that despite having used the former, the latter is much less precise in terms of the location of various geographic points. The aim of this comparison is to reinforce the argument of the political intentionality of these imprecisions in Mapa das Cortes, since despite having the most precise sources available for the case of the Amazon region, as was the case of Carte de l Amérique Méridionale, they were discarded or used in a selective manner in order to visually minimize Portuguese territorial gains in the area, due to the importance of the region in the negotiation strategy then adopted with the Spanish.60 Figure 10 is based on 24 common points between
the two maps, for which the longitude deviations were calculated. For D’Anville’s Carte de l Amérique Méridionale the data is in columns 4 and 6 of Table 1; for Mapa das Cortes a similar table was created to serve as a source for the chart. These common points along the Amazon River are ordered in longitudes from west to east.
As can be seen in Figure 10, the sequence of deviations is divergent: Mapa das Cortes has a positive deviation of around 2.8º in Belém do Pará. This value falls from east to west to approximately 0.6º at the mouth of the Javari. In D’Anville’s Carte de l Amérique Méridionale, there is a negative deviation of 1.6º in Belém, which declines to around -0.4º in Javari. The deviations have a contrary deviation, so that one series is approximately the mirror of the other
Figure 10 – Comparison between the deviations in the Amazon river channel between Carte de l’Amérique Méridionale and Mapa das Cortes
Madeira
Negro
Tapajós Xingu
Javari Japurá
Pará
Yutai Tefé
-3.5 -2.5 -1.5 -0.5 0.5 1.5 2.5 3.5 4.5
-75 -70 -65 -60 -55 -50 -45
Longitude (current maps) Carte de l’Amérique Méridionale
Mapa das Cortes
in relation to a straight line with null deviation, which takes as a reference Mapa da Amazônia Legal. The only anomaly in this pattern occurs on the Japurá river, where the deviation of Mapa das Cortes is clearly less. Another important and revealing analysis in Figure 9is the calculation of the coordinates between Belém do Pará and Javari, from which it is possible to calculate the extension (in degrees) which each of the two maps imprinted on this section of the Amazon valley, as shown in Table 5.
Table 5 – Distance (in degrees) of the Belém-Javari section and the reduction in each map
Belém-Javari Difference Reduction
Carte de l’Amérique Méridionale 20.2 -1.3
Mapa das Cortes 19.1 -2.4
Actual 21.5 0
As can be noted in Table 5, the two maps shorten the length of the Amazon river in this section, but the reduction made by D’Anville is much less than in Mapa das Cortes. It was imperative that the latter drastically reduce the size of the river, since it had to be diminished by close to 3º to compensate the distension of 3º produced on the Atlantic coast in an easterly direction, between Cape São Roque and Belém, and thus return to longitude coordinate values close to the real ones in Spanish territory (from Javari westwards), in order not to conflict with the measurements that had been taken during the geodesic mission to Peru and which were widely known by European savants, including those of the Spanish crown. In other words, although D’Anville’s Carte de l Amérique Méridionale was more precise, especially in relation to this section, it was not used here, and the reason for this discarding is clear: Mapa das Cortes intentionally sought to show an area outside the Tordesillas agreement that was less than reality.
By way of a final qualitative comparison, in this section, Figure 11, created for this paper,61 shows the superimposition of Carte de l Amérique Méridionale
and Mapa das Cortes in a current Map of Brazil,62 in order to make a visual
Orange and Javari, highlighted with green arrows. The frontiers suggested by Mapa das Cortes are drawn in red and the position of the Tordesillas Meridian is traced in the same color.
The superimposition of Carte de l Amérique Méridionale on the current Map of Brazil reveals a reasonable adherence between both, especially the coastal line which extends along the São Miguel river (Alagoas) until the proximities of São Luís Bay, for which D’Anville principally used Dutch cartography from the seventeenth century, produced in the context of the invasion of the northeast (Furtado, in print, Chp. 9). Comparing the two maps with Mapa das Cortes, it can be seen that the dislocations in various locations (green circles) of Carte de l Amérique Méridionale are less in relation to the current Map of Brazil. For example the position of the first cataracts on the Madeira river are substantially dislocated to the south in Mapa das Cortes, which visibly diminishes on the map the area located to the west of the Tordesillas line, reinforcing the argument of the intentionality of these dislocations. InCarte de l Amérique Méridionale, from the Paraguay river onwards, the proposed frontier line (brown) increasingly penetrates to the west until it reaches the Amazon between São Pedro and Nossa
Figure 11 –Visual comparison between Mapa das Cortes and the current Map of Brazil, on Carte de l’Amérique Méridionale, by D’Anville
Frontiers lines
Nowadays
Mapa das C ortes
Senhora de Guadalupe. These are the final Portuguese and the first Spanish settlements. It should be noted that until it reaches the Amazon the frontier passes through territory which, with the exception of the Madeira River is totally unknown. D’Anville principally owed his plot to the Jesuit Inácio dos Reis. The frontier line proposed in the Carte de l Amérique Méridionale is much more detailed than Mapa das Cortes (red) as in that it was not even drawn for the Guianas.63 However, in this section the line proposed by Carte de l Amérique
Méridionale is less ambitious of what was achieved as frontier with French Guiana: it ended in the North Cape and not in Cape Orange, but it cannot be forgotten that the map was dedicated to the Duc d’Orleans, first prince of the royal blood of the French throne, and that D’Anville was the first geographer of the king of France and in this perspective the map also reflected the diplomatic intentions of the French and even the vision of Dom Luís da Cunha, for whom what was primordial was guaranteeing Portuguese dominion over the two banks of the Amazon, which had been assured in the treaty of Utrecht.64
It would be interesting to carry out the superposition of the borders of Brazil with the three parts which composed the totality of D’Anville’s map, for a global assessment of Carte de l Amérique Méridionale, a task which will wait for another opportunity.
Conclusions
of La Condamine from there until close to Tapajós; from there on the places were positioned according to the Map of Tocantins river and its mouth, facilitated by Dom Luís da Cunha. Thus, there occurred collaboration between D’Anville and La Condamine in the production of 1744 Carte du cours du Maragnon, and even though in Carte de l Amérique Méridionale, the geographer declared that he was in debt to information brought by La Condamine, this was done with certain adjustments.
The analysis of D’Anville’s texts about the production process of Carte de l Amérique Méridionale reveals his complex method of analysis and comparison of these cartographic documents to serve as a source for the map in question, and help in the understanding and analysis of mathematical data of measurements of latitude and longitude for various points located along the river. The artifice of Carte du cours du Maragnon of superimposing the new route of the Amazon on that of Fr. Fritz, which appears traced on this map and which until then was considered the most exact representation of the river, molded the negative interpretations of the Jesuits’s map. The mathematical analysis of the positioning of various geographical points on these two maps reveals that, to the contrary of what was expected, in various of these the representation of the Amazon of Fr. Fritz’s El gran rio Marañon is closer to the actual representation than Carte du cours du Maragnon. The idea of pairing rivers present in D’Anville and La Condamine’s map served as inspiration to make comparisons (as shown in Figure 9)which reveal theadherence of long sections with the maps used and thus permits us to discover the probable form that this material was used by D’Anville to draft Carte de l Amérique Méridionale.
phenomenon highlighted. This article presented an instigating perspective of analysis and opened new areas of research for the understanding of cartography in Portuguese American in the eighteen century, in relation to its mathematical and geometric aspects, as well as the historic, diplomatic and political.
NOTES
1 On this occasion D’Anville was contracted solely to help in the composition and
organization of a collection of prints which Dom João V had been creating and which was being acquired by Dom Luís da Cunha in Paris. Over time the trust between the two increased and the collaboration was expanded. FURTADO, Júnia F. Colecionismo e gosto. As compras portuguesas de livros e estampas nos Países Baixos meridionais. In: THOMAS, Werner; STOLS, Eddy (Ed.). Un mundo sobre papel: libros, grabados y mapas de Flandres en los impérios español y portugués (siglos XVI-XVIII). Lovaina: Acco, 2009. p.411-425.
2 For a more complete analysis of the map and the collaboration established between them,
see: FURTADO, Júnia Ferreira. Oráculos da Geografia iluminista: Dom Luís da Cunha e Jean Baptiste Bourguignon D’Anville na construção da cartografia do Brasil. Belo Horizonte: Ed. UFMG, 2012 (in print, based on Full Professor Thesis, Departamento de História/UFMG, 2009).
3 In relation to the profile and method of D’Anville see: FURTADO (in print), Chapter 4
(Espelho do mundo).
4 Bibliotèque Nationale de France (BNF). Département des Cartes et Plans (DCP). Ge D
11795 (rés), manuscript. All the maps in the D’Anville collection are available for consultation on the library site.
5 BNF. DCP. Ge D (10659), manuscript.
6 The map was prepared in three parts and corresponds to three separate pages, which were
photographed in different archives. The 1748 manuscript copy of Page 1, the superior part of the map, was worked with through digital photography, obtained from the National Library of France, who I would like to thank, with the corresponding number being: BNF. DCP. Ge C 11339 (ground), manuscript.
7 HARLEY, John Brian. The new nature of maps: essays in the history of cartography.
Baltimore/London: The Johns Hopkins University Press, 2001.
8 The coordinates were taken from three sources: a) the Map of Amazônia Legal. Instituto
Brasileiro de Geografia e Estatística (IBGE), Brasil, 1995. Available at: geoftp.ibge.gov.br/ mapas/temáticos; b) Britannica Atlas, Enc. Britannica, Helen Hemingway Benton pub., London, 1974; c) World Atlas, Hammond, New Jersey.
9 “The same Portuguese post delivered to me the map and letter of mr. D’Anville”. Arquivo
10 Arquivos Nacionais da Torre do Tombo (ANTT). Ministério dos Negócios Exteriores
(MNE). Livro 826, Carta de Marco Antônio de Azevedo para Vila Nova da Cerveira, f.114-114v, Lisboa, 28 dez. 1748.
11 During the negotiations Portugal presented this map, which was used as the basis for the
definition of the frontiers. For this reason copies were them produced, which stayed in the possession of the two crowns. Some of these still exist. See: Mapa dos Confins do Brasil com as terras da Coroa de Espanha na América ou Mapa das Cortes. Fac-simile of the original in the Biblioteca Nacional, that belongs to Marcos Carneiro de Mendonça, offered by Luiz Phillipe Carneiro de Mendonça, whom we thanks. Personal Archive of Júnia Ferreira Furtado.
12 See FERREIRA, Mario Clemente. O Tratado de Madrid e o Brasil Meridional. Lisboa:
CNPCDP, 2001; FERREIRA, Mário Clemente. O Mapa das Cortes e o Tratado de Madrid: a cartografia a serviço da diplomacia. Varia Historia, Belo Horizonte, v.23, n.37, p.53-69, 2007.
13 For details of this correspondence and its implications, see: FURTADO (in print), Chp. 9
(Espelhos ondulados).
14Carte huilée de la route de Nicolas Horstman natif de Hidelsheim en Westphalie depuis Rio Esquibé jusqu’à Rio Negro, 17. BNF. DCP. Ge DD 2987 (9612).
15 “However, before going a little further below representing the Amazon River, an almost
complete connection between the Negro and Essequebé rivers cannot be omitted.”
ANVILLE, Jean-Baptiste Bourguignon d’. Premiere Lettre de Monsieur d’Anville, à Messieurs du Journal des Sçavans, sur une Carte de l’Amérique Méridionale qu’il vient de publier. Journal des Sçavans, Paris, p.522, Mars 1750.
16 PRATT, Mary Louise. Os olhos do império: relatos de viagem e transculturação. Bauru:
Edusc, 1999. p.45-48; SAFIER, Neil. Measuring the New World: enlightenment science and South América. Chicago: Chicago University Press, 2008.
17 SAFIER, Neil. Como era ardiloso o meu francês: Charles Marie de la Condamine e a
Amazônia das Luzes. Revista Brasileira de História, São Paulo, v.29, n.57, p.91-114, jan.-jun. 2009.
18 Print and manuscript versions of Carte du cours du Maragnon ou de la grande riviere des Amazonas, La Condamine and D’Anville. BNF. DCP. Ge DD 2987 (9542) and (9543).
19 This division of cartographic work was typical of French and English desk based
geography and also included a third task, engraving the map, done by a different person. See: PEDLEY, Mary Sponberg. The commerce of cartography: making and marketing maps in eighteenth-century France and England. Chicago: The University of Chicago Press, 2005.
20 LA CONDAMINE, Charles-Marie de. [1745] Viagem na América meridional descendo o rio Amazonas. Brasília: Ed. Senado Federal, 1984. p.34.
21 For example, “In São Joaquim ... we left... with the intention of reaching the mouth of