i
SPATIAL AND TEMPORAL ANALYSIS OF RECENT DROUGHT
USING VEGETATION TEMPERATURE CONDITION INDEX
Case of Somali regional state of Ethiopia
ii
SPATIAL AND TEMPORAL ANALYSIS OF RECENT
DROUGHT YEARS USING VEGETATION TEMPERATURE
CONDITION INDEX
Case of Somali regional state, Ethiopia
Dissertation supervised by Professor Mario Caetano, Ph.D
Dissertation co-supervised by Professor Jorge Mateu (Ph.D) Professor Edzer Pebesma, (Ph.D)
iii
ACKNOWLEDGEMENTS
I am very grateful to my supervisor Prof Mario Caetano for all his support, valuable comments and suggestion to write up this report on time. I would also like to extend my gratitude to my respectful co supervisors Prof Jorge Mateu, and Professor Edzer Pebesma for their comments and corrections. I would also like to thank Prof Marco Painho, for his follow up, encouragement and vital comments.
I like to thank NASA Land Processes Distributed Active Archive Center (LP DAAC), USGS/Earth Resources Observation and Science (EROS) Center, for the freely available MODIS dataset. I would also like to thank National Meteorological Agency of Ethiopia for provide me with rainfall and temperature data. Without it the report could not have been accomplished.
I‟m grateful to European Commission, Erasmus Munds program for the financial support that covers all of my expenses throughout the study years.
I‟m thankful for all my colleagues for their technically and emotional support throughout my study career.
Thank you, Alemtsehay Zergaw
iv
SPATIAL AND TEMPORAL ANALYSIS OF RECENT
DROUGHTS USING VEGETATION TEMPERATURE
CONDITION INDEX.
Case of Somali regional state of Ethiopia
ABSTRACT
v
KEYWORDS
Drought
Vegetation Temperature condition Index (VTCI) Normalized Difference Vegetation Index (NDVI) Land Surface Temperature (LST)
NDVI/LST scatter space.
vi
ACRONYMS
CSA – Central statistical Agency DOY – Day of the year
LST – Land Surface Temperature
MODIS – Moderate Resolution Imaging Spectoradiometer MRT - MODIS Re-projection Tool
NAPA – National Adaptation Program of Action of Ethiopia NDVI – Normalized Difference Vegetation Index
NMA – National Meteorological Agency
NMSA – National Meteorological Service Agency
NOAA – National Oceanic and Atmospheric Administration PDI – Palmer Drought Index
PDSI – Palmer Drought Severity Index SNRS – Somali National Regional State
UNEP – United Nations Environmental Program VCI – Vegetation Condition Index
vii
TABLE OF CONTENTS
ACKNOWLEDGEMENTS ... iii
ABSTRACT ... iv
KEYWORDS ... v
ACRONYMS ... vi
TABLE OF CONTENTS ... vii
INDEX OF TABLES ... ix
INDEX OF FIGURES ... x
1. INTRODUCTION ... 1
1.1 BACKGROUND ... 1
1.2 RESEARCH PROBLEM ... 2
1.3 OBJECTIVES ... 4
1.4 LIMITATION OF THE STUDY ... 4
1.5 AN OVERVIEW OF THE STUDY AREA ... 5
1.6 DESIGN OF THE REPORT ... 8
2. LITERATURE REVIEW ... 9
2.1 CONCEPT OF DROUGHT ... 9
2.1.1 TYPES OF DROUGHT ... 10
2.2 DROUGHT CHARACTERISTICS AND SEVERITY ... 13
2.3 DROUGHT INDEX DERIVED FROM SATELLITE IMAGERY ... 15
2.4 CASE STUDIES USING LST, NDVI AND VTCI AS DROUGHT MONITORING INDEX ... 18
3. METHODOLOGY ... 21
3.1 DATA SET ... 22
3.1.1 SATELLITE DATA ... 22
3.1.2 RAINFALL AND TEMPERATURE DATA ... 22
3.1.3 ANCILLARY DATA ... 23
3.2 DATA PROCESSING AND ANALYSIS ... 23
viii
3.2.2 ANALYSIS OF NDVI/LST RELATIONSHIP ... 25
3.2.3 VEGETATION TEMPERATURE CONDITION INDEX (VTCI) ... 26
3.2.4 REGRESSION AND CORRELATION ANALYSIS ... 27
4. RESULT AND DISCUSSION ... 28
4.1 SCATTER SPACE OF NDVI VERSUS LST ... 28
4.2 TEMPORAL PATTERN OF VTCI ... 32
4.3 SPATIAL PATTERN OF VTCI ... 37
4.4 VTCI and PRECIPITATION ... 41
4.5 TREND ANALYSIS ... 42
5. CONCLUSION ... 45
BIBLIOGRAPHIC REFERENCES ... 47
APPENDICES ... 53
Appendix 1 Land use/land cover from Global Land Cover Facility ... 53
Appendix 2 Dry and Wet edge Regression. ... 54
ix
INDEX OF TABLES
Table 1.1 Land use in Somali region by zone in 1,000ha (CSA, 2008) ... 7
Table 3.1 Quality flag explained for SDCs ... 24
Table 3.2 Quality flag keys for NDVI MODIS product ... 25
Table 4.1 Wet and dry edge linear regression equation. ... 31
Table 4.3 Pearson correlation coefficient between VTCI and Rainfall ... 41
x
INDEX OF FIGURES
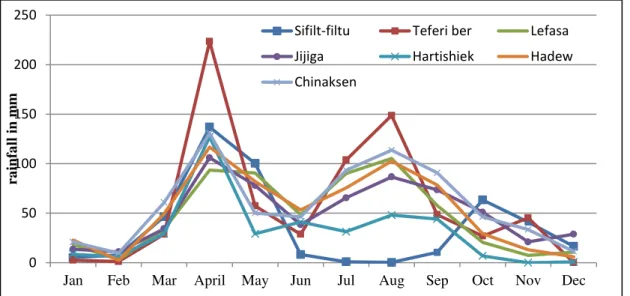
Figure 1.1 Rainfall distribution over the study area. ... 6
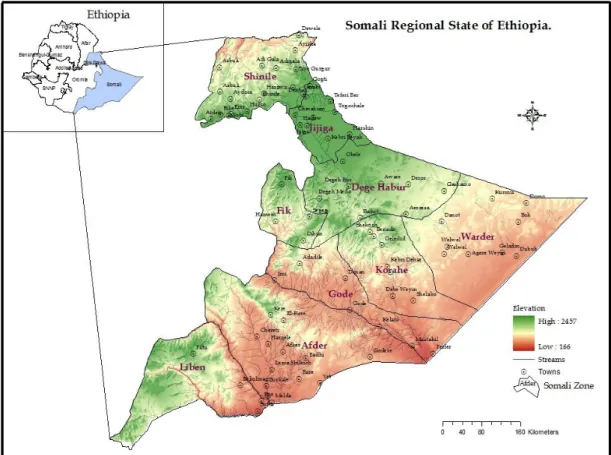
Figure 1.2 Topographic Map of Somali regional state of Ethiopia ... 7
Figure 1.3 Land cover classes for Somali regional state (Global land cover, 2009) ... 8
Figure 2.1 NDVI/LST feature space relationships (After Sandholt, et al. 2002) ... 18
Figure 3.1 Methodology framework ... 21
Figure 4.1NDVI/LST Scatter space over the DOY in the whole study ... 29
Figure 4.2 VTCI as divided into five level of drought ... 33
Figure 4.3 VTCI and its variation in the time ... 35
Figure 4.4 Areal percentage of drought over the time series based on VTCI value .. 36
Figure 4.5 Drought affected areas for the five drought years. ... 37
Figure 4.6 VTCI and land cover ... 38
Figure 4.7 Drought affected areas for the past 10 years based on VTCI value ... 40
Figure 4.8 VTCI Trend across the study area ... 42
1 1. INTRODUCTION
1.1BACKGROUND
The Somali region, which is located in the east and southeastern part of Ethiopia, has suffered a series of droughts and famines in the years 1999/2000, 2003/2004, 2007, and currently 2011 (Senait, Givey, & Castillo, 2010; JRC, 2011; NMA, 2007). In the report National Adaptation Program of Action of Ethiopia NAPA (2007), they have listed 10 wet and 11 dry years for the past 55 years and the year 2000 was considered as the driest year. This trend of recurrent drought has become the most challenging natural disaster that led to numerous deaths both of humans and livestock (Tadesse et al. 2008). It also led to extension of drought prone areas and widespread poverty that displaced many pastoralist people in the region (Ezra and Kiros 2001). It is believed that the current trend of low rainfall years could eventually end pastoralism in the Horn of Africa (UNEP 2006). The region‟s economic fortunes are also intertwined with and are affected by local, regional, and even international changes in economic circumstances, which for this region, are always changing in ways that are difficult to predict.
Of all the environmental and socio-economic challenges people are facing, drought is the most common in pastoral and agro-pastoral areas of the region (Tadesse et al 2008; UNEP 2006; GebreMichael and Kifle, 2009). Eastern lowlands of Ethiopia are vulnerable to drought and there have been notable droughts in this part of the country throughout human history (Webb and Braun, 1994). Previous droughts and the frequency of rainfall deviation from the average suggested that drought occur every 3-5 and 6-8 years in the arid and semi-arid regions of Ethiopia and every 8-10 years for the whole country (Haile, 1988). In the same token, in National Meteorology Service Agency NMSA (2006) document, due to various factors, drought occurs every two years in eastern part of Ethiopia for the past two decades. El Niño-Southern Oscillation causes these droughts, along with sea surface temperature anomalies in the Southern Atlantic and Indian Oceans (Haile, 1988; Funk et. al. 2005, Webb and Braun, 1994). The main rainy season occupies the month from Mid of September to December which is locally called „Dihra‟ and the other from April to
2 Drought has thus been widely recognized as a major climatic hazard and a key development and environmental challenge in the Somali Regional State of Ethiopia. As a result the main stay of the inhabitant, livestock production is directly affected through decreased pasture availability, overgrazing and land degradation. It creates complex interwoven environmental degradation by decreasing the water availability; ultimately reducing dairy livestock product; emaciation and eventual death of livestock and decreased livestock prices. While opinions vary on the severity and frequency of drought in the historical past, recent reports showed that drought hazards have increased in frequency, intensity and magnitude over the recent decades and have adversely impacted on food, feed and food security and the sustainable livelihoods of Somali pastoralists (Pantuliano & Wekesa, 2008).
1.2RESEARCH PROBLEM
In dry and semiarid areas covering large part of Eastern region of Ethiopia, drought and crop failures have been common. Recurrent years of low/no rainfall during March- May and September- November in the region resulted in crop failure and loss of the biomass which is predominantly shrub land and grassland that support thousands pastoral households. It has raised paramount food security concern over the region. Reportedly in 2011, the region is hit by severe drought followed by the worst famine of the decade that is claiming the life of thousands.
3 need to assess impact of drought, the government with the collaboration of NGO‟s performs manual data compilation, which requires labor to obtain the optimal data (Berhan, T, S, & S, 2011). In some cases delineation of drought prone areas are compiled after interview conducted by agricultural expertise. Moreover, collecting sufficient temporal data is also another challenge since the region is less accessible. These and other administrative constraints hinder real time assessment of drought and timely response of the government to allocate resource and infrastructure to the prone regions (UNEP, 2006).
However, remotely sensed data presents fast and economical way of information to monitor and evaluate the condition of drought (Andreson, Hain, Mecikalski, & Kustas, 2009; Jain, Keshri, Goswami, & Sarkar, 2010). As the ground condition reflects the overall effect of rainfall and soil moisture, the satellite based monitoring plays an important role in drought monitoring and early warning system (Brown, Wardlow, Tadesse, Hayes, & Reed, 2008; Li, et al., 2009; Sergio & Vicente, 2007; ZhiMing, QiMing, ABduwasit, & DongDong, 2007; Vogt, Viau, Beaudin, Neimeyer, & Somma, 1998)
The main research questions are
1. Is VTCI an adequately means to measure the extent of drought for Ethiopia? 2. What are the spatial and temporal patterns of drought in the study area for
selected drought years?
3. Is there any observable trend of drought over the study area?
4 and soil moisture. Thus, the drought-monitoring technique used in the study combines the effect of vegetation condition and the available heat flux over the region.
1.3OBJECTIVES
Report from NMSA (2010), JRC (2011) and similar research pointed out that the 2000, 2002/2003, 2006/7 and 2010/11 were considered drought years. Our aim is to examine the spatial-temporal extent of these meteorological droughts on the context of characterization on vegetation temperature condition using drought indices obtained from MODIS products.
Specific objectives
1. to identify spatial and temporal pattern of the LST/NDVI relationship across the study area in order to see the extent of dryness or wetness.
2. to analyze the change in the extent and intensity of meteorological drought using one of the detection index across different administrative zone.
3. to see the VTCI trend over the past decade
4. to evaluate the relationship between rainfall and VTCI.
1.4LIMITATION OF THE STUDY
5 1.5AN OVERVIEW OF THE STUDY AREA
Somali region, which is often confused with the independent state with the same name,
is the eastern-most of the nine ethnic divisions of Ethiopia. The Somali Region is geographically located in southeastern part of Ethiopia, between 4° and 11° N latitude and 40 ° and 48° E longitude. There are nine administrative zones: Fik, Korahe, Warder, Gode, Afder, Degahbur, Jijiga, Shinile and Liben. The capital of Somali State is Jijiga. The altitude of the region ranges between 400-2400 meters above sea level, with most areas lying below 900 masl, it is the second largest region in Ethiopia (Figure 1.2). The region covers a total area of 350,000km21 consisting 52 districts (Woredas) and 703 Kebeles. The major perennial rivers in the region are Wabi Shebelle, Genale, Dawa and Weyib. There are also smaller seasonal rivers such as Erer, Daketa and Fafen. It is estimated that these rivers can irrigate over 600,000 ha of land out of which currently only 1.5% is irrigated and they contain an estimated volume of 100 billion cubic meters of water every year.
According to 2007 Census reports from Central Statistical Agency (CSA), the region has a total population of 4,439,147 contributing 6 percent for overall total population in Ethiopia. Out of this figure only 14 percent inhabits the urban region while the remaining population lives in the rural environment either as sedentary life or as a pastoralist. Despite of the vastness of the region, the population density is equivalent to 16 people per square kilometer. Household per person is around 6.6 for the entire 660, 000 households with urban and rural household‟s averages 6.3 and 6.7 people respectively.
In the urban area, 32.6% of the population is engaged in trade followed by pastoralism (19.1%) and crop farming (15.1%). The main source of income earnings for the surveyed rural population of Somali Region is livestock rearing which constitute about 40% of the total income followed by crop production (26.2%), trade (14.4%) and gift (7.4%) (Pantuliano & Wekesa, 2008).
1
6 The climate is arid and semi-arid influenced by the Gulf of Aden and the Indian Ocean to the north and east and to the influence of high lands of Ethiopia lying North West of the region. The main rainy season occupied the month of October to December which is locally called „Dihra‟ and the other from April to June which is
called „Gu‟ (Pantuliano & Wekesa, 2008; EPEMRD, 2011). Thus, the rainfall is bimodal (Figure 1.1) with an average precipitation of less than 200 mm in the southeast to some 600-700 mm in the north and west. Rainfalls vary in intensity and duration across the different geographical extent with erratic behavior. This has important consequences for the pastoral and farming communities.
Figure 1.1 Rainfall distribution over the study area.
The land use pattern closely related to both the climate and vegetation and, varies from rain fed farming in the sub- humid high-elevated area to pastoralism in the more arid lowlands eastern areas. Since much of the rainfall is concentrated in the northern, northwestern and western sides of the region, crop cultivation is common although the incidence of cropping very much attached to the rainfall behavior. Most of the rangelands are used for various forms of semi-nomadic pastoralist (SNRS, 2003). The dominant activity being pastoralism, some places practices cultivation of cereal crops like maize, sorghum and sometimes wheat in Jijiga, Shinile, and Gode zone. The SNRS report for 2003 stated that the major of the Somali region is utilized for grazing area (44%) followed by woodland (31%), unproductive area (23%) and limited rain fed cultivation (2%).
0 50 100 150 200 250
Jan Feb Mar April May Jun Jul Aug Sep Oct Nov Dec
ra
infa
ll in m
m
Sifilt-filtu Teferi ber Lefasa
Jijiga Hartishiek Hadew
7 Figure 1.2 Topographic Map of Somali regional state of Ethiopia
Table 1.3 indicates the land use pattern for the whole Somali region by Zone. It was adopted from the Somali National Regional State (2003). Sparse vegetation and mixture of shrub and grassland are found all over the region making grazing and collecting wood the main stay of the inhabitants (Figure 1.3). Herbaceous plants are common over the riverbanks and in areas of wet ground. It is possible to see open grasslands and rain fed crop cultivation in the central and northern high ground areas.
Zone Cropped Woodland Grazing Unproductive Total
Shinile 20 284 126 3116 3546 Jijiga 422 678 612 8 1720
Fiq – 190 1506 204 1900
Degehabur -- 698 1988 634 3320 Korahe – 1332 1351 186 2869 Gode 8 966 1632 334 2940 Afder – 2026 2106 2804 6936 Warder – 2766 2428 122 5316 Liben – 1135 2204 138 3477 Total 450 10,075 13,953 7546 32,024
8 Figure 1.3 Land cover classes for Somali regional state (Global land cover, 2009)
1.6DESIGN OF THE REPORT
9 2. LITERATURE REVIEW
2.1CONCEPT OF DROUGHT
Drought is a one of the extreme climatic phenomenon that can occur at any given time in all climatic zones with its characteristics varies significantly from region to region. In the Meteorological Glossary (Huschke, 1959) drought is defined as “a period of abnormally dry weather sufficiently prolonged for the lack of water to cause serious hydrological imbalance in the affected area.” In a similar fashion, UNISDR (2009) defines drought as “the naturally occurring phenomenon that exists when precipitation has been significantly below normal recorded levels, causing serious hydrological imbalances that adversely affects land resource production systems.” Another definition is given by the Encyclopedia of World Climatology (2004) as “the consequence of a natural reduction in the amount of precipitation received over extended period of time, usually a season or more in length, although other climatic factors (such as high temperature, high winds, and low relative humidity) are often associated with it in many regions of the world and can significantly aggravate the severity of the event”. The above three definitions, drought is emphasized as an insidious natural hazard result from deficiency of precipitation from the normal or expect amount. In addition, it was stated that any discussion involving drought show give due emphasis to the precipitation deficit varying through particular precipitation-related activity that is under discussion. Moreover, drought should directly related to the timing and the effectiveness of the rains.
10 universal definition of the drought and the third reason was non-structural and wide spread consequence of the event. Most importantly, the absence of concise and universally accepted definition of drought adds to the confusion about whether or not a drought exists and if it does its degree of severity. Mishra and Singh (2010) argued that drought is normal, recurrent and inevitable climatic feature. The complexity of drought as indicated in Jupp et al. (1998) and Mishra and Singh (2010) is defining the onset of drought event. For these authors, the onset of drought begins when the balance between rainfall, evapotranspiration and discharge leaves less available water in the soil storages accessible by plants than they and/or animals, which depend upon them, need to maintain health. As a result of the imbalance the available moisture will be below point where harm is induced to vegetation and thereby to people and animals. Thus, defining all these indirect parameters is one of the challenges for drought analysis. Others tried to explain onset of drought in terms of the lag between soil moisture replenishment and the response of the vegetation and the dependent animals and people (Tadesse, Wardlow and Ryu, 2008).
Timing and the effectiveness of precipitation could also define the extent and complexity of drought. Nevertheless the onset and end of drought is difficult to determine that give rise to continue debate on the issues across scientist and policy makers (Nagarajan, 2009). The other challenge to fully understand drought stemmed from the impact that impose on the large geographical areas contrary to other natural hazards such as earthquake (Byun & Wilhite, 1999; Nagarajan, 2009; Wilhite, Drought, 2007). Quantifying the impacts are far more difficult tasks for drought than they are for other natural hazards. These characteristics hindered the development of accurate, reliable, and timely estimates of severity and impacts and, ultimately (WMO, 2006). Thus, each drought event is unique in its climatic characteristics, spatial extent, and impacts. As drought emerges and intensifies, its core area shifts and its spatial extent expands and contracts throughout the duration of the event.
2.1.1 TYPES OF DROUGHT
11
I. Meteorological drought: Meteorological drought has the same context and
definition used in the beginning of this chapter. It is defined as the degree of dryness, which is often compared with the normal/average dry period for very long time. Wilhite and Glantz (1985) proposed a technique to define meteorological drought. They said that the term dryness is context dependent, and varies across different climatic region. As example, Drought for United States is when rainfall value less than 2.5mm in 48hours while for Libya, annual rainfall less than 180mm is the threshold (Wilhite & Glantz, Understanding the drought phenomenon: The role of definitions, 1985). This indicates that meteorological drought definition should vary from country to country. It should be defined according to specific atmospheric condition over a region. The atmospheric conditions that result in deficient must be expressed solely on the basis of the degree of dryness and the duration of the dry period (Agnew & Chappell, 2000). Thus, intensity and duration are the key characteristics of these definitions.
II. Agricultural drought: This type of drought generally refers to a period with
declining soil moisture that could affect crop production or other utilization of the water resource (Wu & Wilhite, 2004; Wilhite, 2000). Agriculture is usually the first sector to be affected by drought because soil moisture supplies are often quickly depleted for plant growth. It is linked to various characteristics of meteorological drought to agricultural impacts, focusing on precipitation shortages, differences between actual and potential evapotranspiration, and soil water deficits (Agnew & Chappell, 2000). Plants water requirement depends on the physiography and/or the prevailing climatic condition and more often to the biological characteristics of the plant itself. This type of drought are very difficult to discriminate from the other meteorological and hydrological drought since there is no easy way to separate water leaving from ground and water leaving from plant leafs. A plant‟s demand for water is dependent on prevailing weather conditions, biological characteristics of the specific plant, its stage of growth, and the physical and biological properties of the soil.
III. Hydrological drought: Hydrological droughts are associated with the effects of
12 deficiencies relative to average conditions at various points in time (UNISDR, 2009). It is related to a period of inadequate water availability for the use of a given resource management system (Mishra & Singh, 2010). They stated that, hydrological drought result from stream flow to catchment properties is usually attributed to geology than climatic factors. Like agricultural drought, there is no direct relationship between precipitation amounts and the status of surface and subsurface water supplies in lakes, reservoirs, aquifers, and streams because these hydrological system components are used for multiple and competing purposes, such as irrigation, recreation, tourism, flood control, transportation, hydroelectric power production, domestic water supply, protection of endangered species, and environmental and ecosystem management and preservation. There is also a considerable time lag between departures of precipitation and the point at which these deficiencies become evident in surface and subsurface components of the hydrologic system (Tadesse, Wardlow, & Ryu, 2008; UNISDR, 2009).
IV. Socioeconomic drought: In figure 2.1, we can see that drought affects so many
economic and social sectors. In the beginning of this chapter, it was indicated that the extent of drought is variable across different region and across time. The socioeconomic drought is associated with the supply and demand of some economic good or service with elements of meteorological, hydrological, and agricultural drought (figure 2.1). It differs markedly from the other types of drought because it reflects the relationship between the supply and demand for some commodity or economic good that is dependent on precipitation (UNISDR, 2009; Wilhite & Glantz, 1985). Supply and demand for commodities are reflection of the climatic behavior of a particular region. In under developed agrarian society, supply is dependent on the prevailing climate condition and is a function of precipitation, even if the demand remains the same. Thus, the socio economic activities of an agrarian society vary annually as a function of precipitation or water availability. Other example like population size can also alter substantially the demand for economic goods over time. For instance, people who are economical poor, and depend on the prevailing climate condition to survive could be more affected than areas with multiple sector economy.
13 Figure 2.1 Relationship between the various forms of drought (after UNISDR, 2009)
2.2DROUGHT CHARACTERISTICS AND SEVERITY
14 country. From a planning perspective the spatial characteristics of drought have serious implications.
Quantification of drought is usually determined by indices, and water balance simulations. Drought indices are particularly useful for monitoring the impact of climate variability on vegetation because the spatial and temporal identification of drought episodes is extremely complex.
Among the major meteorological indices, the palmer drought severity index (PDSI), Standardized Precipitation Index (SPI) and Crop Moisture Index (CMI) are more commonly used (Byun & Wilhite, 1999). As an example, the Palmer Drought Severity Index (PDSI), which is modified version of the Palmer Index (PI) and Crop Moisture Index (CMI) are indices of the relative dryness or wetness affecting water-sensitive economies (McKee, Doesken, & Kleist, 1995). The Palmer Drought Severity Index (PDSI) is a meteorological drought index that responds to weather conditions that have been abnormally dry or abnormally wet. It is based on precipitation, temperature and soil moisture variables. The PDSI varies from values of +6.0 to -6.0 with a classification scale indicating relative meteorological and hydrological development cycles.
The Palmer Index uses temperature and rainfall information to determine dryness (Palmer, 1965). This index is effectively implemented by the World Meteorological agency as the most effective in determining long term drought indicator nevertheless cannot serve for short term phase of drought. It uses 0 as normal, and drought is shown in terms of minus numbers.
15 reason that the mean SPI for a given location and time period be zero. Every positive value indicates greater than the mean precipitation is wet region and every negative value less than the median across the normal distribution are drier regions. Since SPI is normalized, wetter and drier climates can be represented in the same way, and wet periods can also be monitored using the SPI.
CMI uses a meteorological approach to monitor week-to-week crop conditions. It was developed by Palmer (1968) from procedures within the calculation of the PDSI. Whereas the PDSI monitors long-term meteorological wet and dry spells, the CMI was designed to evaluate short-term moisture conditions across major crop producing regions. It is based on the mean temperature and total precipitation for each week within a climate division, as well as the CMI value from the previous week (Neimeyer, 2008; McKee, Doesken, & Kleist, 1995; Mishra & Singh, 2010).
In summary, PI has certain advantages over others such as use of rainfall data alone and also its variable time scale, which allows it to describe drought conditions important for a range of meteorological, hydrological and agricultural applications. SPI is also very good indicator of drought from the normal precipitation period.
In Ethiopia, precipitation data is used to monitor the extent and on set of drought. NMA provides vital information using SPI as tool to monitor drought. Those affected region is being supplemented with the best available information and tools to assess the potential impacts of drought and to better prepare for and mitigate the effects of drought (NMA, 2007). NMA web site provides access to various meteorological datasets except drought-monitoring and forecast products. However, in the study area the density of meteorological station as well as the temporal scale of the data makes it impossible to monitor drought using neither of the above three indices. Therefore, this report uses Vegetation Temperature Condition Index (VTCI) as drought monitoring index. The following section illustrates the basic concept of VTCI and other similar indices.
16 The most common satellite-derived index is based on the behavior of vegetation in response to rainfall and amount of moisture available across a region. Vegetation derive indices has evolved over a period of time as a primary tool for monitoring vegetation changes and interpretation of the impact of climatic on the surface. Various forms of vegetation indices based on remote sensing data have been used to monitor vegetation that indirectly monitor drought, with the most widely adopted being the Normalized Difference Vegetation Index, NDVI. Kriegler, et al.(1969) were the first to propose NDVI and it is calculated by subtracting the red channel from the near-infrared (NIR) channel and dividing their difference by the sum of the two channels,
NDVI= (NIR - RED) / (NIR + RED)
where, RED = the red portion of the electromagnetic spectrum (0.6-0.7 μm) and NIR = the near infrared portion of the electromagnetic spectrum (0.75-1.5 μm). Green and healthy vegetation reflects much less solar radiation in the visible (channel 1) compared to those in the near-infrared (channel 2). More importantly when vegetation is under stress, the channel 1 value may increase and the channel 2 values may decrease. The NDVI were generated using the radiation measured in red and near infrared spectral channels. Because of close relationship between vegetation and available soil moisture, NDVI was widely used to evaluate drought condition by directly comparing it to precipitation or drought indices. It is indicated that NDVI not only assessment the behavior of vegetation over time, it can monitor the rainfall and drought situation. The data used in compiling the NDVIs are closely related to the radiation absorbed and reflected by vegetation in the photosynthetic processes.
17 sensitivity of surface temperature to soil moisture variations differs for the leaf and surface soil around the plants, and tends to much greater between areas of bare soil rather than across the leaves. This basic idea is the bases for determining the scatter space to monitor the soil moisture content. The basic idea we have to use NDVI/LST relationship is because, NDVI alone cannot provide real estimate of vegetation condition since leaf area, soil background, and shadow produces error on the reading of the visible and near-infrared reflectance from plant (Yang, Yang, & Merchnat, 1997; Carson, Gillies, & Perry, 1994).
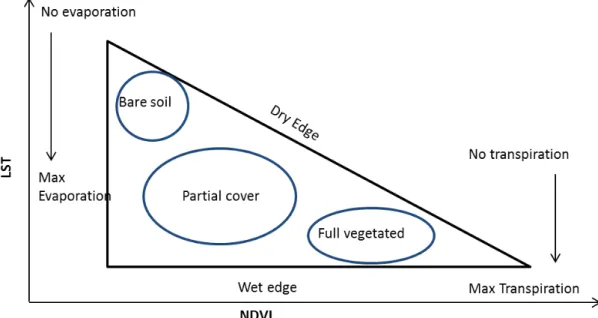
The empirical concept of NDVI/LST to derive soil moisture conditions often results in a triangular shape if an area is large enough to provide wide range of NDVI values from bare soil to fully vegetated surfaces and the soil moisture from wet to dry condition (Wang et al 2001 and Sandholt et.al 2002). The basic concept of the NDVI/LST is shown in Fig 1. Full vegetated surface values plotted with in the lower right region and the bare soil plotted in the upper left corner of the scatter plot and while the partially covered surface found between the two.
Carlson (2007) argued that identification of the triangular shape in the pixel distribution requires large number of pixels over an area with a wide range soil wetness and fractional vegetation cover. The base of the triangular shape (i.e. wet edge) and slope of the triangle (i.e. dry edge) represent the wettest and driest condition of the soil surface respectively (fig 3.1). The location of a pixel in the NDVI-LST space is influenced by many factors. One of the factors is evapotranspiration that can largely control the surface temperature through the energy balance of the surface (Weng, Lu, & Schubring, 2004). The lesser the evaporation the less sensible heat removal from the surfaces and thus resulting in higher surface temperature. Transpiration, in which water vapor is released from the stomata of plants, is partly controlled by soil moisture availability. That is, the less the transpiration is, the drier the soil surface is.
18 LST and NDVI products. The reason behind that was to see how NDVI/LST varies across time within the context of particular period of drought. The warm edge is determined by using the each year maximum value for each rainy season on composite LST and NDVI products, while the wet edge is determined by using the each year maximum–minimum value composite LST products. Within the triangle space, LST decreases with the increasing NDVI values, especially in the dry edge, and there is sometimes no significant variability of LST along with the wet edge. The triangle exhibits a slight variation in LST at dense vegetation where dry edge and wet edge begin to merge (the top vertex of the triangle). In order to determine the parameters for VTCI, the boundary of the triangle space, the maximum and minimum temperature observed for small intervals of NDVI can be extracted in the LST/NDVI triangle space.
Figure 2.1 NDVI/LST feature space relationships (After Sandholt, et al. 2002)
2.4 CASE STUDIES USING LST, NDVI AND VTCI AS DROUGHT MONITORING INDEX
19 NOAA-AVHRR NDVI. The study used NDVI patterns in growing season, which were defined by examining the long-term patterns of both rainfall and NDVI. The correlation between NDVI and rainfall anomaly time series was found to be positive and significant, indicating the close coupling between rainfall and land surface response patterns over the region.
A study on temporal responses of NDVI to precipitation and temperature in the central Great Plains, USA by Wang et al. (2003) indicated that there was a strong relation between the average growing season NDVI with precipitation received during that growing season and seven preceding months. Similar study was undertaken by Ji and Peters (2003) to assess vegetation response in the northern Great Plains using vegetation and drought indices. The study was aimed to determine the response of vegetation to moisture availability through analysis of monthly AVHRR-NDVI and SPI over grass and cropland cover in the northern U.S, Great Plains. It focused on three major areas namely the relationship between NDVI and SPI at different time scales, response of NDVI to SPI during different time periods within a growing season and regional characteristics of the NDVI-SPI relationship. They concluded that there was a strong correlation between the SPI and NDVI in the different growing seasons.
The pattern of Surface temperature distribution over the city of Ho chi Minh, Vietnam was carried out through the use of thermal remote sensing by Van et al. (2009). They used Landsat and ASTER satellite images to extract the land surface temperature (LST). In this study they emphasized that it is not possible to engage meteorological stations everywhere, therefore, temperature derived from thermal remote sensing methods were used as an alternative temperature estimation with less than 2 degree deviation from actual measurement.
20 VTCI is a very good monitoring technique. According to the authors, the use of MODIS derived vegetation indices has a number of advantages over meteorological drought indices. It has spatial high density of data collection that covers very large areas which can facilitate data compilation from lands with a low density of weather stations.
Vogt et al. (1998) compare meteorological data with satellite images to monitor drought using empirical indices such as NDVI, Vegetation Condition Index VCI and Temperature Condition Index TCI over the region of Andalucía, Spain. They calculated NDVI and surface temperature with the help of split window algorithm. The resulted showed that TCI and VCI produced vegetation change according to the water stress and demonstrates the degree of spatial resolution to be obtained.
A statistical correlation analysis algorithm between land surface temperature and vegetation index illustrated the land cover detection on urban area of Chollpuk do Kunsan city area in China by Kim et al (2005). They evaluated the relationship between NDVI and LST to determine land cover detection over the urban area. As stated in the paper, a negative correlation between NDVI and LST on a scatter plot is very efficient in the field of land cover detection.
21
3. METHODOLOGY
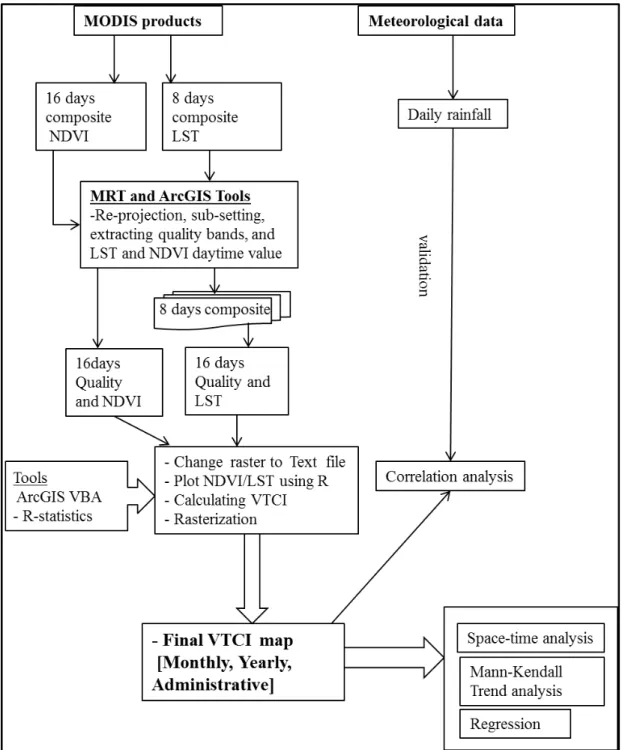
The following framework illustrates the general workflow of the methodology which is briefly discussed on the next section.
22 3.1DATA SET
3.1.1 SATELLITE DATA
Moderate Resolution Imaging Spectoradiometer (MODIS) was launched onboard the National Aeronautics and Space Administration (NASA) Earth Observing System (EOS) Terra and Aqua platforms on 1999 and 2002, respectively. The instrument is a scanning spectroradiometer with 36 visible (VIS), near-infrared (NIR), and infrared (IR) spectral bands between 0.645 and 14.235 mm (King et al. 1992). After the launch, it brings many opportunities to study atmospheric temperature, soil moisture, land use change, vegetation change and other environmental aspects. These wide spectral range, high spatial resolution, and near-daily global coverage of MODIS enable it to observe the earth‟s atmosphere and continuously monitor changes. MODIS retrievals of atmospheric water vapor and temperature distributions are intended to advance understanding of the role-played by energy and water cycle processes in determining the earth‟s weather and climate. These MODIS temperature and moisture data can be used in numerical weather prediction models in regions where conventional meteorological observation are sparse.
The Normalized Difference Vegetation Index (NDVI) and Land surface temperature (LST) were derived from the MODIS level-3 products, MOD11A2 and MOD13A2 respectively. Reflectance and LST data are rescaled to the 16 day temporal resolution and 1km spatial resolution. All the products of NDVI and LST are then subjected to the geometric correction. NDVI data set is available on a 16 day basis for the five distinct years of 2000, 2003, 2007, 2010 and 2011. The product is derived from bands 1 and 2 of MODIS on board NASA's Terra satellite. While the LST product the same terra platform, the 8-days composite value with 1km resolution was obtained for further analyzing the relationship between LST and NDVI.
3.1.2 RAINFALL AND TEMPERATURE DATA
23 3.1.3 ANCILLARY DATA
Land use/cover map of the study area were extracted from the Global Land cover facility for 2009 and from the SNRS report. The land cover map from global land cover facility contains more than 45 classes ranging from water bodies to the barren land. In order to generalize the study area, we reclassified land cover types in to five classes. These classes are used to concurrent the value of NDVI/LST for the analysis. [Percentage of the type of vegetation cover]
3.2 DATA PROCESSING AND ANALYSIS 3.2.1 PREPROCESSING
The first step was to change the NDVI and LST product from Sinusoidal projection, which is not supported in ArcGIS, in to usable spatial information. The MODIS Reprojection Tool (MRT) is software designed by NASA‟s Land Processes Distributed Active Center (LP DAAC) which is readily available on NASA website. (https://lpdaac.usgs.gov/tools/modis_reprojection_tool) With the use of MRT, all the images were projected into Geographic with WGS84 datum and clipped with the extent of the study area. We also extract the daytime 1km LST, NDVI, and quality bands using MRT.
Land Surface Temperature Product
24 consecutive periods were averaged to generate composite LST for the same periods as the NDVI to match the 16-days NDVI composite product.
Bits Long Name Key
1 and 0 Mandatory QA flags 00 = LST produced with good quality and no need to examine detailed quality
01 = LST produced with quality that should be examined more detailed
10 = LST not produced due to cloud effects
11 = LST not produced primarily due to reasons other than cloud
3 and 2 Data quality flag 00 = good data quality 01 = other quality data 10 = TBD
11 = TBD
5 and 4 Emissivity Error flag 00 = average emissivity error <= 0.01 01 = average emissivity error <= 0.02 10 = average emissivity error <= 0.04 11 = average emissivity error > 0.04
7 and 6 LST error flag 00 = average LST error <= 1k 01 =average LST error <= 2k 10 =average LST error <= 3k 11 = average LST error > 3k
Table 3.1 Quality flag explained for SDCs Normalized Difference Vegetation Index
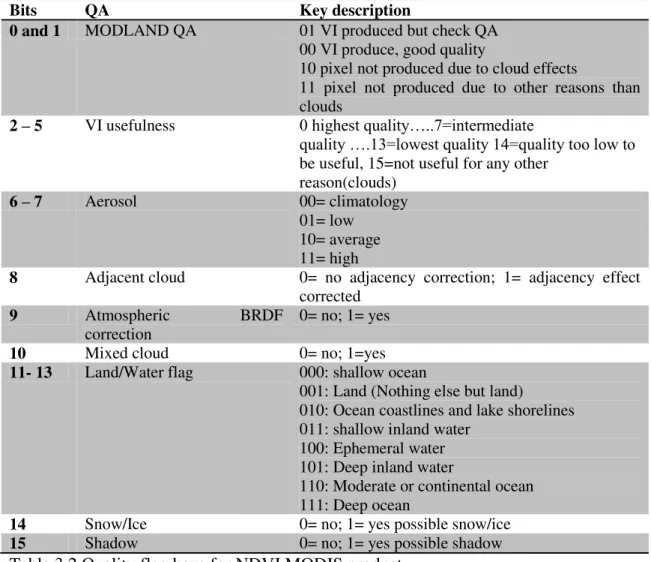
The MOD13A2 is also a level-3 product. Among 11 SDSs of this product, 16-day composite NDVI, quality for each NDVI pixel, for each NDVI pixel were employed. The NDVI is encoded in 16-bit signed integer, ranging from -2000 to 10000, divided by 10000 to obtain NDVI in its original value. The quality information is encoded in 16 bits that compose 10 bit fields. Among these bit fields, only pixels with better than average qualities were used. NDVI values less zero where excluded from further analysis, since pixel value less than zero assumed to represent either cloud contaminated imagery or presence of water body.
25 From the calculated VTCI values, raster representations were also created within ArcGIS 9.3.
Bits QA Key description
0 and 1 MODLAND QA 01 VI produced but check QA
00 VI produce, good quality
10 pixel not produced due to cloud effects
11 pixel not produced due to other reasons than clouds
2 – 5 VI usefulness 0 highest quality…..7=intermediate
quality ….13=lowest quality 14=quality too low to
be useful, 15=not useful for any other reason(clouds)
6 – 7 Aerosol 00= climatology 01= low
10= average 11= high
8 Adjacent cloud 0= no adjacency correction; 1= adjacency effect corrected
9 Atmospheric BRDF correction
0= no; 1= yes
10 Mixed cloud 0= no; 1=yes
11- 13 Land/Water flag 000: shallow ocean
001: Land (Nothing else but land)
010: Ocean coastlines and lake shorelines 011: shallow inland water
100: Ephemeral water 101: Deep inland water
110: Moderate or continental ocean 111: Deep ocean
14 Snow/Ice 0= no; 1= yes possible snow/ice
15 Shadow 0= no; 1= yes possible shadow
Table 3.2 Quality flag keys for NDVI MODIS product
3.2.2 ANALYSIS OF NDVI/LST RELATIONSHIP
26 The scatter plot was then prepared for each approach with LST and NDVI and the least square root method was used for determination of the warm edge and wet edge. Warm edge can be determined by upper limit of scatter plots, which are plotted with maximum, and minimum of LST having same value of NDVI.
3.2.3 VEGETATION TEMPERATURE CONDITION INDEX (VTCI)
VTCI was modified and developed by Wan (2001) to assess drought by combining the vegetation and temperature stress. VTCI determines the warm edge and wet edge by plotting against the NDVI and LST. 16 days average for NDVI and LST images were produced. We applied maximum value compositing to the NDVI and LST images in May and October for 2000, 2003, 2007, 2010 and 2011.
VTCI defined as:
VTCI = (LST NDVI imax - LST NDVI i) / (LST NDVI imin – LST NDVI i min)
Where LST NDVI imax = a + b NDVI i
LST NDVI imin = a` + b` NDVI i and, LST NDVI imax and LST NDVI imin are
maximum and minimum land surface temperatures of pixels which have same NDVIi value in a study region, respectively.
LST NDVI imax, , denotes land surface temperature of one pixel whose NDVI value is
NDVIi a , b , a’ and b’ are coefficients and that should be estimated on pixels from an area large enough to comprise the whole span of soil surface moisture content, from field capacity to wilting point.
The coefficients were derived from those edges by fitting least square regression procedure. In the above equation, a and a’ are intercept and b and b’ are the slope of the dry and wet edges respectively. Then, based on the space of NDVI/LST, the VTCI was calculated for each pixel using ArcGIS 9.3.
27 on the surface. The value of VTCI ranges from O to 1. Pixel values less than 0.4 are categorized as high drought areas (Sun et al. 2011 and Wang et al., 2001).
3.2.4 REGRESSION AND CORRELATION ANALYSIS
Monthly precipitation data that was obtained from National Meteorological agency were used to generate a monthly rainfall data by deducting a normal period rainfall with from drought period rainfall data. This difference rainfall was then compared with the VTCI.
28 4. RESULT AND DISCUSSION
4.1SCATTER SPACE OF NDVI VERSUS LST
The composite NDVI and LST products for each 16 days in 2000, 2003, 2007, 2010 and 2011 were used to determine the wet and dry edges as shown in Figure 4.1. The upper limits of the scatter plots represent dry edge (LSTmax) and lower limits of the scatter plots represent the wet edge (LSTmin).
The scatter plots of NDVI versus LST shows that the range of NDVI and LST variability is so sufficient that it can clearly define the triangle space. Within the triangle space, LST decreases with the increasing NDVI values, especially near the “dry edge”, and there is no significant variability of LST along with the “wet edge”. The triangle exhibits a slight variation in LST at dense vegetation where dry edge and wet edge begin to merge (the top vertex of the triangle). In order to determine the parameters describing the boundary of the triangle space, the maximum and minimum temperature observed for small intervals of NDVI were extracted in the LST/NDVI triangle space.
29 Figure 4.1NDVI/LST Scatter space over the DOY in the whole study
30 river. The scatter space of LST- NDVI as a function of NDVI for each image is showed in Figure (4.1)
Inverse relation is observed for most of the LST/NDVI space i.e. when surface temperature increases, the amount of NDVI value decreases. This is the most common behavior found in grassland, sparse vegetation and low-density force areas. There are some exceptional DOY in the time series. One of them is 145 DOY in 2010, where there are pixel values that has high surface temperature and high NDVI value.
31
DOY Year Dry edge Wet edge
Equation R2 Equation R2
129 2000 LSTNDVImax = -43.2NDVI + 339 0.95 LSTNDVImin = 0.1NDVI + 287 0.01
2003 LSTNDVImax = -43.1NDVI + 336 0.96 LSTNDVImin = -1.2NDVI + 292 0.01
2007 LSTNDVImax = -42.3NDVI + 336 0.97 LSTNDVImin = -4.2NDVI + 298 0.16
2010 LSTNDVImax = -37.1NDVI + 332 0.92 LSTNDVImin = -0.6NDVI + 294 0.01
2011 LSTNDVImax = -36.7NDVI + 333 0.96 LSTNDVImin = 1.7 NDVI + 290 0.07
145 2000 LSTNDVImax = -35.9NDVI + 330 0.97 LSTNDVImin = 0.39NDVI +292 0.08
2003 LSTNDVImax = -37.8NDVI + 334 0.97 LSTNDVImin = 6.5NDVI + 287 0.16
2007 LSTNDVImax = -40.3NDVI + 333 0.97 LSTNDVImin = -0.5NDVI + 291 0.00
2010 LSTNDVImax = -18.7NDVI + 328 0.86 LSTNDVImin = -3.3 NDVI + 291 0.03
2011 LSTNDVImax = -28.2NDVI + 325 0.92 LSTNDVImin = -2.6NDVI + 293 0.05
289 2000 LSTNDVImax = -36.8NDVI + 332 0.95 LSTNDVImin = 0.2NDVI + 292 0.01
2003 LSTNDVImax = -33.4NDVI + 331 0.95 LSTNDVImin = 1.6NDVI + 291 0.04
2007 LSTNDVImax = -28.9NDVI + 332 0.84 LSTNDVImin = 0.7NDVI + 286 0.00
2010 LSTNDVImax = -35.2NDVI + 333 0.89 LSTNDVImin = 2.6 NDVI + 286 0.04
2011 LSTNDVImax = -36.9NDVI + 333 0.97 LSTNDVImin = 3.9NDVI + 287 0.06
305 2000 LSTNDVImax = -35.8NDVI + 331 0.97 LSTNDVImin = 0.3 NDVI + 287 0.01
2003 LSTNDVImax = -35.5NDVI + 330 0.95 LSTNDVImin = 8.6 NDVI + 284 0.33
2007 LSTNDVImax = -35.3NDVI + 334 0.91 LSTNDVImin = 3.9 NDVI + 286 0.05
2010 LSTNDVImax = -31.2NDVI + 331 0.91 LSTNDVImin = -3.3NDVI + 299 0.18
2011 LSTNDVImax = -34.1NDVI + 331 0.96 LSTNDVImin = -2.5NDVI + 294 0.03
Table 4.1 Wet and dry edge linear regression equation.
From the scatter space, drier areas were characterized by low NDVI and high temperature while high NDVI values and low LST represents wetter condition. Our primary assumption to use the end of each rainy season for the scatter space was to produce enough pixels that contain wide range of values from the wet to dry condition. The wet and dry edges are presented for each drought years in Table 4.2. The slope of Dry edge indicates the LSTmax decreasing as NDVI increases for every NDVI interval. The positive slope of wet edge in the scatter space indicates the LSTmin increasing as NDVI increases. We found R2 values around 0.9 for dry edge indicating best fitted model that can explain the variability of the LSTNDVImax for most of the dry edge regressions. While for the wet edge regression, the values are close to 0.0. According to Sandholt et al. (2002), the value ranges from 0.23 to 0.81. Our wet edge regression result is very similar to the resulted reported by Wan et al. (2004), R2
for VTCI varied from -0.16 to 0.63 with a mean of 0.23.
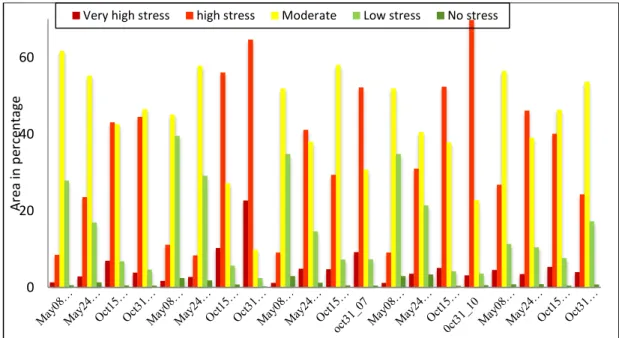
32 4.2TEMPORAL PATTERN OF VTCI
According to the literature, drought is apparent when the value of VTCI threshold is below the value of 0.4 and severity of drought will decline when the values is more than 0.4. The meteorological drought indicates deficiency of rainfall compared to the normal rainfall event. The time series data of the VTCI were used to analyses the trends of drought occurrence. VTCI values in the first 16days and the second 16 days of May and October in 2000, 2003, 2007, 2010 and 2011 in the study area are shown in figure 4.3. The worst situation was encountered during 2003 and 2010 year of
dihra (main rainy season) season when more than 60% and 45% of the region suffered drought condition respectively. A consistently low value of VTCI were found in each time series ranging from 10% to 87% areal coverage in first 16-days of May 08, 2000 and 16 days of October 31, 2003. In our analysis, the Dihar season denotes 129 and 145 DOY and the Gu season encompass the 289 and 305 DOY. During the dihra season of 2003, the vegetation experienced more stress when compared to the other rainfall season. In the recent year of 2011, Du (little rainy season from April to June) shows an increasing in drought intensity and area coverage for more than 30% the whole study area. This is one of the most challenging natural even for the agro pastoralist people in the region. Since the moisture supply rainfall is losing its influence over part of the region.
The first 16 days of May (except 2011) and the next 16 days of May for 2003 and 2010 exhibits low drought condition contrary to the first and the second 16 days of October 2003 denoted 67% and 87% of drought condition. Similarly, the second 16 days of October in 2010 affected 73% of the Somali region. The impacts of the vegetation stress for 2010 drought condition were also felt in next rainfall season for following year, 2011. It marked the highest vegetation stress of first 16 days of May to exhibit the highest areal coverage of drought (31%). This is an indication that, the Somali region is experiencing severe water stress not only in the Dihra season also in
Du for the period under discussion.
33 rest of the categories (Figure 4.2). The moderately stress regions are changing throughout the time series. The previously moderate regions are changing in to more stress region.
The highest (23%) and the lowest(1%) areal extent of drought in the study area are having values less than 0.2 in the second day of October 2003 and in the first 16 days of May 2007 and 2010 respectively. The moisture content of vegetation as well as moisture content of the soil were the highest in the first 16 days of May for 2003, 2007, 2010 and as well as in the second days of May in 2003.
Figure 4.2 VTCI as divided into five level of drought
0 20 40 60
Are
a
in
p
e
rce
n
ta
ge
34
35
(b)Dihra Season, the first and second 16days of October
36 Figure 4.4 Areal percentage of drought over the time series based on VTCI value
The lowest (less than 0.2) VTCI that covers more than 20 percentage of the study area was recorded in late day of October 2003. In the same year, values less than 0.4 indicating less water availability and high instance of drier vegetation occupied half of the Somali region. This is highly in agreement with the lowest average rainfall in the meteorological stations. Again the year 2003 denotes high level of vegetation stress condition than the other drought year.
More than half of the study areas were affected by drought during the Dihra season. It was observed that the annual cycle of vegetation in region is basically bi-modal similar to the rainfall regime even if one of the rainfall season, Dihra is gradually losing its influence. Thus, recurrent low VTCI over several time intervals indicates more extension and development of drought through the time series.
0 20 40 60 80 100
A
rea
l
p
er
ce
n
tag
e
Areal percentage of drought and no drought
37 Figure 4.5 Drought affected areas for the five drought years.
The magnitude and the areal extent of severe drought condition increased from 129 to the 305 DOY. In the first 16 days of May, we found that 47% of the region experience one or more time of vegetation stress for the period under discussion. In the second 16 days of October as well as in the first days of October experienced unexceptionally continuous drought condition form 2000 to 2011 that covers 96% and 91% of the region.
4.3SPATIAL PATTERN OF VTCI
38 variable land cover in the Somali region. The bare soil region in the Shinile and partly in Afder zone never exhibit wet condition throughout the period under discussion (Figure 4.6). The sandy soil that is exposed to direct scorching sun cannot retain water and of course no photosynthesis activity. The pastoralist sometimes practice agriculture and cultivates crops when there is enough rainfall. Cultivation of cereal crops is common practice in the lower valley of Genale-dawa river in Gode and much of Jijiga, and Degebur zone. Despite the increase intensity of drought in the other regions, these region experience wetter condition and denotes higher value of VTCI than the rest of the place. From the values coefficient of variation, it‟s possible to comment that the aforementioned regions exhibit less variability of VTCI value with less than 10% variation from the mean.
39 The Eastern part of Somali region, especially in two of the zone; Warder and Korhane, showed continuous dry condition all the year specified. In Dege Habur region, where most of land is cover with sparse vegetation, drought stress condition is common. In the same region, pocket of rain fed vegetation exhibit moderate level of drought condition (Figure 4.6a). Korhane zone is also predominantly covered with sparse vegetation and partly grassland. These types of vegetation usually remain dry for longer time making the severity index difficult to accurately estimate. More to the eastern region, Warder zone shows very strong drought condition. Again, the same vegetation indicates that there is very strong drought over the region (Figure 4.6b). The herbaceous plants and small farm land in Gode zone, reveals much higher VTCI value than the remaining land cover over the zone (Figure 4.6d). Since, the herbaceous plants and the farm land are found next to river, the value of VTCI produced high contrasting value. The grassland found in Liben zone is relatively less stressed than the other land cover in the surrounding. Moderately affected areas are found in the high elevated region. If even the correlation between elevations with VTCI doesn‟t suggest association, it was apparent that the overall values of the vegetation stress are lower for low lying areas in the eastern region and higher for area above 2000m.
40 Figure 4.7 Drought affected areas for the past 10 years based on VTCI value
41 4.4VTCI and PRECIPITATION
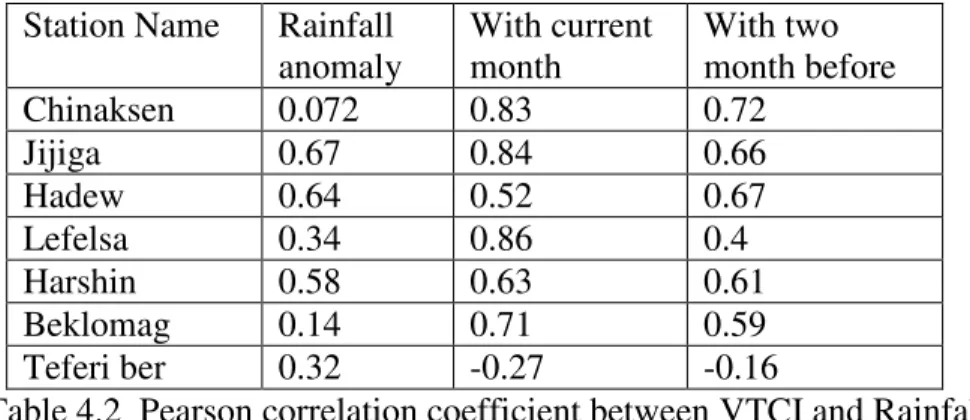
Statistical relationships between rainfall anomaly, time lag periods of rainfall and VTCI were investigated by using Pearson correlation analysis for seven meteorological stations over the region (Table 4.3).
Station Name Rainfall anomaly
With current month
With two month before
Chinaksen 0.072 0.83 0.72
Jijiga 0.67 0.84 0.66
Hadew 0.64 0.52 0.67
Lefelsa 0.34 0.86 0.4
Harshin 0.58 0.63 0.61
Beklomag 0.14 0.71 0.59
Teferi ber 0.32 -0.27 -0.16
Table 4.2 Pearson correlation coefficient between VTCI and Rainfall
The cumulative anomaly for the month of October and May was calculated based on the long term average value. We subtract the current year rainfall from the mean and divide it by the average rainfall for that particular month and then multiple it 100. Some of result we found as shown in Table 4.3 was not satisfactory since the long term mean rainfall was calculated from a limited rainfall data. However, good result was obtained when we make correlation analysis between the VTCI value with current month, and with two preceding months. For Chinaksen and Jijiga stations shows high correlation with the current as well as the two preceding months. In two of the stations, Hadew and Teferi ber, Lefelsa (preceding months) the correlation coefficient suggested that there is weak association between the rainfall recorded and the vegetation condition calculated. It can be further implied that, the behavior of rainfall for the past two month could affect condition of vegetation.
The VTCI time series profile in the seven stations didn‟t produce similar fluctuation in the profile of the rainfall anomaly, but the rainfall with current and preceding months has similar fluctuation at least for six of the station which indicates that the VTCI is could be a real time drought monitoring approach.
42 amount of rainfall the smaller the VTCI value and the higher the occurrence of severe drought.
4.5TREND ANALYSIS
Mann-Kendall trend test was used to determine if there is any observable trend over the drought years. Based on the test, we found that there was no observable trend in any of the town selected except one Bur town. From least square analysis, we found out those towns which are found in the central and eastern part of Somali, illustrate decreasing line of regression suggesting more drought year to come. It could also mean these regions are gradually losing moisture in the ground as well in the plant leaf.
Figure 4.8 VTCI Trend across the study area
43
Zone Town Liner regression Mann-Kendall
Trend Shinile Aydora y = -0.0032x + 0.1631 No Trend Jijiga Lefe lsa y = -0.0001x + 0.3443 No Trend
Jijiga y = 0.0011x + 0.3585 No Trend
Teferi Ber y = 0.0056x + 0.3255 No Trend Harshin y = -0.0016x + 0.3622 No Trend Degehabur Degeh bur y = -0.0066x + 0.5282 No Trend Korahe Geledid y = -0.0077x + 0.5302 No Trend Korahe y = -0.007x + 0.4743 No Trend Gode Kelafo y = -0.0092x + 0.4593 No Trend Afder Harqele y = -0.0057x + 0.5113 No Trend
Yet y = -0.0001x + 0.4861 No Trend Badni y = 0.003x + 0.4252 No Trend Warder Geldain y = -0.0058x + 0.4427 No Trend Welwel y = -0.0061x + 0.469 No Trend Danot y = -0.0043x + 0.4763 No Trend
Liben Bur y = 0.0078x + 0.3551 Trend
Bekolmag y = 0.0019x + 0.475 No Trend
Table 4.3 Linear regression and Trend over selected town
From the previous analysis, we have seen that the month of October showed more severe drought condition than month of May. We, therefore, analysis the trend of October VTCI from 2000 to 2011 and present as indicated in Figure 4.9.
45 5. CONCLUSION
The spatial and temporal characteristics of droughts in Somali region were examined using Vegetation Temperature Condition Index. The study reveals that the eastern and southern regions are more affected by drought stress condition than the western and northern region. The VTCI maps on different time frame suggested that dihra
season is becoming more severely affected by drought than Gu season. This does mean the main rainfall of the region is decreasing its influence over the study area. The year 2003 and 2011 are considered the dries year that affect more than 60% of the region while the October being considered the driest month as compared to the month of May. We have also observed that there is strong relation between the rainfall distribution and drought potential areas in the region based on limited meteorological dataset. Besides, the VTCI value has certain level correlation with elevation. The higher elevated areas are higher the VTCI value. We have also observed that, low values of VTCI are found in each administrative zone in different time span. One drought year or another drought year, every part Somali region experiences certain level of drought throughout the time series.
It was also observed that the VTCI values indicating magnitude and spatial extents drought condition varies in accordance with season and on the type of land use/ land cover in the region. Based on the vegetation drought analysis, it was illustrated that there is significant correlation between the rainfall anomalies and VTCI over the region. This is a good indicator that VTCI can as drought monitoring index where is no sufficient rainfall information.
46 In Ethiopia, there is low spatial resolution of meteorological station as a whole very sparsely gauging at the study area. Continuous measurement of drought measurement variables like rainfall, soil moisture, discharges are impossible even if the National Meteorological Agency accepted SPI as a standard index of drought measurement. As result, where there is low spatial density of stations, the use of indices derived from remotely sensed data could be very useful to identify the temporal and spatial extent of drought at regional scale. Such indices as VTCI, which does not require data from ground base meteorological station, could led the basis for complete understand of drought and it manifestations over larger areas.
Our finding indicates that behavior of drought is very erratic and one of the seasons,
dihra is becoming very dry. This will have great implication for planner and policy makers who are actively engaged in the drought mitigation and preparedness. Therefore, our study partially demonstrated the use of vegetation temperature condition index for assessing the severity of droughts in the Somali region in particular and Ethiopia at large.
47 BIBLIOGRAPHIC REFERENCES
Agnew, C. T., & Chappell, A. (2000). Drought in the Sahel. GeoJournal(48), 299-311.
Andreson, M. C., Hain, C., Mecikalski, J., & Kustas, W. P. (2009). Monitoring drought at continental scales using thermal remote sensing. American Geophysical Union, 90(52).
Berhan, G., T, T., S, A., & S, H. (2011). Drought monitoring in food Insecure Areas of Ethiopia by using Satellite Tecnologies. In Experience of Climate change adaptation in Ethiopia. Berlin: Springer-Verlag.
Brown, E. M. (2008). Famine Early Warning systems and Remote sensing data.
Springer.
Brown, J. F., Wardlow, B. D., Tadesse, T., Hayes, M., & Reed, B. C. (2008). The vegetation drought responsive index (VegDRI): A new integrated approach for monitoring drought stress in vegetation. GIScience and Remote Sensing, 45(1), 16-46.
Brown, J., Tadesse, T., & Hayes, M. (2005). The role of remote sensing in improving drought decision support., (pp. 22-27). Pecora.
Byun, H. R., & Wilhite, D. (1999). Objective quantification of drought severity.
Journal of Climate, 12, 2747-2756.
Carlson, T. (2007). An overview of the Triangle Method for estimating surface evapotranspiration and soil moisture from satellite imagery. Sensors, 7, 1612-1629.
Carson, T. N., Gillies, R. R., & Perry, E. M. (1994). A method to make use of thermal temperature and NDVI measurements to infer surface soil water content and fractional vegetation cover. Remote sensing Reviews, 161-173. CSA. (2008). Retrieved Septmeber 24, 2011, from Central statistical agency,
Summary and statistical report of the 2007 population and housing census.: http://www.csa.gov.et/pdf/Cen2007_firstdraft.pdf
CSA. (2008). Summary and statistical report of the 2007 population and Housing census: population size by age and sex. Addis Ababa: Federal Democratic Republic of Ethiopian Population Census Comission.
EPEMRD. (2011). Climate Change: Impacts, Vulnerabilities and Adaptaion strategies in Somali Region. Jijiga: EPEMRD.