*e-mail: [email protected]
Prediction the Effects of ZnO
2Nanoparticles on Splitting Tensile Strength
and Water Absorption of High Strength Concrete
Ali Nazari*, Tohid Azimzadegan
Department of Materials Science and Engineering, Saveh Branch, Islamic Azad University, Saveh, Iran
Received: September 9, 2010; Revised: April 3, 2012
In the present paper, two models based on artiicial neural networks (ANN) and gene expression programming (GEP) for predicting splitting tensile strength and water absorption of concretes containing ZnO2 nanoparticles at different ages of curing have been developed. To build these models, training and testing using experimental results for 144 specimens produced with 16 different mixture proportions were conducted. The used data in the multilayer feed forward neural networks models and input variables of genetic programming models are arranged in a format of eight input parameters that cover the cement content (C), nanoparticle content (N), aggregate type (AG), water content (W), the amount of superplasticizer (S), the type of curing medium (CM), Age of curing (AC) and number of testing try (NT). According to these input parameters, in the neural networks and genetic programming models, the splitting tensile strength and water absorption values of concretes containing ZnO2 nanoparticles were predicted. The training and testing results in these two models have shown the strong potential of the models for predicting the splitting tensile strength and water absorption values of concretes containing ZnO2 nanoparticles. Although neural networks have predicted better results, genetic programming is able to predict reasonable values with a simpler method rather than neural networks.
Keywords: neural networks, genetic programming, nanoparticles, concrete, tensile test, water permeability
1. Introduction
Strength assessment of concrete is a main and probably the most important mechanical property, which is usually measured after a standard curing time. Concrete strength is inluenced by lots of factors like concrete ingredients, age, ratio of water to cementitious materials, etc. The pore structure determines the transport properties of cement paste, such as permeability and ion migration. Permeability of cement paste is a fundamental property in view of the durability of concrete: it represents the ease with which water or other luids can move through concrete, thereby transporting aggressive agents. It is therefore of utmost importance to investigate the quantitative relationships between the pore structure and the permeability. Through experimental studies and then numerical simulations of the pore structure and the permeability of cement-based materials, a better understanding of transport phenomena and associated degradation mechanisms will hopefully be reached1.
Conventional methods of predicting various properties of concrete are generally based on either water to cement ratio rule or maturity concept of concrete2. Over the last
two decades, a different modeling method based on neural networks (NNs) has become popular and used by many researchers for a wide range of engineering applications. NNs are a family of massively parallel architectures that
solve difficult problems via the cooperation of highly interconnected but simple computing elements (or artiicial neurons). Basically, the processing elements of a neural network are analogous to the neurons in the brain, which consist of many simple computational elements arranged in several layers3. The concrete properties could be calculated
using the models built with NNs. It is convenient to use these models for numerical experiments to review the effects of each variable on the mix proportions4-6. Besides
ANNs, genetic programming (GP) has begun to arise for the explicit formulation of the properties and the performances of concrete recently7,8. Genetic programming offers many
advantages as compared to classical regression techniques. Regression techniques are often based on predefined functions where regression analyses of these functions are later performed. On the other hand, in the case of GP approach, there is no predeined function to be considered. In this sense, GP can be accepted to be superior to regression techniques and neural networks. GP has proven to be an effective tool to model and obtain explicit formulations of experimental studies including multivariate parameters where there are no existing analytical models7,8.
In our previous works, the effects of different types of nanoparticles on physical and mechanical aspects of concrete specimens were studied9-27. The aim of this
Prediction the Effects of ZnO2 Nanoparticles on Splitting Tensile Strength
and Water Absorption of High Strength Concrete
absorption of several types of concrete with and without ZnO2 nanoparticles by ANNs and GP. Totally 144 splitting tensile strength and 144 percentages of water absorption data from 16 different concrete mixtures were collected, trained and tested by means of different models. The obtained results have been compared by experimental ones to evaluate the software power for predicting the properties of concrete.
2. Experimental Procedure
2.1.
Materials
Two series of concrete were made in the laboratory. The irst was normally vibrated concrete (NVC) series with ordinary river sand as aggregates and the second self compacting concrete (SCC) series with limestone aggregates. The utilized materials are as below:
Ordinary Portland Cement (OPC) conforming to ASTM C150[28] standard was used as received. The chemical
and physical properties of the cement are shown in Table 1. ZnO2 nanoparticles with average particle size of 15 nm and 45 m2.g–1 Blaine ineness producing from Suzhou
Fuer Import & Export Trade Co., Ltd was used as received. The properties of ZnO2 nanoparticles are shown in Table 2.
Locally available natural sand with particles smaller than 0.5 mm and ineness modulus of 2.25 and speciic gravity of 2.58 g.cm–3 was used as ine aggregate for NVC
series concrete. Crushed basalt stored in the laboratory with maximum size of 15 mm and specific gravity of 2.96 g.cm–3 was used as coarse aggregate in NVC series
concrete.
Crushed limestone aggregates were used to produce self-compacting concretes, with gravel 4/12 and two types of sand: one coarse 0/4, for ine aggregates and the other ine 0/2, with a very high ines content (particle size < 0.063 mm) of 19.2%, the main function of which was to provide a greater volume of ine materials to improve the stability of the fresh concrete. A polycarboxylate with a polyethylene condensate defoamed based admixture (Glenium C303 SCC) was used. Table 3 shows some of the physical and chemical properties of polycarboxylate admixture used in this study.
2.2.
Mixture proportions
Totally 6 series of mixtures were prepared and tested experimentally. C0 series mixtures were prepared as control specimens. The control mixtures were made of natural aggregates, cement and water. C0 series mixtures were cured in water (W) and saturated limewater (LW) and designated as C0-W and C0-LW series, respectively. N series were prepared with different contents of ZnO2 nanoparticles.
The mixtures were prepared by the cement replacement of 0.5, 1.0, 1.5 and 2.0 weight percent. N series mixtures were
also cured in water (W) and saturated limewater (LW) and designated as N-W and N-LW series, respectively.
C0-SCC series mixtures were prepared by cement, fine and ultra-fine crushed limestone aggregates with 19.2% by weight of ultra-ine ones and 1.0 weight percent of polycarboxylate admixture replaced by water. N-SCC series were prepared with different contents of ZnO2 nanoparticles. The mixtures were prepared with the cement replacement by ZnO2 nanoparticles from 1 to 5 weight percent and 1 weight percent polycarboxylate admixture.
The water to binder ratio for all mixtures was set at 0.40. The binder content of all mixtures was 450 kg.m–3.
The proportions of the mixtures are presented in Table 4.
2.3.
Test procedure
For NVC series concrete, Cylinders with the diameter of 150 mm and the height of 300 mm were cast and compacted in two layers on a vibrating table, where each layer was vibrated for 10 seconds. SCC series mixtures were prepared without subsequent vibration. The moulds were covered with polyethylene sheets and moistened for 24 hours. Then the specimens were demolded and cured in water and saturated limewater at a temperature of 20 °C prior to test days.
Splitting tensile tests were carried out according to the ASTM C 496[29] standard. After the speciied curing period
was over (7, 28 and 90 days for NVC series and 2, 28 and 90 days for SCC series), the concrete cubes were subjected to splitting tensile test by using universal testing machine. The tests were carried out triplicately.
Water permeability tests are performed with several methods. In this work, water absorption has been selected to evaluate the water permeability of the specimens. Water absorption values samples were measured as per ASTM C 642[30] after speciied curing time in cold water.
The tests were carried out triplicately.
3. Experimental Results
The splitting tensile strength results of the specimens are shown in Table 4. Table 4 shows that the splitting tensile strength increases with adding nano- ZnO2 particles up to 1.0% in N-W series. It is shown that using 2.0% ZnO2 nanoparticles decreases the splitting tensile
strength to a value which is near to the control concrete. This may be due to the fact that the quantity of nano- ZnO2 particles is higher than the amount required to combine with the liberated lime during the process of hydration thus leading to excess silica leaching out and causing a deiciency in strength as it replaces part of the cementitious material but does not contribute to strength31. Also, it may be due
to the defects generated in dispersion of nanoparticles that causes weak zones. The high enhancement of splitting tensile strength in the N series blended concrete are due
Table 1. Chemical and physical properties of Portland cement (wt. (%)).
Material SiO2 Al2O3 Fe2O3 CaO MgO SO3 Na2O K2O Loss on ignition
Cement 21.89 5.3 3.34 53.27 6.45 3.67 0.18 0.98 3.21
Speciic gravity: 1.7 g.cm–3.
to the rapid consuming of Ca(OH)2 which was formed during hydration of Portland cement specially at early ages related to the high reactivity of nano- ZnO2 particles. As a consequence, the hydration of cement is accelerated and larger volumes of reaction products are formed. Also nano- ZnO2 particles recover the particle packing density of the blended cement, directing to a reduced volume of larger pores in the cement paste.
On the other hand, for the specimens saturated in limewater, the splitting tensile strength increases by adding up to 2.0 weight percent ZnO2 nanoparticles. Lime reacts with water and produces Ca(OH)2 which needs to form strengthening gel. When ZnO2 nanoparticles react with Ca(OH)2 produced from saturated limewater, the content of
strengthening gel is increased because of high free energy of nanoparticles which reduces signiicantly when reacts by Ca(OH)2. Table 4 also shows the water absorption in C0 and N series concrete. The results indicate similar results to splitting tensile strength.
Table 4 also shows the splitting tensile strength of C0-SCC and N-SCC specimens at 2, 7 and 28 days of curing. The results show that the splitting tensile strength increases by adding ZnO2 nanoparticles up to 4.0 weight percent replacements (N4-SCC series) and then it decreases, although adding 5.0 percent ZnO2 nanoparticles produces specimens with much higher splitting tensile strength with respect to C0-SCC and N-SCC specimens with 1.0, 2.0 and 3.0 weight percent ZnO2 nanoparticles.
To show that nanoparticles are capable to improve the mechanical properties of concrete specimens signiicantly, the compressive strength of the specimens has been illustrated in Table 4. It is obvious that nanoparticles have a key role on increasing the compressive strength of the specimens.
Table 4 also shows the water absorption in C0-SCC and N-SCC series concrete. The results indicate improvement by adding nanoparticles similar to splitting tensile strength.
The mechanism that the nanoparticles improve the strength and resistance to water permeability of concrete specimens can be interpreted as follows32: Suppose that
nanoparticles are uniformly dispersed in concrete and each particle is contained in a cube pattern, therefore the distance between nanoparticles can be determined. After the hydration begins, hydrate products diffuse and envelop nanoparticles as kernel32. If the content of nanoparticles and
the distance between them are appropriate, the crystallization will be controlled to be a suitable state through restricting the growth of Ca(OH)2 crystal by nanoparticles. Moreover, the nanoparticles located in cement paste as kernel can further promote cement hydration due to their high activity. This makes the cement matrix more homogeneous and compact. Consequently, the strength and resistance to water permeability of concrete is improved evidently such as the concrete containing nano- ZnO2 in the amount of 1% by weight of binder32.
With increasing the content of ZnO2 nanoparticles more than a speciic weight percent (based on the concrete type), the improvement on the strength and resistance to water permeability of concrete is weakened. This can be attributed to that the distance between nanoparticles decreases with increasing content of nanoparticles, and Ca(OH)2 crystal cannot grow up enough due to limited space and the crystal quantity is decreased, which leads to the ratio of crystal to strengthening gel small and the shrinkage and creep of cement matrix increased33, thus the strength and resistance
to water permeability of cement matrix is looser relatively. On the whole, the addition of nanoparticles improves the strength and resistance to water permeability of concrete. On the one hand, nanoparticles can act as a iller to enhance the density of concrete, which leads to the porosity of concrete reduced signiicantly. On the other hand, nanoparticles can not only act as an activator to accelerate cement hydration due to their high activity, but also act as a kernel in cement paste which makes the size of Ca(OH)2 crystal smaller and the tropism more stochastic.
4. Artificial Neural Networks
ANNs were developed to model the human brain34. Even
an ANN fairly simple and small in size when compared to the human brain, has some powerful characteristics in knowledge and information processing because of its similarity to the human brain. Therefore, an ANN can be a powerful tool for engineering applications35. McCulloch
and Pitts36 deined artiicial neurons for the irst time and
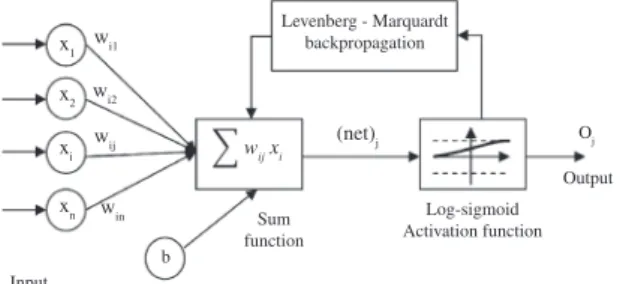
developed a neuron model as in Figure 1. McCulloch and Pitts’ network36 formed the basis for almost all later neural
network models. Afterwards, Rosenblatt37 devised a machine
called the perceptron that operated much in the same way
Table 3. Physical and chemical characteristics of the polycarboxylate admixture.
Appearance Yellow-brown liquid
% solid residue Approximately 36%
pH 5.2-5.3
Speciic gravity (kg.L–1) Approximately 1.06 Rotational viscosity (MPa) 79.30
% C 52.25
ppm Na+ 9150
ppm K+ 158
Table 2. The properties of nano- ZnO2.
Diameter (nm)
Surface Volume ratio (m2.g–1)
Density (g.cm–3)
Purity (%)
15 ± 3 155 ± 12 <0.13 >99.9
Prediction the Ef
fects of ZnO
2 Nanoparticles on Splitting
T
ensile Strength
and
W
ater
Absorption of High Strength Concrete
Table 4. Average splitting tensile strength and water absorption of different mixture proportion of concrete specimens.
Sample designation
ZnO2 nanoparticles (%)
PC content
(%)
Quantities (kg.m–3) Average splitting tensile strength
(MPa)
Average compressive strength
(MPa) Average water absorption (%)
Cement ZnO2
nanoparticles 2 days 7 days 28 days 90 days 2 days 7 days 28 days 90 days 2 days 7 days 28 days 90 days
C0-W 0 0 450.00 0.00 - 1.5 1.8 2.3 - 27.3 36.8 42.3 - 2.3 5.6 4.8
N1-W 0.5 0 447.75 2.25 - 2.1 2.5 3.0 - 27.9 37.7 41.0 - 4.33 2.35 0.99
N2-W 1.0 0 445.50 4.50 - 2.6 2.9 3.1 - 29.2 38.5 42.4 - 4.65 2.64 1.26
N3-W 1.5 0 443.25 6.75 - 2.5 2.6 2.8 - 28.4 37.9 42.1 - 4.97 2.82 1.51
N4-W 2.0 0 441.00 9.00 - 1.8 1.8 2.0 - 25.1 35.1 39.1 - 5.57 3.02 1.84
C0-LW 0 0 450.00 0.00 - 1.3 1.5 1.9 - 27.0 35.4 39.8 - 4.32 5.71 4.92
N1-LW 0.5 0 447.75 2.25 - 2.3 2.9 2.9 - 28.3 42.4 42.8 - 6.46 1.55 0.67
N2-LW 1.0 0 445.50 4.50 - 3.1 3.2 3.3 - 31.3 44.5 45.0 - 6.91 1.67 0.92
N3-LW 1.5 0 443.25 6.75 - 3.4 3.3 3.3 - 34.3 47.5 47.8 - 7.30 1.84 1.29
N4-LW 2.0 0 441.00 9.00 - 3.7 3.5 3.5 - 37.1 49.7 49.7 - 7.48 2.00 1.53
C0-SCC1 0 1.0 450.00 0.00 0.4 1.2 1.6 - 14.0 20.6 31.6 - 2.30 4.28 3.89
-N1-SCC1 1 1.0 445.50 4.50 0.7 1.1 1.4 - 13.4 21.6 31.6 - 4.29 2.2 2.02
-N2-SCC1 2 1.0 441.0 9.00 1.1 1.4 1.8 - 14.5 26.0 34.4 - 4.63 2.10 1.77
-N3-SCC1 3 1.0 437.5 13.50 1.4 1.8 2.2 - 16.0 29.2 40.0 - 5.01 1.96 1.47
-N4-SCC1 4 1.0 432.0 18.00 1.7 2.1 2.6 - 17.0 33.8 45.0 - 5.43 1.65 1.21
-N5-SCC1 5 1.0 427.5 22.50 1.5 1.9 2.3 - 18.2 31.8 43.8 - 5.20 1.76 1.35
-Water to binder [cement + nano- ZnO2] ratio of 0.40. W denotes the specimens cured in water and LW denotes to those cured in saturated limewater.
2012; 15(3)
as the human mind. Rosenblatt’s perceptrons37 consist of
‘‘sensory” units connected to a single layer of McCulloch and Pitts36 neurons. Rumelhardt et al.38 derived a learning
algorithm for perceptron networks with constituted hidden units. Their learning algorithm is called back-propagation and is now the most widely used learning algorithm. As a result of these studies, together with the developments in computer technology, using ANN has become more eficient after 1980[39].
As it can be seen from Figure 1, an artiicial neuron is composed of ive main parts: inputs, weights, sum function, activation function and outputs. Inputs are information that enters the neuron from other neurons of from external world. Weights are values that express the outcome of an input set or another process element in the preceding layer on this process element. Sum function is a function that calculates the effect of inputs and weights completely on this process element. This function computes the net input that approaches to a neuron40. The weighted sums of the
input components (net)j are calculated using Equation 1 as follows:
( )
1n
i ij i
j
net = Σ=W x +b (1)
where (net)j is the weighted sum of the jth neuron for the input received from the preceding layer with n neurons, Wij is the weight between the jth neuron in the previous layer,
xi is the output of the ith neuron in the previous layer39. b is
a ix value as internal addition and represents sum function. Activation function is a function that processes the net input obtained from sum function and determines the neuron output. In general for multilayer feed-forward models as the activation function sigmoid activation function is used. The output of the jth neuron (out)j is computed using Equation 2 with a sigmoid activation function as follows41:
( ) 1 ( )
1 j
j j net
O f net
e−α
= =
+ (2)
where is constant used to control the slope of the semi-linear region. The sigmoid nonlinearity activates in every layer except in the input layer39. The sigmoid activation function
represented by Equation 2 gives outputs in (0,1). If it desired, the outputs of this function can be adjusted to (–1,1) interval. As the sigmoid processor represents a continuous function it is particularly used in non-linear descriptions. Because its derivatives can be determined easily with regard to the parameters within (net)j variable39.
LMBP is often the fastest available back-propagation algorithm, and is highly recommended as a irst-choice supervised algorithm, although it requires more memory than other algorithms. The standard LMBP training process can be described in the pseudocode of Figure 2[42].
4.1.
Neural network model structure and
parameters
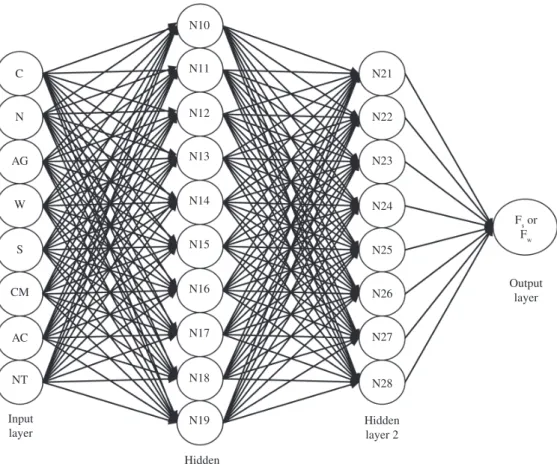
ANN model is carried out in this research has eight neurons in the input layer and one neurons in the output layer as demonstrated in Figure 3. The values for input layers were cement content (C), nanoparticle content (N),
aggregate type (AG), water content (W), the amount of superplasticizer (S), the type of curing medium (CM), Age of curing (AC) and number of testing try (NT). The values for output layer were splitting tensile strength (fS) data in one set
and water absorption (fW) in the other set. Two hidden layer with ten and eight neurons were used in the architecture of multilayer neural network because of its minimum absolute percentage error values for training and testing sets. The neurons of neighboring layers are completely interconnected by weights. Finally, the output layer neurons produce the network prediction as a result.
In this study, the back-propagation training algorithm has been utilized in feed-forward two hidden layers. Back-propagation algorithm, as one of the most well-known training algorithms for the multilayer perceptron, is a gradient descent technique to minimize the error for a particular training pattern in which it adjust the weights by a small amount at a time42. The non-linear sigmoid activation
function was used in the hidden layer and the neuron outputs at the output layer. Momentum rate and learning rate values were determined and the model was trained through iterations. The trained model was only tested with the input values and the predicted results were close to experiment results. The values of parameters used in neural network model are given in Table 5.
To make a decision on the completion of the training processes, two termination states are declared: state 1 (ANN-I model) means that the training of neural network was ended when the maximum epoch of process reached (1000) while state 2 (ANN-II model) means the training ended when minimum error norm of network gained.
5. Genetic Programming
Genetic programming (GP) proposed by Koza43 is an
extension to Genetic Algorithms (GA). Koza43 defines
GP as a domain independent problem-solving approach in which computer programs are evolved to solve, or approximately solve, problems based on the Darwinian
Figure 2. Pseudo-code for LMBP algorithm42
1. Initialize the weights and parameter µ (µ = 0.01 is appropriate). 2. Compute the sum of the squared errors over all inputs F(w) F(w) = eTe (3) Where w = [w1, w2, …, wn] consists of all weights of the network, e is the error vector comprising the error for all the training examples.
3. Solve (5) to obtain the increment of weights w
w = [JTJ + µI]-1JTe (4) Where J is the Jacobian matrix, is the learning rate which is to be updated using the β depending on the outcome. In particular, µ is multiplied by decay rate β (0<β<1).
4. Using w+ w as the trial w, and judge IF trial F(w)<F(w) in step 2 THEN W = w + w
µ = µ.β (β = 0.1) go back to step 2 ELSE
µ = µ/β
Prediction the Effects of ZnO2 Nanoparticles on Splitting Tensile Strength
and Water Absorption of High Strength Concrete
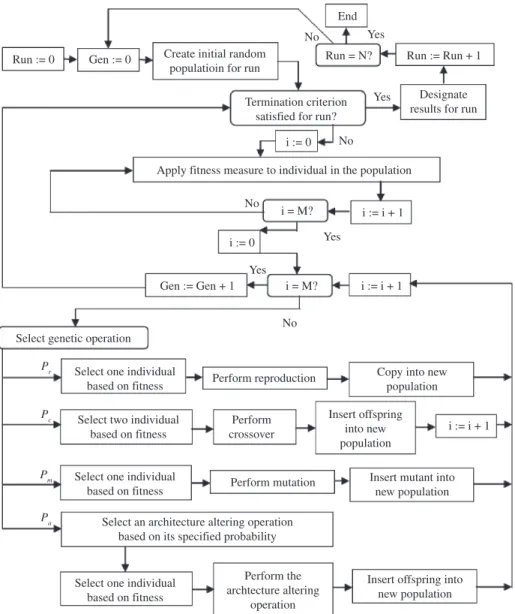
principle of reproduction and survival of the ittest and analogs of naturally occurring genetic operations such as crossover and mutation. GP reproduces computer programs to solve problems by executing the steps in Figure 4. This igure is a lowchart showing the executional steps of a run of GP. The lowchart demonstrates the genetic operations in addition to the architecture chancing operations. Also, this lowchart demonstrates a two offspring version of the crossover operation.
Gene expression programming (GEP) software which is used in this study is an extension to GEP that evolves
computer programs of different sizes and shapes encoded in linear chromosomes of ixed length. The chromosomes are composed of multiple genes, each gene encoding a smaller sub-program. Furthermore, the structural and functional organization of the linear chromosomes allows the unconstrained operation of important genetic operators such as mutation, transposition, and recombination44-46.
The two main parameters GEP are the chromosomes and expression trees (ETs)44-46. Two languages are utilized in
GEP: the language of the genes and the language of ETs. A signiicant advantage of GEP is that it enables to infer exactly the phenotype given the sequence of a gene, and vice versa which is termed as Karva language.
For each problem, the type of linking function, as well as the number of genes and the length of each gene, are a priori chosen for each problem. While attempting to solve a problem, one can always start by using a single-gene chromosome and then proceed by increasing the length of the head. If it becomes very large, one can increase the number of genes and obviously choose a function to link the sub-ETs. One can start with addition for algebraic expressions or for Boolean expressions, but in some cases another linking function might be more appropriate (like multiplication or IF, for instance). The idea, of course, is to ind a good solution, and GEP provides the means of inding one very eficiently44.
Figure 3. The system used in the ANN model.
Table 5. The values of parameters used in neural network model.
Parameters ANN
Number of input layer units 8
Number of hidden layer 2
Number of irst hidden layer
units 10
Number of second hidden
layer units 8
Number of output layer units 1
Momentum rate 0.88
Learning rate 0.70
Error after learning 0.000050
Learning cycle 30.000
5.1.
Genetic expression programming structure
and parameters
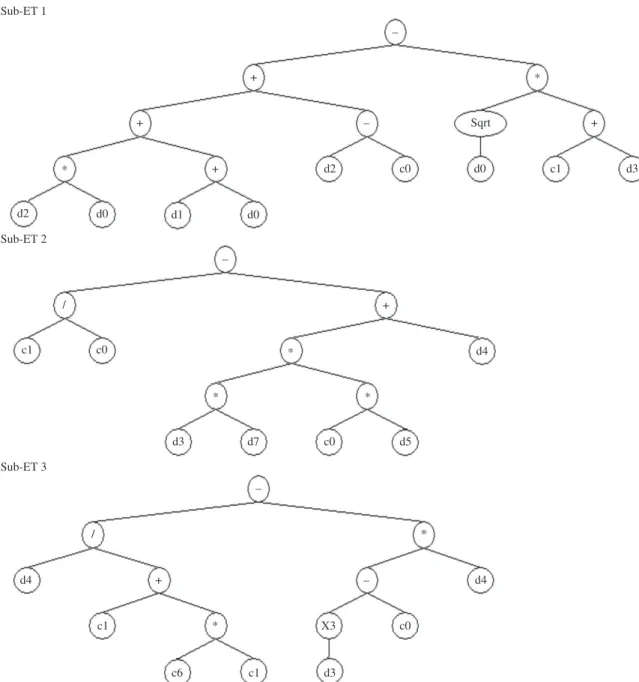
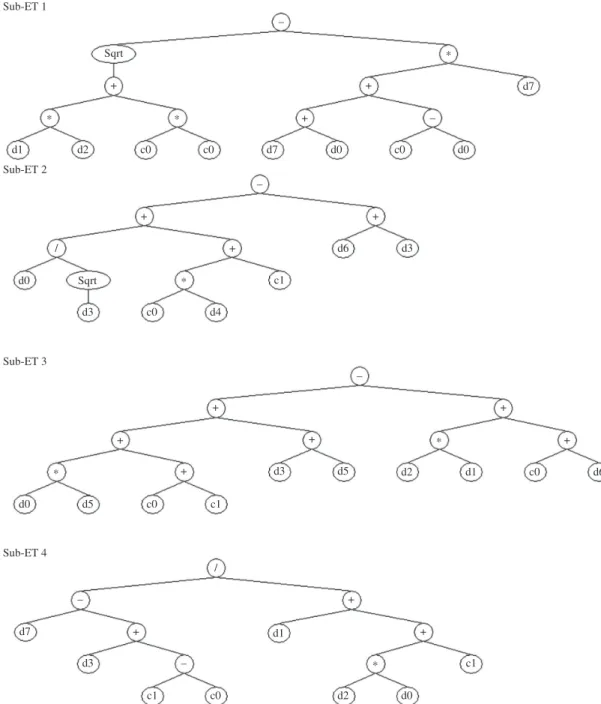
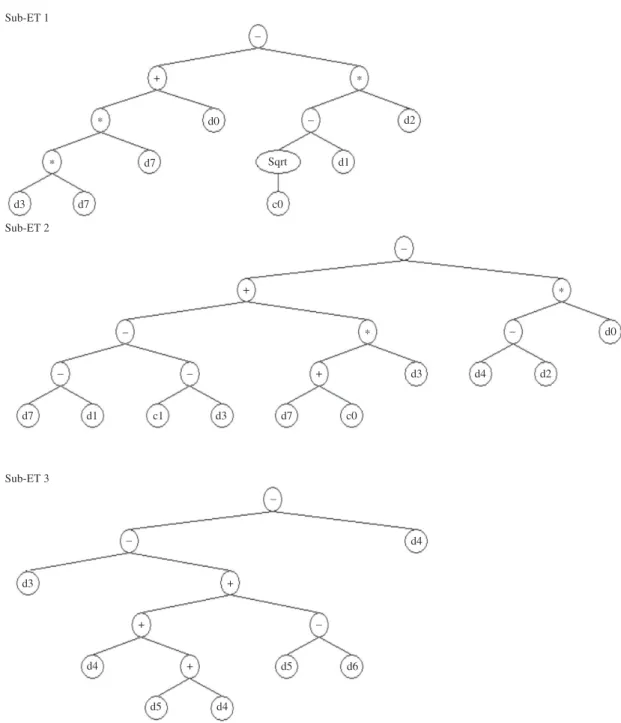
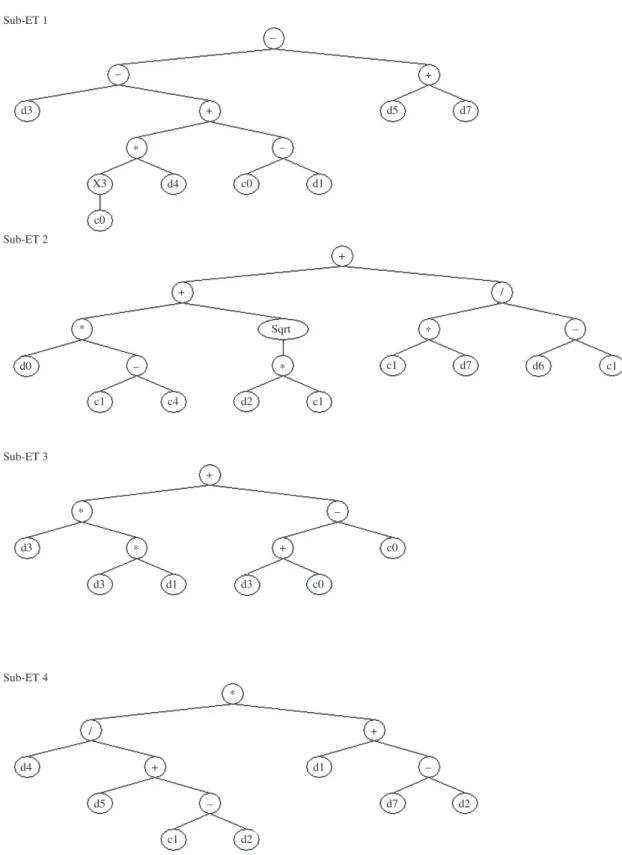
In this study, as seen in Figures 5-8, the expression trees of two different GEP approach models namely GEP-I and GEP-II were constructed for splitting tensile strength and water absorption. d0, d1, d2, d3, d4, d5 d6 and d7 in Figures 5-8 represent C, N, AG, W, S, CM, AC and NT, respectively. In the GEP-I and GEP-II, as the number of genes used 3 and 4 genes (Sub-ETs), and as linking function used addition and multiplication, respectively. In training and testing of the GEP-I and GEP-II approach models constituted with two different Sub-ETs and linking function C, N, AG, W, S, CM, AC and NT as input data and fS and fW as independent output data. Among 144 experimental
sets, 117 sets were randomly chosen as a training set for the GEP-I and GEPII modeling and the remaining 27 sets were used as testing the generalization capacity of the proposed models.
For this problem, irstly, the itness, fi, of an individual program, i, is measured by:
(
( ))
1
t C
i j ij j
f = Σ= M−C −T (5)
where M is the range of selection, C(i,j) is the value returned by the individual chromosome i for itness case j (out of Ct itness cases) and Tj is the target value for itness case j. If |C(ij) – Tj| (the precision) is less than or equal to 0.01, then the precision is equal to zero, and fi = fmax = CtM. In this case, M = 100 was used, therefore, fmax = 1000. The advantage of this kind of itness functions is that the system can ind the optimal solution by itself44,47.
Afterwards the set of terminals T and the set of functions F to create the chromosomes are preferred, namely, T = {C, N, AG, W, S, CM, AC, NT} and four basic arithmetic operators (+, –, *, /) and some basic mathematical functions (Sqrt, x3) were used.
Prediction the Effects of ZnO2 Nanoparticles on Splitting Tensile Strength
and Water Absorption of High Strength Concrete
Sub-ET 1
Sub-ET 2
/
c1 c0 *
*
d3 d7
–
/ *
d4 +
c1
c6 c1 d3
* X3 c0
– d4
c0 d5
* +
d4
Sub-ET 3
–
* +
+ – Sqrt +
+ d2 c0 d0 c1 d3
*
d2 d0 d1 d0
–
Figure 5. Expression tree with 3 gens for splitting tensile strength in GEP-I model. C0 = 12.25 and C1 = –3.37.
Another major step is to choose the chromosomal tree, i.e., the length of the head and the number of genes. The GEP-I and GEP-II approach models initially used single gene and two lengths of heads, and increased the number of genes and heads, one after another during each run, and monitored the training and testing sets performance of each model. In this study, for the GEP-I and GEP-II approach models observed the number of genes 3 and 4, and length of heads 10 and 12, respectively. In addition, for the GEP-I and GEP-II approach models determined the linking function multiplication and addition, respectively.
Finally, a combination of all genetic operators (mutation, transposition and crossover) was utilized as set of genetic operators. Parameters of the training of the GEP-I and GEP-II approach models are given in Table 6. For the
GEP-I and GEP-II approach models, chromosome 30 and 40 were observed to be the best of generation individuals predicting fS and fW. Explicit formulations based on the GEP-I and GEP-II approach models for fS and fW were obtained by:
fS = f(C, N, AG, W, S, CM, AC, NT) (6)
fW = f(C, N, AG, W, S, CM, AC, NT) (7)
Figures 5 and 6 show the expression trees with 3 and 4 gens respectively for splitting tensile strength prediction and Figures 7 and 8 show the expression trees with 3 and 4 gens respectively for water absorption prediction. The related formulations could be obtained by the procedure shown in Figure 9[7].
Figure 6. Expression tree with 4 gens for splitting tensile strength in GEP-II model. C0 = 18.95, c1 = 4.43.
Table 6. Parameters of GEP approach models.
Parameter definition GEP-I GEP-II
P1 Function set +,–,*,/,sqrt,x3 +,–,*,/,sqrt,x3
P2 Chromosomes 30 40
P3 Head size 12 14
P4 Number of genes 3 4
P5 Linking function Addition Multiplication
P6 Mutation rate 0.044 0.044
P7 Inversion rate 0.1 0.1
P8 One-point recombination rate 0.3 0.3
P9 Two-point recombination rate 0.3 0.3
P10 Gene recombination rate 0.1 0.1
Prediction the Effects of ZnO2 Nanoparticles on Splitting Tensile Strength
and Water Absorption of High Strength Concrete
Figure 7. Expression tree with 3 gens for water absorption in GEP-I model. C0 = 3.56, c1 = –7.24.
6. Results
6.1.
Artificial neural network
In this study, the error arose during the training and testing in ANN-I and ANN-II models can be expressed as absolute fraction of variance (R2) which are calculated by
Equation 8[48]:
(
)
( )
2 2
2
1 i i i
i i
t o R
o
Σ −
= −
Σ
(8)
where t is the target value, o is the output value and p is the pattern.
All of the results obtained from experimental studies and predicted by using the training and testing results of ANN I and ANN II models, for fS are given in Figures 10a, b, respectively and for fW in Figures 11a, b, respectively. The
linear least square it line, its equation and the R2 values were
shown in these igures for the training and testing data. As it is visible in Figures 10 and 11 the values obtained from the training and testing in ANN-I and ANN-II models are very close to the experimental results. The result of testing phase in Figures 10 and 11 shows that the ANN-I and ANN-II models are capable of generalizing between input and output variables with reasonably good predictions.
Figure 8. Expression tree with 4 gens for water absorption in GEP-II model. C0 = 7.54, c1 = 13.33.
The performance of the ANN-I and ANN-II models for fS and fW is shown in Figures 10 and 11, respectively. The best values of R2 are 98.29 and 98.89% for training set in the
ANN-II model, respectively for splitting tensile strength and water absorption. The minimum values of R2 are 92.09 and
94.79% for testing set in the ANN-I model, respectively for splitting tensile strength and water absorption. All of R2 values show that the proposed ANN-I and ANN-II models
Prediction the Effects of ZnO2 Nanoparticles on Splitting Tensile Strength
and Water Absorption of High Strength Concrete
Figure 9. Chromosome with two genes and its decoding in GEP7.
Figure 10. The correlation of the measured and predicted splitting tensile strengths in a) training and b) testing phase for ANN models.
Figure 11. The correlation of the measured and predicted water absorption in a) training and b) testing phase for ANN models.
6.2.
Genetic programming
Once again, in this study, the error arose during the training and testing in GEP-I and GEP-II models can be expressed as R2 which are calculated by Equation 8. All of
the results obtained from experimental studies and predicted by using the training and testing results of GEP-I and GEP-II models, for fS are given in Figures 12a, b, respectively
and for FW in Figures 13a, b, respectively. The linear least square it line, its equation and the R2 values were shown
Figure 13. The correlation of the measured and predicted water absorption in a) training and b) testing phase for GEP models.
Figure 12. The correlation of the measured and predicted splitting tensile strengths in a) training and b) testing phase for GEP models.
in these igures for the training and testing data. As it is visible in Figures 12 and 13 the values obtained from the training and testing in GEP-I and GEP-II models are very close to the experimental results. The result of testing phase in Figures 12 and 13 shows that the GEP-I and GEP-II models are capable of generalizing between input and output variables with reasonably good predictions.
The performance of the GEP-I and GEP-II models for fS and fW is shown in Figures 12 and 13, respectively. The best values of R2 are 97.82 and 94.99% for training set in
the GEP-II model, respectively for splitting tensile strength and water absorption. The minimum values of R2 are 90.93
and 93.13% for testing set in the GEP-I model, respectively for splitting tensile strength and water absorption. All of the statistical values show that the proposed GEP-I and GEP-II models are suitable and can predict fS and fW values for every age very close to the experimental values.
7. Discussion
Artiicial neural networks are capable of learning and generalizing from examples and experiences. This makes artiicial neural networks a powerful tool for solving some of the complicated civil engineering problems. In this study, using these beneicial properties of artiicial neural networks in order to predict the splitting tensile strength
and water absorption values of concretes containing ZnO2 nanoparticles without attempting any experiments were developed two different multilayer artiicial neural network architectures namely ANN-I and ANN-II. In two models developed in ANN method, a multilayered feed forward neural network with a back propagation algorithm was used. The models were trained with input and output data. Using only the input data in trained models the splitting tensile strength and water absorption values of concretes containing ZnO2 nanoparticles were found. The splitting tensile strength and water absorption values predicted from training and testing, for ANN-I and ANN-II models, are very close to the experimental results. Furthermore, according to the splitting tensile strength and water absorption results predicted by using ANN-I and ANN-II models, the results of ANN-II model are closer to the experimental results. R2 values that are calculated for comparing experimental
results with ANN-I and ANN-II model results have shown this situation.
Prediction the Effects of ZnO2 Nanoparticles on Splitting Tensile Strength
and Water Absorption of High Strength Concrete
proposed models are empirical and based on experimental results. The models developed in this study are used to be the number of genes 3 and 4, and the linking function addition and multiplication, respectively. All of the results obtained from the models show excellent agreement with experimental results. The statistical values of R2 have
shown this situation. Also, the proposed models are so simple that they can be used by anyone not necessarily familiar with GEP. Moreover, it is concluded that GEP is a good soft computing technique for use in concrete properties prediction. As a result, GEP may serve as a strong approach model and it may open a new area for the accurate and effective explicit formulation of many civil engineering problems.
From the predicted results for splitting tensile strength and water absorption, it is concluded that ANN models are more suitable for prediction the concrete properties. This conclusion is made on the R2 values obtained from
different applied models. However, application of GEP as a result of its simplicity is a relatively suitable approaches for prediction the concrete properties. The results show that both ANNs and GEP models have different R2 values for
splitting tensile strength and water absorption itting in both training and testing data sets. This may be due to very close data in both splitting tensile strength and water absorption results. However, as mentioned, all of the predicted results fall in acceptable ranges.
As author’s literature survey shows, there are no works for prediction the effects of nanoparticles on properties of concrete specimens by the other researchers. However, as mentioned by the other authors ANNs[2,3] and GEP[6,7] are
suitable soft computing tools for prediction the properties of concrete specimens. The results obtained from this work also indicate these indings.
8. Conclusions
ZnO2 nanoparticles showed its inluence on splitting tensile strength and percentage water absorption up to 1.0 weight percent in N-W series concrete, up to 2.0 weight percent in N-LW series concrete and inally up to 4.0 weight percent in N-SCC series concrete. The deficiency in dispersion of nanoparticles more than the mentioned values causes the reduction of nanoparticles effects on improving splitting tensile strength and percentage water absorption results.
ANN and GEP can be an alternative approach for the evaluation of the effect of cementitious material on the splitting tensile strength and percentage water absorption. There is an optimum replacement ratio of ZnO2 nanoparticles existed; this value can be predicted using ANN and GEP models.
ANN and GEP are eficient for predicting the splitting tensile strength of ZnO2 nanoparticles concrete. Comparison between ANN and GEP in terms of R2, showed that ANN
provides better results than the GEP results.
References
1. Ye G, Lura P and Van Breugel K. Modelling of water permeability in cementitious materials. Materials and Structures. 2006; 39: 877-885. http://dx.doi.org/10.1617/ s11527-006-9138-4
2. Hong-Guang N and Ji-Zong W. Prediction of compressive strength of concrete by neural networks. Cement and Concrete Research. 2000; 30(8):1245-50. http://dx.doi.org/10.1016/ S0008-8846(00)00345-8
3. Pala M, Ozbay O, Oztas A and Yuce MI. Appraisal of long-term effects of ly ash and silica fume on compressive strength of concrete by neural networks. Construction and Building Materials. 2005; 21(2):384-94. http://dx.doi.org/10.1016/j. conbuildmat.2005.08.009
4. Akkurt S, Tayfur G and Can S. Fuzzy logic model for prediction of cement compressive strength. Cement and Concrete Research. 2004; 34(8):1429-33. http://dx.doi.org/10.1016/j. cemconres.2004.01.020
5. Baykasoǧlu A, Dereli T and Tanış S. Prediction of cement strength using soft computing techniques. Cement and Concrete Research. 2004; 34(11):2083-90. http://dx.doi.org/10.1016/j. cemconres.2004.03.028
6. Akkurt S, Ozdemir S, Tayfur G and Akyol B. The use of GA-ANNs in the modelling of compressive strength of cement mortar. Cement and Concrete Research. 2003; 33(7):973-9. http://dx.doi.org/10.1016/S0008-8846(03)00006-1
7. Cevik A and Sonebi M. Genetic programming based formulation for fresh and hardened properties of self-compacting concrete containing pulverised fuel ash. Construction and Building Materials. 2009; 23(7):2614-22. http://dx.doi.org/10.1016/j. conbuildmat.2009.02.012
8. Cevik A and Sonebi M. Modelling the performance of self-compacting SIFCON of cement slurries using
gen etic pr og ram mi ng te ch n iq u e. C o m p u t e r s a n d Concrete. 2008; 5(5):475-91.
9. Nazari A and Riahi S. Microstructural, thermal, physical and mechanical behavior of the self compacting concrete containing SiO2 nanoparticles. Materials Science and Engineering: A. 2010; 527:7663-7672. http://dx.doi.org/10.1016/j. msea.2010.08.095
10. Nazari A and Riahi S. The effect of TiO2 nanoparticles on water permeability and thermal and mechanical properties of high strength self-compacting concrete. Materials Science and Engineering: A. 2010; 528(2):756-763. http://dx.doi. org/10.1016/j.msea.2010.09.074
11. Nazari A. The effects of curing medium on lexural strength and water permeability of concrete incorporating TiO2 nanoparticles. Materials and Structures. 2011) 44(4): 773-786. http://dx.doi.org/10.1617/s11527-010-9664-y
12. Nazari A and Riahi S. The effects of zinc dioxide nanoparticles on lexural strength of self-compacting concrete. Composites Part B: Engineering. 2011; 42:167-175. http://dx.doi. org/10.1016/j.compositesb.2010.09.001
13. Nazari A and Riahi S. Computer-aided prediction of physical and mechanical properties of high strength cementitious composite containing Cr2O3 nanoparticles. Nano. 2010; 5(5):301-318. http://dx.doi.org/10.1142/S1793292010002219
14. Nazari A and Riahi S. The effects of SiO2 nanoparticles o n p h y s i c a l a n d m e c h a n i c a l p r o p e r t i e s o f h i g h strength self compacting concrete. Composites Part B: Engineering. 2011; 42:570-578. http://dx.doi.org/10.1016/j. compositesb.2010.09.025
15. Nazari A and Riahi S. Improvement compressive strength of cementitious composites in different curing media by Al2O3 nanoparticles. Materials Science and Engineering:
A. 2011; 528:1183-1191. http://dx.doi.org/10.1016/j. msea.2010.09.098
16. Nazari A and Riahi S. The effects of Cr2O3 nanoparticles on strength assessments and water permeability of concrete in different curing media. Materials Science and Engineering: A. 2011; 528:1173-1182. http://dx.doi.org/10.1016/j. msea.2010.09.099
17. Nazari A and Riahi S. ZrO2 nanoparticles effects on split tensile strength of self compacting concrete. Materials Research. 2010; 13(4):485-495. http://dx.doi.org/10.1590/ S1516-14392010000400011
18. Nazari A and Riahi S. The effects of ZrO2 nanoparticles on physical and mechanical properties of high strength self compacting concrete. Materials Research. 2010; 13(4): 551-556. http:// dx.doi.org/10.1590/S1516-14392010000400019
19. Nazari A and Riahi S. The effects of ZnO2 nanoparticles on strength assessments and water permeability of concrete in different curing media. Materials Research. 2011; 14(2):178-188. http:// dx.doi.org/10.1590/S1516-14392011005000030
20. Nazari A and Riahi S. Al2O3 nanoparticles in concrete and different curing media. Energy and Buildings. 2011; 43:1480-1488. http://dx.doi.org/10.1016/j.enbuild.2011.02.018
21. Riahi S and Nazari A. Physical, mechanical and thermal properties of concrete in different curing media containing ZnO2 nanoparticles. Energy and Buildings. 2011; 43:1977-1984. http://dx.doi.org/10.1016/j.enbuild.2011.04.009
22. Nazari A and Riahi S. Effects of CuO Nanoparticles on Microstructure, Physical, Mechanical and Thermal Properties of Self-Compacting Cementitious Composites. Journal of Materials Science and Technology. 2011; 27(1):81-92. http:// dx.doi.org/10.1016/S1005-0302(11)60030-3
23. Nazari A and Riahi S. Splitting tensile strength of concrete using ground granulated blast furnace slag and SiO2 nanoparticles as binder. Energy and Buildings. 2011; 43:864-872. http://dx.doi. org/10.1016/j.enbuild.2010.12.006
24. Nazari A and Riahi S. TiO2 nanoparticles effects on physical, thermal and mechanical properties of self compacting concrete with ground granulated blast furnace slag as binder. Energy and Buildings. 2011; 43:995-1002. http://dx.doi.org/10.1016/j. enbuild.2010.12.025
25. Nazari A and Riahi S. Optimization ZnO2 nanoparticles content in binary blended concrete to enhance high strength concrete. International Journal of Materials R e s e a rc h. 2 0 1 1 ; 1 0 2 ( 4 ) : 4 5 7 - 4 6 3 . h t t p : / / d x . d o i . org/10.3139/146.110497
26. Nazari A and Riahi S. CuO nanoparticles’ effects on compressive strength of self compacting concrete.
Sadhana. 2011; 36(3):371-391. http://dx.doi.org/10.1007/ s12046-011-0023-7
27. Nazari A and Riahi S. Physical and mechanical behavior of high strength self compacting concrete containing ZrO2 nanoparticles.
International Journal of Materials Research. 2011; 102(5):560-571. http://dx.doi.org/10.3139/146.110509
28. American Society for Testing and Materials – ASTM.
ASTM C150: Standard Speciication for Portland Cement. Philadelphia: ASTM; 2001.
29. American Society for Testing and Materials – ASTM. ASTM C39: Standard Test Method for Compressive Strength of Cylindrical Concrete Specimens. Philadelphia: ASTM; 2001. 30. American Society for Testing and Materials – ASTM. ASTM
C642: Standard Test Method for Density, Absorption, and Voids in Hardened Concrete. Philadelphia: ASTM; 2001.
31. Shih JY, Chang TP and Hsiao TC. Effect of nanosilica on characterization of Portland cement composite. Cement and Concrete Research. 2006; 36:697-706.
32. Li H, Zhang M and Ou J. Flexural fatigue performance of concrete containing nanoparticles for pavement. International Journal of Fatigue. 2007; 29:1292-1301. http://dx.doi. org/10.1016/j.ijfatigue.2006.10.004
33. Ye Q. The study and development of the nano-composite cement structure materials. New Building Materials. 2001; (1):4-6.
34. Mukherjee A and Biswas SN. Artiicial neural networks in prediction of mechanical behavior of concrete at high temperature.
Nuclear Engineering and Design. 1997; 178(1):1-11. http:// dx.doi.org/10.1016/S0029-5493(97)00152-0
35. Ince R. Prediction of fracture parameters of concrete by artificial neural networks. Engineering Fracture Mechanics. 2004; 71(15):2143-59. http://dx.doi.org/10.1016/j. engfracmech.2003.12.004
36. McCulloch WS and Pitts W. A logical calculus of the ideas immanent in neural nets. Bulletin of Mathematical Biophysics. 1943; 5:115-37. http://dx.doi.org/10.1007/ BF02478259
37. Rosenblatt F. Principles of neuro dynamics: perceptrons and the theory of brain mechanisms. Washington: Spartan Books; 1962. 38. Rumelhart DE, Hinton GE and William RJ. Learning internal
representation by error propagation. In: Rumelhart DE and McClelland JL, editors. Proceeding parallel distributed processing foundation. Cambridge: MIT Press; 1986. vol.1. 39. Liu SW, Huang JH, Sung JC and Lee CC. Detection
of cracks using neural networks and computational mechanics. Computer Methods in Applied Mechanics and Engineering. 2002; 191(25-26):2831-45. http://dx.doi. org/10.1016/S0045-7825(02)00221-9
40. Anderson JA. Cognitive and psychological computation w i t h n e u r a l m o d e l s . I E E E S y s t e m s , M a n , a n d Cybernetics. 1983; 5:799-814.
41. Hopfield JJ. Neural networks and physical systems with emergent collective computational abilities. Proceedings of the National Academy of Sciences. 1982; 79:2554-8. http:// dx.doi.org/10.1073/pnas.79.8.2554
42. Suratgar AA, Tavakoli MB and Hoseinabadi A. Modiied Levenberg-Marquardt method for neural networks training. World Academy of Science, Engineering and Technology. 2005; 6:46-8.
43. Koza JR. Genetic programming: on the programming of computers by means of natural selection. Cambridge: MIT Press; 1992.
44. Ferreira C. Gene expression programming in problem solving. In: Invited tutorial of the 6th online world conference on soft computing in industrial applications; 2001.
45. Ferreira C. Gene expression programming: a new adaptive algorithm for solving problems. Complex Systems. 2001; 13(2):87-129.
46. Ferreira C. Gene expression programming: mathematical modeling by an artiicial intelligence. Springer-Verlag; 2002. 47. Çiftci ON, Fadıloğlu S, Goğuş F and Guven A. Genetic
programming approach to predict a model acidolysis s y s t e m . E n g i n e e r i n g A p p l i c a t i o n s o f A r t i f i c i a l Intelligence. 2009; 22(4-5):759-66. http://dx.doi.org/10.1016/j. engappai.2009.01.010