Diogo Manuel Barros Magalhães da Rocha Peixoto
Dissertation presented to obtain
the Ph.D degree in Biology - Neuroscience
Instituto de Tecnologia Química e Biológica António Xavier | Universidade Nova de Lisboa
Oeiras,
Single-trial correlates of decision-making in
dorsal premotor and primary motor cortices
Diogo Manuel Barros Magalhães da Rocha Peixoto
Dissertation presented to obtain
the Ph.D degree in Biology - Neuroscience
Instituto de Tecnologia Química e Biológica António Xavier | Universidade Nova de Lisboa
Oeiras, July, 2016
Single-trial correlates of decision-making in
dorsal premotor and primary motor cortices
Single-trial correlates of decision-making
in dorsal premotor and primary motor cortices
Diogo Manuel Barros Magalh˜
aes da Rocha Peixoto
Champalimaud Neuroscience Programme Instituto de Tecnologia Qu´ımica e Biol´ogica
Stanford University
A thesis submitted for the degree of Doctor of Philosophy (PhD)
Abstract
Everyday, as we move through the world we seamlessly make hundreds of per-ceptual decisions often without fully appreciating the underlying fast and precise computations going on in our brains. A fundamental question in the decision-making field is to understand how and where in the brain information is combined to form decisions that lead to appropriate responses.
While fascinating, perceptual decision-making is a especially challenging process to study due to its covert nature: so much can be going on at neural level and yet we only directly observe the behavioral response when all deliberation is over. Moreover, even when the behavioral response is the same the neural patterns that lead to it could be dramatically different from trial to trial. These unique features of decision formation create a strong need for precise single-trial estimates of the neural state. Though much has been learned about the mechanisms of integration of visual evidence
and motor preparation (Shadlen and Newsome, 2001; Roitman and Shadlen, 2002;
Mante et al., 2013), these studies have relied on average estimates of neural state eliminating crucial trial-to-trial variability.
Here, we trained monkeys on a modified motion discrimination task, in which the operant response was a an arm reach, making it more suitable for studying decision-making in the somatomotor system. Crucially, while the subjects performed the task we recorded the simultaneous activity of hundreds of neurons using multi-electrode arrays. Simultaneous recordings of many neurons allow for more accurate estimation of neural states on single trials serving as a window into the dynamics and variability of the decision formation process.
We studied the responses of heterogeneous populations of neurons in dorsal pre-motor (PMd) and primary pre-motor (M1) cortices and asked: 1) what signals are present in the two areas, 2) how they compare to the decision related signals reported in ocu-lomotor areas 3) how to interpret the dynamics of single trial signals and validate their predictions.
We found that 1) besides classical motor planning and execution signals, low latency choice predictive signals are present in PMd and M1, 2) these signals have the same features seen in the oculumotor system and resemble a decision variable (DV) 3) fluctuations in this decision variable are meaningful and can be directly validated.
The first two observations were made using a combination of multi-electrode recordings, population single-trial analysis and decision-making models. The final observation required going one step further by bringing into play a real-time system to estimate a DV and use it to act on the task, effectively closing the loop in our experiment. To our knowledge, this framework has only been used to implement brain-machine interfaces but we demonstrate here for the first time it can be used to understand covert cognitive processes.
Acknowledgements
First and foremost I would like to thank my Stanford advisors Bill New-some and Krishna Shenoy. I could not have been any luckier and I am deeply thankful for the opportunity to learn from and be friends with, such great scientists and human beings. From Bill, amongst uncountable things, I learned how to be my own harshest critic, to always triple check every result and line of code and to always strive for a cleaner and more accurate way of interpreting data. I also learned how to clearly convey a scientific concept and how, regardless of skill and experience, there is no such thing as over-practicing a presentation! From Krishna I learned that politeness and incisive scientific criticism are not at odds and also how important it is to frame your results within a bigger picture. I also witnessed first hand how one can stay true to his principles in the face of overwhelming adversity.
I am deeply thankful to my non-official committee members at Stanford, Kwabena Bohaen and Anthony Norcia, for being so generous with their time. They had no obligation to join my non-official committee but by voluntarily doing so they made it possible for me to have the full PhD experience at Stanford.
I also want to thank my CNP advisor Joe Paton for being incredibly helpful and supportive not only in the early stages of my project as I navigated through a completely new field but throughout my entire degree. My committee members Megan Carey and Adam Kampff made sure I stayed on track throughout the project and encouraged me over the years to aim higher and higher and I am very grateful for it.
I could have never have gotten started without Zach Mainen’s and Rui Costa’s help setting up the collaboration between Bill Newsome and Kr-ishna Shenoy and defining the scope of my project. I am extremely thank-ful for their crucial effort and support in that very early stage.
Going back a few years further, I recognize I was very privileged to have had Jorge Pacheco as my first mentor during my Physics major senior year. It was through him that I first experienced what research is actually like and what it takes to make valuable contributions to Science. It was also him who sparked my interest in Neuroscience in the first place and who guided me throughout my transition between scientific fields.
Once I joined INDP I was lucky to be part of a very diverse class who just like me was searching for its identity and path in Neuroscience. We struggled through some of the same issues together and cherished each other’s small victories along the way.
Later, I had the unique opportunity to have Roozbeh Kiani as my first hands-on mentor at Stanford University. From coding complex algorithms to isolating individual neurons I owe Roozbeh a tremendous amount of what I learned during my PhD. He always believed in the merits of my project, and will remain my reference of scientific excellence. In return, I was fortunate to have had the opportunity to pass along some of this knowledge to Bora Erden, a fantastic undergraduate student I was lucky to mentor.
I must thank Jessica Powell and Sania Fong for tirelessly sharing their expertise in behavioral training and helping me progress from a clueless graduate student to a proficient primate trainer. Sania, went far beyond the traditional role of a research technician and not only helped me dis-cover more efficient ways to train monkeys on an extremely complex task but also helped collecting data herself cutting the duration of my projects by a few valuable months.
One of my project’s core features was the use of chronically implanted Utah arrays through which we collected precious simultaneous neural data which allowed for novel single trial analyses. The chronic implantation was only possible thanks to Stephen Ryu’s incredible surgical skills. He performed several of these delicate surgeries with absolute perfection and removed immense amounts of stress and uncertainty from the single most stressful moments of the entire project on which everything else relies. In the process he was generous enough to teach me basic surgery skills and practices and I am extremely thankful for his contributions.
The work would not have been possible without the help and support of many collaborators. Chandramouli Chandrasekaran was my partner in crime all along having collaborated closely with me and carried out a complementary project. He was often the first I sought to share new results or bounce ideas off and regularly the one highlighting the validity and importance of the findings. He was also there in the harder times to commiserate about the difficulties of our line of research.
Paul Nuyujukian, Jonathan Kao and Julian Brown were an essential driv-ing force that helped make the real-time decoddriv-ing project a reality. Their networking, coding and electrical engineering skills were absolutely crucial to get the setup running in a very short period, and that entire line of research would not have been possible without their contribution.
Just as important as all the scientific support I got, was the friendship, camaraderie and love I received throughout this journey. As a close friend and classmate sharing the Portuguese expat experience, David Raposo was often the one I shared my small successes and frustrations with. Despite being on the other US coast he was always available and able to relate to and empathise with my experiences.
Suraj Pradhan, was the first of many new friends at Stanford and one who introduced me to many new people and in the process expanded my cultural horizons more so than I could ever have imagined. He was also the instigator of many events that lead to great memories during my Stanford experience.
Justin Foster became a very close friend and one who was extremely im-portant to help me maintain a healthy and rewarding work and life bal-ance. I am thankful for all the adventures and activities we shared (from tennis to cooking and from swimming to weight lifting) and for every-thing I learned along the way. He was also a strong intellectual influence who often made me question my own biases and in the process hopefully become a better person.
My long time friends Antonio Quintino and Mario Cruz have always been incredibly supportive through the ups and downs of graduate shcool and remain as proof that true friendship withstands distance and separation.
To all my friends, I am deeply thankful for your friendship and I look forward to seeing you succeed in whatever paths you choose for your life. My life was vastly enriched through your influence.
And above all, I need to thank those closest to my heart: my brother, my parents and my girlfriend Tatyana. Tatyana made my life infinitely better since we met 2 years ago and has always been there for me with nothing but love encouragement to offer. I don’t think I could have pulled through the final and very stressful stage of the PhD without her and I am incredible grateful to have her in my life.
My parents were extremely supportive and caring throughout my life and all the steps that lead to graduate school. Even when my passion for Science made me move thousands of miles away from home to complete my PhD, their support was unconditional . It is impossible to overestimate how much they contributed in small and big ways to make this journey possible.
My brother was always my inspiration since I can remember and to this day I admire his fearlessness and ability to take on any challenge to comes up. I am grateful for all the adventures we shared and look forward to many more in the future.
Finally, I want to thank all the organisations that made this work possi-ble: IGC for hosting the doctoral programme during its first years, ITQB for partnering with the Champalimaud Foundation to confer the gradu-ate degrees and FCT and HHMI for funding the research. Huge thanks to the Champalimaud Foundation for accepting me in programme and giving me such a fantastic scientific environment to grow as a researcher. Lastly, I would like to thank everyone at Stanford University who directly or indirectly supported my research. It’s been a great honor to be a vis-iting graduate student at Stanford and I couldn’t have had a better host institution.
Dedication
I would like to dedicate this work to my parents, my brother and my av´o Maria Ant´onia.
Contents
Abstract i Acknowledgements i Dedication v List of figures ix 1 Introduction 1 1.1 Perceptual decision-making. . . 21.2 Primary Motor Cortex and Dorsal Premotor Cortex . . . 8
1.3 Summary of thesis work . . . 11
2 Response properties of dorsal premotor and primary motor cortex 12 2.1 Methods . . . 15
2.1.1 Subjects . . . 15
2.1.2 Direction Discrimination Task . . . 16
2.1.3 Random dots stimuli . . . 18
2.1.4 Behavioral Performance . . . 18
2.1.5 Array locations and recordings. . . 20
2.1.6 Datasets . . . 21
2.1.8 Choice predictive activity . . . 23
2.2 Results . . . 23
2.2.1 Behavioral results . . . 23
2.2.2 Diversity of responses of individual neurons in PMd and M1 . 27 2.2.3 Choice predictive activity in individual neurons across the trial 33 2.3 Discussion . . . 36
3 Single-trial population activity in PMd and M1 is consistent with DV representation 37 3.1 Methods . . . 38 3.1.1 Logistic regression . . . 38 3.1.2 Decision Variable . . . 39 3.1.3 DV Slope Analysis . . . 40 3.1.4 RT analysis . . . 40 3.1.5 Unit dropping . . . 41 3.2 Results . . . 41
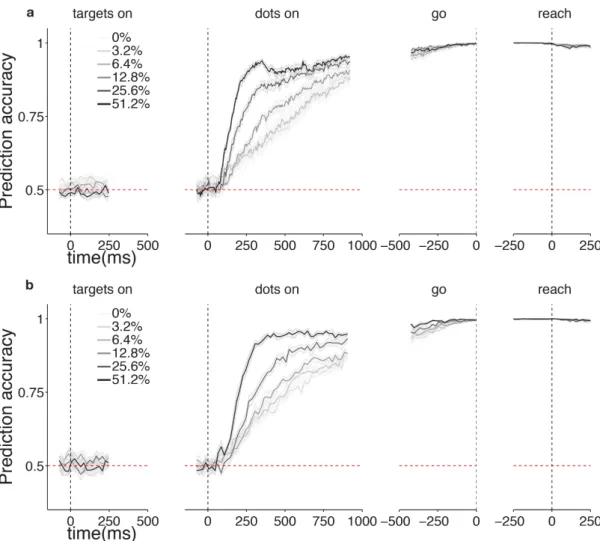
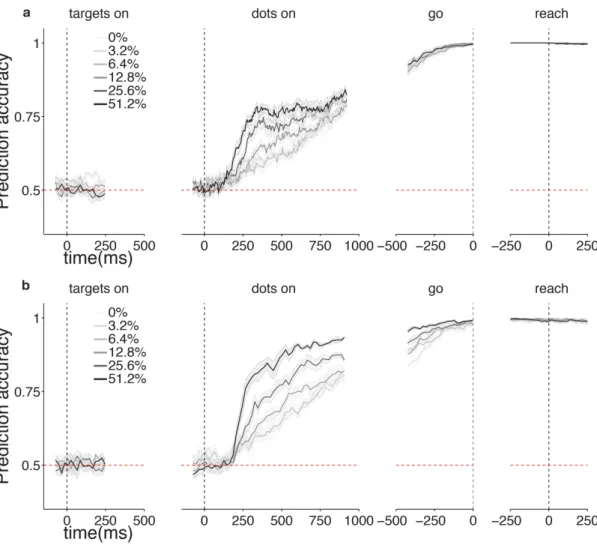
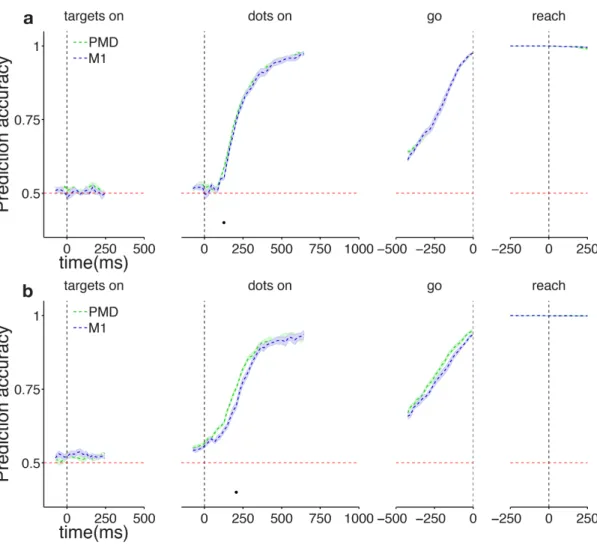
3.2.1 Populations of cells in PMd and M1 predict choice on single trials with low latency and high accuracy . . . 41
3.2.2 Choice predictive activity is compatible with the neural repre-sentation of a decision variable. . . 44
3.2.3 Stimulus duration uncertainty dramatically increases choice pre-dictive activity in both areas. . . 51
3.2.4 Increase in predictive activity is not due to motor signals . . . 54
3.2.5 Choice signal is well distributed across the population . . . 57
3.3 Discussion . . . 59
4.1 Methods . . . 65
4.1.1 Colored targets motion discrimination task . . . 65
4.1.2 Targeted Dimensionality Reduction . . . 65
4.1.3 Dots Task: Eye vs hand . . . 69
4.2 Results . . . 71
4.2.1 Multiplexed signals in LIP . . . 71
4.2.2 Multiplexed signals in PMd and M1 . . . 85
4.2.3 Reaching vs looking: response modality effects on choice signal representation . . . 93
4.3 Discussion . . . 97
4.3.1 LIP results . . . 98
4.3.2 PMd and M1 results . . . 100
5 Real-Time decoding of decision states 103 5.1 Methods . . . 104
5.1.1 Real Time Setup . . . 104
5.1.2 Real Time Task . . . 106
5.1.3 Closed Loop Experiments . . . 112
5.2 Results . . . 116
5.2.1 Decoding performance: open loop results . . . 116
5.2.2 Closed loop results - Thresholding . . . 120
5.2.3 Closed loop results - CoM . . . 125
5.3 Discussion . . . 129
6 Final remarks 130
List of figures
1.1 Motion discrimination task . . . 4
1.2 Average neural response in LIP . . . 5
1.3 Macaque Cortex . . . 9
2.1 Behavioral Task . . . 17
2.2 Chronic implantation of Utah arrays . . . 21
2.3 Electrophysiological Recordings . . . 22
2.4 Behavioral performance - Fixed duration task . . . 24
2.5 Behavioral performance - Variable duration task (no delay) . . . 24
2.6 Hand RT as a function of coherence - Fixed Duration. . . 26
2.7 Hand RT as a function of coherence - Variable Duration. . . 26
2.8 Single neuron responses in PMd - peri-movement activity . . . 28
2.9 Single neuron responses in PMd - early choice predictive activity . . . 29
2.10 Example neuron in PMd with coherence dependent choice predictive activity during dots . . . 30
2.11 Multi-unit responses in M1 - delay and peri-movement choice predictive activity . . . 31
2.12 Single neuron responses in M1 - early and delay choice predictive activity 32 2.13 Choice modulation across the trial for PMd and M1 . . . 35
3.2 Average choice prediction as function of stimulus difficulty - PMd. . . 45
3.3 Average choice prediction as function of stimulus difficulty - M1. . . . 46
3.4 Decision variable as function of stimulus difficulty. . . 47
3.5 Decision variable difference as function of stimulus difficulty. . . 48
3.6 Tri-linear Slope fitting. . . 49
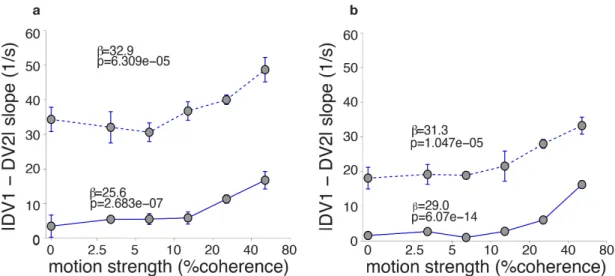
3.7 Slope values as function of stimulus strength - PMd.. . . 50
3.8 Slope values as function of stimulus strength - M1. . . 50
3.9 Neural population choice prediction accuracy on single trials - Variable Duration task without delay. . . 52
3.10 Slope values as function of stimulus strength - PMd.. . . 53
3.11 Slope values as function of stimulus strength - M1. . . 53
3.12 Neural population choice prediction accuracy on single trials - Variable Duration task with delay.. . . 54
3.13 Single trial reaction time prediction in the fixed duration task based on neural activity from PMd and M1. . . 56
3.14 Single trial reaction time prediction in the variable duration task based on neural activity from PMd and M1. . . 57
3.15 Unit dropping analysis - Fixed Duration. . . 58
3.16 Unit dropping analysis - Variable Duration. . . 59
4.1 Motion discrimination task with flexible choice mapping. . . 66
4.2 Motion discrimination task with two different operant responses. . . . 70
4.3 Choice, Stimulus Motion and Color representations in LIP - Task 1. . 72
4.4 High and low dimensional signal representation in LIP - Task 1. . . . 73
4.5 LIP signal stability throughout the dots presentation and delay period - Task 1. . . 75
4.7 High and low dimensional signal representation in LIP - Task 2. . . . 78
4.8 LIP signal stability throughout the dots presentation and delay period - Task 2. . . 79
4.9 Choice, Stimulus Motion and Color representations in LIP - Task 3. . 80
4.10 High and low dimensional signal representation in LIP - Task 3. . . . 81
4.11 LIP signal stability throughout the dots presentation and delay period - Task 3. . . 82
4.12 LIP signal stability throughout the dots presentation and delay period across all tasks. . . 83
4.13 Stability of task-relevant dimensions in LIP across all tasks. . . 84
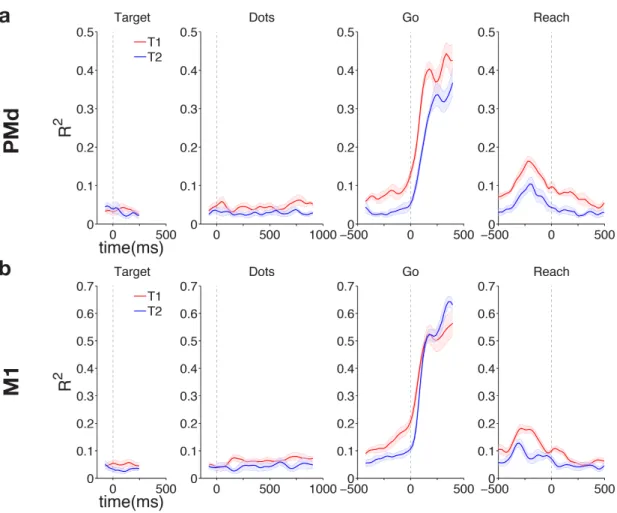
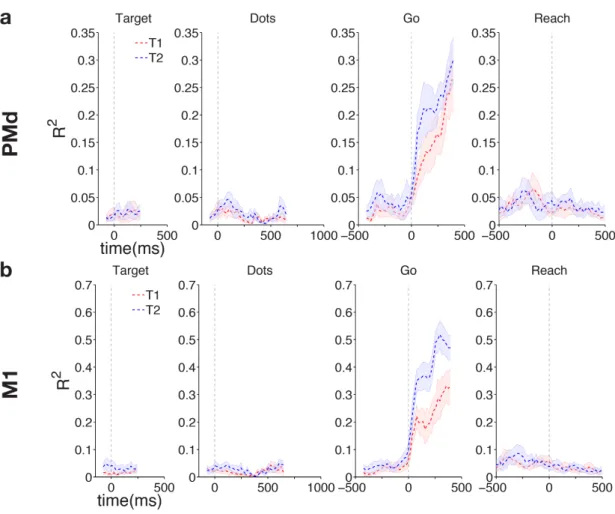
4.14 Choice, Stimulus Motion and Stimulus Difficulty representations in PMd. 87 4.15 Choice, Stimulus Motion and Stimulus Difficulty representations in M1. 88 4.16 High and low dimensional signal representation in PMd. . . 90
4.17 High and low dimensional signal representation in M1. . . 91
4.18 PMd signal stability throughout the dots presentation. . . 92
4.19 M1 signal stability throughout the dots presentation. . . 92
4.20 Choice modulation at the end of dots across motor effectors, for PMd and M1. . . 94
4.21 Population choice prediction accuracy for PMd and M1 across motor effectors. . . 95
5.1 Real Time Setup. . . 106
5.2 Real Time Task. . . 108
5.3 Real time decoder beta weights. . . 110
5.4 Closed Loop experiment 1 - Thresholding. . . 114
5.5 Closed Loop experiment 2 - CoM detection. . . 116
5.7 Real time choice prediction accuracy - Monkey F. . . 118
5.8 Real time decoding performance reliability. . . 119
5.9 Decision Variable during dots. . . 120
5.10 Example threshold trials. . . 121
5.11 Median stimulus duration as a function of threshold magnitude . . . 122
5.12 Prediction accuracy as a function of DV. . . 123
5.13 Prediction accuracy as a function of DV - stimulus coherence effects. 124 5.14 Prediction accuracy as a function of DV - stimulus duration effects. . 125
5.15 CoM frequency as a function of coherence. . . 126
5.16 CoM frequency as a function of coherence and direction. . . 126
5.17 CoM frequency as a function of time in the trial.. . . 127
1
Introduction
It’s just another work day and you are driving to the office in dense traffic. Without you even being fully aware, your brain is continuously doing multiple calculations regarding the position and speed of nearby cars, having very limited time to fully integrate that information. It might even be evaluating other stimuli that abstractly represent rules like a red light or yield sign. And it is doing all this almost seamlessly to ensure you make decisions that lead to the most appropriate action, such as breaking steering or staying on the throttle. Of course at times mistakes are made, but the brain’s ability to combine external information often of different modalities (motion and sound for example) is remarkable and often unappreciated. Intriguingly, even though these abilities are often taken for granted they are still not fully understood in the context of neuroscience. What areas are responsible for this chain of processes? How do they adapt to different contexts and rules? What mechanisms do they use to integrate and select relevant evidence? What leads us to make mistakes? All these questions remain to a large extent unanswered and are at the core of what the perceptual decision-making field is pursuing.
Naturally, not all decisions we make are of this nature. We can make choices that require more abstract concepts such as buying a car or deciding between two items at the grocery store. These types of decisions often depend on an abstract valuation of the options and fall under the scope of the value-based decision-making field.
not just from the possibility of understanding those specific process but because it
provides a unique ”window on cognition” (Shadlen and Gold,2004). Decisions go far
beyond the association between stimuli and responses and can be conceptualized as the weighed the deliberation of evidence towards multiple choices. This deliberation process can take into account very different sources of evidence (sensory or not) and combine it to reach a categorical decision. Understanding the computations underlying these processes will allow further understanding of cognition itself.
In this work we explore signatures of perceptual decision-making in the somato-motor system and at the level of individual trials.
1.1
Perceptual decision-making
Perceptual decision-making can be defined as the field of Neuroscience that studies the neural processes responsible for weighing available evidence in the world and deliberating on it with the purpose of reaching a commitment to a proposition or selecting an appropriate action. Classically, this sequence of neural events has been
broken down into three consecutive stages (Graham, 1989):
1. Stimulus processing stage during which a representation of the relevant stimulus is created in primary and secondary sensory areas;
2. This representation is then used in the deliberation stage during which the stimulus is evaluated and a categorical decision is reached.
3. This information is then fed to the appropriate motor area responsible for im-plementing the corresponding behavior. This stage can be interpreted as the action execution stage
Despite being a conceptual simplification, this framework has been extremely in-formative in terms of guiding the design of experiments and interpretation of data. There are some hints that some of these stages might be more blended both in time
and brain regions than initially suggested but the intuition still stands (Shadlen and
scenario is a great example of perceptual decision-making in real-life since all stages are present and clear. However, such a scenario would be too unconstrained to re-alistically be useful to start understanding the underlying neural processes. Instead, researchers have had to design tightly parametrised paradigms that allow as much control as possible over the stimulus being presented and the subject’s behavior. Only then meaningful correlations between neural signals and behavior could start being established. Decision-making is too hard of a process to initially approach in an unconstrained manner.
Faced with these constraints researchers have converged on a basic formula for perceptual decision-making paradigms: a stimulus is presented to the subject for a certain period of time after which a categorical decision must be reached and reported by performing the contingent operant response. The same sequence is repeated for hundreds or thousands of trials during which certain parameters under the exper-imenters’ control will be randomly or deterministically changed. In most variants there are only 2 categorical choices available to the subject hence their designation: 2 Alternative Forced Choice (2AFC) tasks. 2AFCs have been used to study perceptual
decision-making across modalities from visual (Britten et al.,1992), to somatosensory
(Romo et al., 1998) to auditory or audiovisual (Chandrasekaran et al.,2013).
Historically, this line of research started with the visual system of primates in Bill
Newsome’s laboratory (for a review, see Shadlen and Kiani, 2013). Bill Newsome,
Tony Movshon and Ken Britten were at the time interested in describing the visual responses of area MT/V5. To this end they recorded extra-cellular activity from this area while rhesus macaques performed a challenging motion discrimination task. This
paradigm, known as the random dots paradigm (Figure1.1) has been a true workhorse
in the field and is still actively used today. The task assigned to the monkey consists of discriminating the net direction of a noisy visual stimulus. The stimulus is formed by dots that flicker on a computer screen and that, with a given probability, move in a direction specified by the experimenter. This probability is termed stimulus coherence and quantifies the net direction of dots motion. The difficulty of a given trial can be tightly parametrised by the coherence of the stimulus. Because of the stochastic
Figure 1.1: Motion discrimination task. a) Dots task structure. The monkey starts the trial by fixation on a fixation point on the screen. After a fixed delay two targets appear on opposite locations. The monkey is then asked to discriminate the net direction of motion of a visual stimulus consisting of flickering dots. The duration of the stimulus presentation was fixed and the difficulty of the trial adjusted by the coherence of the stimulus. Once the stimulus is removed from the screen the monkey is asked to withhold its response for a variable period of time. The go cue is signaled by the offset of the fixation point after which the monkey is free to report its choice by saccading to one of the two visual targets on the screen. The monkey was trained to saccade to the left for leftward motion and right for rightward motion. b) Dots task timing. After a fixed delay from the fixation point onset the two targets were shown and would remain on until the end of the trial. The stimulus was shown for 1 of 3 durations which was constant for each session. The fixation point was removed after a random delay period had elapsed. The duration was random to prevent the
monkey from timing its response. Adapted from (Shadlen and Newsome, 2001)
nature of the stimulus though, for a given coherence some sequences of frames will have slightly higher or slightly lower motion information and the best strategy for the subject to decipher the true coherence (and thus direction) is to integrate as many samples as possible over time. This created the perfect setting for studying the visual responses to a time-varying stimulus and later on to study decisions that unfold over time. After viewing the stimulus, the monkey was asked to report its perceived direction by performing a saccadic eye movement to one of two visual targets on the screen (each corresponding to one direction of motion).
It was already known that neurons in area MT are tuned to the direction of motion of visual stimuli and that these neurons clustered in columns of other neurons
Figure 1.2: Average neural response in LIP. Firing rates as a function of time averaged for all 104 LIP neurons recorded. Activity was aligned to motion stimulus onset (left) and saccade initiation (right). Trials were sorted by choice and stimulus coherence (error trials not shown). Trials in which the monkey chose the target in (opposite to) the Response field (RF) are shown in solid (dashed) traces and. Adapted
from (Shadlen and Newsome, 2001)
was that this brain area was in fact required to perform the dots task (Newsome
and Par´e, 1988) (through lesion experiments) and that one could bias the monkey’s judgement by applying an external electrical current to a patch of tissue in MT (Salzman et al., 1990). This technique, known as electrical microstimulation took advantage of the columnar organisation of cells in MT and biased the monkey in a predictable way: stimulating a patch of cells that prefer leftward motion would lead to a strong leftward behavioral bias. Together these results suggested a causal role for MT in processing the visual stimulus, allowing the subjects to perform the task. Moreover, by recording individual neuron responses in MT while monkeys performed the task, these researchers found that these neurons responded in a way that covaried tightly with the stimulus direction and coherence and its ability to discriminate stimuli
rivaled that of the subject (Britten et al., 1992).
Finally, these neurons also displayed trial to trial fluctuations, which weakly but
significantly correlated with the ultimate choice of the monkey on those trials (Britten
et al., 1996). Together, these results lead to the hypothesis that signals from pools of MT neurons with opposite preferred directions were being compared (subtracted)
hypothesized this resulting signal would be integrated over time by another brain area and used as a ”decision variable” to determine which categorical choice would be made. Amongst candidate areas where this function could be implemented was Lateral Intraparietal Area (LIP). It receives strong visual inputs from MT (and MST)
and projects to areas that directly control eye movements (Andersen et al.,1990)
con-ferring it with the appropriate set of inputs and output to combine visual information about the stimulus and inform downstream areas about what movement to execute.
Moreover, other studies had also demonstrated (Barash et al., 1991; Gnadt and
An-dersen, 1988) this area kept a steady representation of the location monkeys were asked to saccade to seconds before the action was initiated. Despite the promising combination of features no one knew what signals would be present in LIP during a cognitive task. The results of these experiments would transform the field of decision-making and have a strong impact in systems neuroscience as a whole. While monkeys performed the dots task, Bill Newsome and Michael Shadlen found cells in LIP that
indeed seem to represent the integral of the difference in MT activity (Shadlen and
Newsome,2001). These cells responded to the dots presentation ∼ 200 msec after the
stimulus onset (Figure 1.2). For stimuli supporting a saccade in the cell’s response
field (RF) firing rates were increased with a rate that covaried tightly with the motion magnitude. Symmetrically, for motion in the opposite direction firing rates were sup-pressed in a way that was also directly proportional to the motion magnitude. These observations suggest that indeed LIP is representing the accumulation of evidence captured by MT. During the delay period, the firing rates for each choice start to converge regardless of coherence, and for the choice to the RF they peak right around the initiation of the saccadic movement. This data suggests that late into the delay period and around the time of movement the integration of evidence has stopped and given way to a categorical choice that leads to the appropriate saccade.
More recently, additional experiments have suggested that motion information is indeed integrated by LIP. In these experiments pulses of motion were added to the
regular stimulus on individual trials and LIP reflected the additional information (Huk
experiment showed a causal but small effect of LIP stimulation in biasing the monkey’s
behavior towards the contralateral choice (Hanks et al., 2006). Other experiments
performed without pre-selecting LIP neurons show that besides the canonical response
profile (Figure1.2) many other signals are present in LIP suggesting its involvement
in other aspects of action selection.
Using a modified version of the task Kiani and Shadlen showed that not only choice and motion strength are reflected in LIP activity but also the uncertainty of the
subject about its own decision (Kiani and Shadlen,2009) and post-error adjustments
in strategy (Purcell and Kiani, 2016), expanding even further the functions present
in this area.
Complementing the findings from historical and current studies of perceptual decision-making in primate brain regions, newer studies have begun to employ ro-dents as an animal model and also the same rigorous psychophysical techniques and
paradigms (Carandini and Churchland, 2013; Murakami and Mainen, 2015). For
in-stance, researchers were able to train rats to proficiently perform complex olfactory (Uchida and Mainen,2003), auditory (Brunton et al.,2013) and audiovisual
discrimi-nation tasks (Raposo et al.,2012). Combining proficient discrimination behavior with
recordings from somewhat analogous brain structures to the primate brain, these
re-searchers demonstrated that neurons in the posterior parietal cortex (Raposo et al.,
2014), frontal orienting fields (Hanks et al., 2015), and secondary motor cortex (
Mu-rakami et al., 2014) amongst other areas, contain clear decision related activity that often conforms to predictions made by mathematical models of integration of evidence (Ratcliff, 1978; Mazurek et al., 2003). Besides faster iteration times and lower costs and risks associated with this type of research, rats also offer the exciting opportunity
do take full advantage of genetic and optogenetic tools (Carandini and Churchland,
2013; Zalocusky et al., 2016). Optogenetics allows researchers to manipulate activ-ity in specific circuits by shining light on targeted neurons, expressing light sensitive ion channels. By doing so, it is possible to dissect circuit function and establish a
causal link between activity in these circuits and behavior. In recent studies (Hanks
paradigm, electrophysiological recordings, and optogenetics to causally differentiate the roles of frontal orienting field neurons and parietal neurons in the integration of
auditory evidence. While, opotogenetic tools are in development for primates (
Di-ester et al., 2011) they are still not as robust and ubiquitous compared to those for rodents.
On the opposite end of the spectrum of model complexity, human studies have also made a significant contribution to the field of perceptual decision-making. Taking advantage of not invasive techniques (such as EEG or MEG) and similar behavioral paradigms to those used in animal models, researchers have shown the existence of
signals that predict choice (Donner et al., 2009) and reaction time (Dmochowski and
Norcia,2015) and whose features are reminiscent of signals present on individual neu-rons of oculomotor structures of macaques. In some cases these signals are modulated
by the quality of evidence on individual trials (Kubanek et al.,2013;O’Connell et al.,
2012) suggesting similar processes of accumulation of evidence between humans and
non-human primates. Importantly in several of these studies the areas thought to be the source of these signals are central and parietal areas of the brain which integrate
the oculomotor and somatomotor system (Kubanek et al., 2013; O’Connell et al.,
2012; Dmochowski and Norcia, 2015). These results further justify the study of in-dividual neurons and populations of neurons in analogous brain areas of non-human primates by hinting at common mechanisms for cognition.
1.2
Primary Motor Cortex and Dorsal Premotor
Cortex
Early on researchers hypothesized that areas that combine visual information and hold the decision of the subject in working memory might themselves ”lend insight
into the computation of the decision itself” (Shadlen and Newsome,2001). Following
this rationale the main targets for studying visually based decision making have been premotor structures that receive strong visual inputs and send signals to motor struc-tures to execute movements. Since much of the work in the field has focused on the
CHAPTER 1. INTRODUCTION
3
PMd
M1 PMd
Figure 1.1: The locations of primary motor cortex (M1) and dorsal premotor cortex (PMd)
on the rhesus brain. Anterior is to the right. Adapted from Churchland et al. (2010a).
.
(Dum and Strick, 1991), and because they are generally thought to be the most
crit-ical areas for visually-controlled reaching (Boussaoud and Wise, 1993; Halsband and
Passingham, 1985; Moll and Kuypers, 1977; Mushiake et al., 1991; Passingham, 1985;
Tanji, 2001; Weinrich and Wise, 1982; Weinrich et al., 1984). Thus, they comprise
the most direct brain outputs for controlling reaching.
In addition to being involved in controlling movement itself (Evarts, 1966;
Ley-ton and SherringLey-ton, 1917; Weinrich and Wise, 1982), M1 and PMd (among other
areas) are also known to be involved in the preparation of movement (Crammond
and Kalaska, 2000; Godschalk et al., 1985; Kurata, 1989; Messier and Kalaska, 2000;
Riehle and Requin, 1989; Snyder et al., 1997; Tanji and Evarts, 1976; Weinrich et al.,
1984). This process of movement preparation is not optional (e.g., Day et al., 1989;
Ghez et al., 1997; Keele, 1968; Kutas and Donchin, 1974; Riehle and Requin, 1993;
Rosenbaum, 1980; Wise, 1985). That is, when presented with a cue to move, we are
unable to begin moving immediately. Instead, it appears that the brain must perform
some time-consuming process before it sends commands to the muscles. If the
up-coming movement is instructed during a delay period before the ‘Go’ cue, the brain
can be given a ‘head start’ in performing these computations (e.g., Crammond and
Kalaska, 2000; Riehle and Requin, 1989; Rosenbaum, 1980), thereby speeding the
re-action time (RT; e.g., Churchland et al. 2006c; Figure 1.2). This preparatory process
Figure 1.3: Macaque Cortex. Gross anatomy of the macaque cortex with M1 and PMd areas highlighted. Right side is anterior. Courtesy of Matthew Kaufman oculomotor system, LIP and FEF have been the main targeted brain areas in previous studies. We wanted to expand and adapt this framework to the somatomotor system, a more complex modality used by primates to act on the world. The primate motor system is a complex network involving many cortical areas (parietal and frontal), as well as sub cortical areas and the cerebellum. In this project we focused on Dorsal
Premotor (PMd) and Primary Motor (M1) cortices ( Figure 1.3). The reasons for
this particular choice are of anatomical, functional and also practical nature.
Anatomically, these areas receive short latency visual signals (as short as 80 msec
in latency, seeSong and McPeek(2010)) and also project directly to the spinal cord.
In fact, together they account for 60% of the cortical spinal projections (Dum and
Strick,1991; He et al., 1995; Dum and Strick, 2002). The combination of inputs and outputs in these areas is at the base of their involvement in control of visually guided movements and potentially places them in a analogous position to LIP and FEF in the motor system.
Functionally, both PMd and M1 have been demonstrated to be responsible for
movement execution and planning (Boussaoud and Wise, 1993; Weinrich and Wise,
1982; Weinrich et al., 1984; Tanji and Evarts, 1976). Besides extensive correlational data, microstimulation experiments have shown that muscle twitches can be evoked (Strick and Preston, 1978; Weinrich and Wise, 1982), movement plans can be
dis-rupted (Churchland and Shenoy, 2007b) and simple or complex movements evoked
re-gions. These results confirm the causal role of these brain areas in both movement planning and execution. Together these functions have comprised the more canonical view of the functions carried out by PMd and M1. However, recent studies have expanded the repertoire of functions of circuits in PMd including a more cognitive
role in decisions reported with arm movements. In one of these studies (Cisek and
Kalaska, 2005) it was suggested that in a cued choice task, before the correct tar-get was signaled, both choice plans were represented in some neurons in PMd, well before movement initiation. Later, the same group of researchers showed results sup-porting a more sophisticated mechanism that tracked the evidence supsup-porting either
categorical choice over time (Thura and Cisek, 2014).
Finally, another study showed strong evidence for the presence of neural correlates of complex cognitive operations such as vacillation or deliberation in PMd during
a free or forced choice task (Kaufman et al., 2015). In comparison, M1 remains
much more poorly characterised in the context of cognitive tasks perhaps due to the prevalent idea that it ought to only be involved in motor planning and execution given the overwhelming amount of evidence supporting that role. In that sense it wasn’t as suitable as a candidate area for studying decision formation but the differences between M1 and PMd in a more cognitive setting had never been established in a way that was satisfactory to us.
In the end practical aspects also played a role in our choice of brain areas in which to study perceptual decision-making. Since performing multi-electrode recordings that could allow for single-trial analysis was a requirement, flat brain areas suitable for Utah array implantation were preferred. This method had been extensively and
successfully used in PMd and M1 to implement Brain-Machine Interfaces (Santhanam
et al., 2006; Gilja et al., 2012, 2015) and to study motor preparation (Churchland et al., 2006;Afshar et al.,2011; Kaufman et al.,2014) further supporting our choice.
1.3
Summary of thesis work
The subsequent chapters contain the main findings of my doctoral thesis project and their interpretation in the context of the existing literature. The methods used are described at the beginning of the corresponding chapter.
In Chapter 2 we describe the modified motion discrimination task and multi-electrode recordings we use to study decision formation. We demonstrate that sub-jects perform extremely well and that diverse neural responses are present in both PMd and M1. Crucially a fraction of the recorded neurons represents the evolving decision from very early on in the trial, which will serve as a window into the decision formation process.
In Chapter 3, we take full advantage of our simultaneous recordings and show evidence for strong and interpretable single-trial decision formation signals in both areas. These signals are surprisingly flexible and adapt to the cognitive demands imposed on the subject.
In Chapter 4, we start by drawing comparisons between our own results and data obtained in LIP by another research group. We go beyond describing choice predictive signals and provide a more complete picture of other variables represented in PMd and M1 during the motion discrimination task. Furthermore, we compare our decision-related activity in PMd and M1 across motor effectors and demonstrate some of these signals are supra-modal.
In Chapter 5, we go one step further and test a real-time setup we built, that at-tempts to decode nearly instantaneous decision states. We find an impressive match between predicted and observed likelihood of choice and validate small and fast fluctu-ations in the decision state. After learning our nearly instantaneous Decision Variable has a clear and predictable bearing on behavior we use this setup and framework as a tool to study changes of mind. Changes of mind are a complex cognitive phenomenon whose validation at the neural level has been extremely challenging to perform.
Finally in Chapter 6 we discuss the results reported in this thesis and elaborate on how they fit with the literature in the field.
2
Response properties of dorsal
premotor and primary motor
cortex
The perceptual decision-making field has, to a large extent, been shaped by seminal
studies done in parietal and frontal areas of the oculomotor system (Shadlen and
Newsome, 2001;Roitman and Shadlen,2002;Mante et al.,2013). Individual neurons in these areas carry choice-related signals that match predictions made by
mathe-matical models of integration of visual evidence (Ratcliff,1978;Mazurek et al.,2003)
and have been interpreted as correlates of decision-formation that express ”decision variables”. The main hallmarks of these choice predictive signals are:
• Short latency from the onset of the stimulus which the subject is going to evaluate in the process making a choice.
• Increasing magnitude over time as more evidence comes in through the visual system and the decision becomes categorical.
• Lawful dependence on stimulus difficulty: stronger rise (slope) for easier stimuli and weaker rise for harder stimuli.
• Stronger dependence on choice than stimulus: for two presentations of the same stimulus that lead to opposite choices, the activity levels should be quite
dif-ferent since the decision-signals are strongly choice predictive and only slightly stimulus predictive.
• Stronger magnitude for correct than incorrect choices within a stimulus difficulty level.
While a tremendous amount of knowledge has been acquired through past studies many questions and limitations remain. First, are the mechanisms general or are they specific for the oculomotor system? In most prior studies the decision-related areas being studied are part of the visual stream processing the stimulus itself. It could be that the properties reported in these decision areas are a consequence of the projections from visual areas processing the motion and strength of the stimulus such as area MT. Moreover, while having monkeys report a decision with an eye movement enables high experimental control and precise quantification of the subject’s behavior it is not the only type of response primates would likely use in a naturalistic context. Limb movements such as arm movements are used to report decisions in different contexts such as running or climbing to avoid predators or grooming another mem-ber of the colony. While (especially) PMd and (perhaps) M1 seemed good candidate areas for studying decision formation in the somatomotor system, the literature in this field is still scarce despite the growing interest in this line of research in recent
years (Coallier et al.,2015;Thura and Cisek,2014;Kaufman et al.,2015;Hoshi,2013;
Pastor-Bernier and Cisek, 2011). PMd and M1 have been extensively studied in the
context of motor preparation and execution (Georgopoulos et al., 1982; Churchland
and Shenoy,2007a;Churchland et al.,2010), but in comparison to oculomotor struc-tures, little has been done using cognitive tasks. This difference comes from the fact
that, until recently(Cisek and Kalaska, 2005), somatomotor areas such as PMd and
M1 were thought to mostly carry motoric signals due to their proximity to the motor periphery. Despite being tempting to speculate about parallels between the cognitive signals extensively described in the oculomotor system and those hinted by some of these recent studies in the somatomotor system, there is little hard data to establish
New-some,2001;Roitman and Shadlen,2002;Kiani et al.,2008) have pre-selected neurons for strong delay period activity during delayed saccade or memory saccade tasks. This response feature has been assumed to be a good predictor of decision related activity in perceptual discrimination tasks. While this approach has yielded neurons with fairly homogeneous and task relevant responses, it also hides the natural diver-sity of neural responses in these areas. A recent study has tackled this limitation
with surprising results (Meister et al., 2013).). By recording LIP neurons without
pre-screening them for strong delay activity, researchers found the canonical ramping neurons are just a subset of much more diverse pool of neurons. Many other neurons represent other signals that, despite being task-related, can’t easily be interpreted as a neural correlate of evidence accumulation. Moreover, even the correlation between delay activity in a memory guided saccade task and decision related activity during the dots task turned out to be weaker than initially expected, especially when
con-sidering a larger pool of neurons. In another study (Mante et al., 2013), researchers
applied a similarly unbiased approach and combined it with an order of magnitude increase of the typical number of recorded units from one to two hundred to over a thousand. Having such a massive dataset allowed researchers to determine that all combinations of selectivity for task relevant signals (context, stimulus motion, stimu-lus color and choice) were present across cells in PFC, with no clear distinct cstimu-lusters or categories. Obtaining a deeper understanding of what neural circuits are doing in the context of perceptual decision tasks requires an unbiased recording and analysis approach.
Our goals for the studies in this chapter were fourfold:
1. To successfully employ a variant of the classical motion discrimination task in which we replaced the eye movement response with an arm movement response. This change will allow us to tackle the lack of cognitive tasks used study decision formation in somatomotor areas PMd and M1.
2. To implement, in parallel, a chronic multi-electrode recording technique widely
Church-land et al., 2006; Afshar et al., 2011; Kaufman et al., 2014) and to implement neural prostheses for the motor system in both human and non-human primates (Santhanam et al.,2006;Gilja et al.,2012,2015). This technique provides great spatial coverage of these superficial areas and enables an unbiased characteri-zation of neural responses. We further this unbiased approach by analyzing all recorded units without a pre-screening process.
3. To broadly describe the spectrum of individual neural responses during the fixed duration motion discrimination task by leveraging goals 1 and 2 and look for examples of neurons carrying decision-related signals as defined by their hallmarks.
4. To obtain an overall picture of the strength and distribution of choice predictive activity across units and time.
Author contributions: Diogo Peixoto, Roozbeh Kiani and William Newsome designed the behavioral task. Diogo Peixoto and Sania Fong trained the subjects until full proficiency was achieved. Diogo Peixoto and Stephen Ryu performed the surgery to implant the Utah arrays. Diogo Peixoto ran the experiments to collect the data, performed the analysis and generated the figures presented in this chapter.
2.1
Methods
2.1.1
Subjects
We recorded from populations of neurons in dorsal premotor and primary motor cor-tex of two macaque monkeys performing a direction discrimination task with arm reaches as the operant response. All training, surgery, and recording procedures con-formed to the National Institutes of Health Guide for the Care and Use of Laboratory Animals and were approved by Stanford University Animal Care and Use Committee.
2.1.2
Direction Discrimination Task
The task employed is a variation of the classical dots discrimination task, in which uses an arm movement as the operant response. We used two variants of this task that differed based on the stimulus duration employed. The first version we implemented was a classical fixed duration task, in which every stimulus presentation lasted 1000 ms. We termed this version the fixed duration task. In contrast, we also employed a version in which the duration of the stimulus presentation varied from trial to trial. The stimulus duration ranged from 200-1000 (median 435 ms) and it was randomly chosen on each trial by sampling an exponential distribution. We termed this version, the variable duration task. Within the variable duration task we employed two sub-variants: one with delay period, similar in that regard to the fixed task and one without delay period. We will refer to the two specific tasks as variable duration with delay and variable duration with no delay from here on. For all variants, the trial starts with the onset of a fixation point (FP; 1.5 degree diameter) on a video
touchscreen (ELO Touchsystems 1939L, Figure2.1). To initiate the task, the monkey
was required to maintain both eye and hand fixation within +/- 3 degrees of the FP as long as it remained on the screen. Eye position was continuously tracked with an electronic eye tracker at 1KHz (EyeLink 1000, SR Research, Canada) and hand position was tracked at 75Hz using the video touchscreen Importantly, throughout the entire trial, the monkey was required to always maintain direct hand contact with the screen otherwise the trial would be aborted.
After 300 ms of fixation, two targets (1.5 degree diameter) appeared on opposite sides of and at same distance from the FP. After a 500 ms delay the random dot stimulus was presented for either 1000 ms (fixed duration) or 200-1000 ms (variable duration), depending on the task variant, after which it was removed from the screen. On each trial a fraction of the dots moved coherently along the horizontal axis in the 0 and 180 degrees directions. The monkey was asked to report the net direction of motion by reaching to the target in the corresponding direction. The difficulty of the task was adjusted by changing the fraction of dots moving coherently in one direction
Figure 2.1: Behavioral Task. a) Direction discrimination task structure - Trials start with the onset of a fixation point (FP) on the touchscreen. Once both eye and hand fixation are acquired two targets appear on the screen. The motion stimulus was shown after a short delay (500 ms) and lasted 1000 ms (200-1000 ms) for the fixed (variable) duration version. The dots offset was followed by a 400-900 ms delay in the fixed duration and variable duration with delay versions whereas no delay was present for the variable duration with no delay task. At the end of the delay or dots (if there was no delay), the offset of the FP cued the monkey to go and report his decision by making a hand reach movement to the appropriate target. Correct trials (for which the monkey reached for the target corresponding to the stimulus net direction of motion) were rewarded with a drop of juice whereas incorrect trials lead to a small timeout (2-4 seconds).
(motion strength) (Britten et al., 1992). After the stimulus offset the monkey either
entered a delay period during which it was required to withhold his response for 400-900 ms (for the fixed duration task and the variable duration task with delay) or was immediately presented the go cue (variable duration task with no delay). The go cue was then signaled by the offset of the FP at which point the monkey was free to gaze anywhere and report his decision with his arm by reaching one of the two targets. Although gaze was monitored, reward acquisition depended solely on reaching to the correct target. Finally, for a response to be considered valid, the monkey was required to hold its hand position within +/- 4 degrees of the center of the target for 200 ms. The monkey was then rewarded with a drop of juice for correct choices and given a timeout (2-4 seconds) for incorrect ones. Zero coherence trials were rewarded randomly with a probability of 0.5 since there was no correct response on these trials.
2.1.3
Random dots stimuli
The stimuli used in our psychophysical experiment were random dot kinematograms (RDK) generated using MATLAB and Psychophysics Toolbox. Stimuli were pre-sented on a 19-inch LCD touch monitor (Elo Touchsystems) with 75 Hz frame rate and 800 x 600 pixels resolution positioned 30 cm away from the monkey. The details
for generating the random dots stimuli have been described previously (Kiani et al.,
2008). We used the same algorithm and parameters except: (1) the stimulus duration
was fixed at 1 s for the fixed duration task and variable from 0.2s -1 s in the variable duration task; (2) the diameter of the stimulus aperture was 14 degrees, and (3) the speed of the dots was 8 degrees / second. The dot density was 16.7 dots deg-2 s-1, and the dot size 2 pixels. To create the impression of motion, the dots in the RDK were split into 3 consecutive sets with the same number of elements (1 set displayed for each individual frame) and displaced 3 frames (40 ms) later. The fraction of dots displaced coherently toward one of the two targets was determined by the coherence (motion strength), with the remaining dots being displaced randomly. For both monkeys, the motion strength could take one of 6 possible values: 0%,3.2%,6.4%,12.8%,25.6% and 51.2%. The direction and coherence of the motion were randomly assigned on each trial by sampling from a uniform distribution with replacement. For zero-coherence stimuli all dots were displaced randomly but, due to the stochasticity of that process, one obtains non-zero net motion toward the targets over a small number of frames.
2.1.4
Behavioral Performance
Training 2 monkeys to perform all versions of the dots discrimination task with excel-lent behavior required a very thorough operant conditioning protocol. The protocol had to be adapted to the individual monkeys since they had very different training histories: monkey H was a naive monkey whereas monkey F had been trained on a saccade version of the motion discrimination fixed duration task. Monkey H started by being rewarded just for touching the touchscreen and then gradually progressed to an instructed reach task and from there to a delayed reach task. Once he was
pro-ficient in using the touchscreen, the dots stimulus was introduced, cueing the correct target to reach to at the end of the trial. Only easy coherences were used at first, with lower and lower coherences being introduced gradually until the final set was used. The final component of training was eye fixation. Eye fixation was trained by introducing blocks of trials for which the front plate of the primate chair was closed, cueing the monkey to perform the task with eye movements. The fixation window size was gradually decreased, and then eye fixation was also required during the reach blocks. By aborting trials if eye or hand fixation was broken the subject learned both were required to perform the final task. Monkey F on the other hand was already pro-ficient at discriminating motion so the main focus of training was achieving propro-ficient use of the touchscreen with his hand. The same initial sequence of steps was used to train monkey F to perform delayed reaches. From that point on, the training was focused on combining the knowledge about the previous knowledge dots task with the reaching response. Coherences were also introduced sequentially from highest to lowest but at much faster pace compared to monkey H. Recording sessions only started when good psychophysical performance was achieved. Psychophysical perfor-mance was assessed in two ways: by describing the percentage of correct choices as a function of (unsigned) stimulus coherence and by describing the percentage of right choices as a function of signed stimulus coherence. The percentage of correct choices as a function of motion strength (stimulus coherence) was fit by a cumulative Weibull distribution function:
Pcorrect(c) = 1 − 0.5 × e(−c/β)
α
(2.1)
where Pcorrect(c) is probability correct, c is motion strength, α is the psychophysical
threshold (the value of c that corresponds to 82% correct responses), and β is a parameter that controls the shape of the function, especially its steepness.
The percentage of rightward choices as a function of motion strength and direction,
Pright(c) =
1
1 + e−β1×(β0+c) (2.2)
The motion strength corresponding to the indifference point, β0, was used to assess
the monkeys bias on each session.
In addition to psychophysical performance two behavioral metrics related to the arm reach itself were also quantified: reaction time (RT) and hand velocity. To obtain precise measurements of reaction times and maximum hand velocity we used the raw hand position data on each trial. We started by up-sampling the raw data by a factor of 13 to obtain artificial 1 ms resolution (since it had been acquired at 75Hz). Then we smoothed the up-sampled data by performing local linear regression to obtain smooth hand traces for each trial. The instantaneous velocity was calculated as the norm of the sum of vertical and horizontal speed components (the instantaneous derivative of the position). The peak hand velocity was calculated for each trial and reaction time was determined as the interval between the presentation of the go signal and the time point at which 20% of the peak velocity was reached.
2.1.5
Array locations and recordings
2 multielectrode arrays (Blackrock Microsystems, Utah) with 96 electrodes each (1mm
long platinum-irididium electrodes, 0.4 mm spacing, impedance 400 KOhm) were
implanted in primary motor and dorsal premotor cortex of each monkey (Figure2.2).
The arrays were placed anterior to the central sulcus, posterior to the arcuate sulcus
and lateral but near the superior pre-central dimple (Churchland et al., 2010). Prior
to the array implantation, single electrode recordings were performed (FHC, Maine) by lowering dura-piercing electrodes (tungsten, average impedance 6 MOhm) through burr holes, to determine the best location for the arrays. M-L position was determined by performing muscle palpation during recordings and searching for a strong upper arm representation; A-P position was determined by strong perimotor/delay activity in a delayed reach task for M1/PMd, respectively. The coordinates for the best sites were calculated with respect to the center of the chamber and verified during surgery
Figure 2.2: .
Chronic implantation of Utah arrays. Location of the two multielectrode
arrays implanted in primary motor and dorsal premotor cortex with respect to anatomical references (Monkey H): A-anterior P-posterior M-medial L-lateral. Arcuate Sulcus (AS), Central Sulcus (CS), Superior Pre-central Dimple (SPCD) using stereotaxic measurements. These coordinates were used to the best extent to determine the final location of the arrays, subject to anatomical constraints (curvature of the cortex, blood vessels etc). Continuous neural data were acquired and saved to disk from each channel (sampling rate 30 kHz) and thresholded at -4.5 RMS ( Figure
2.3). Waveforms corresponding to threshold crossings were sorted offline (Plexon
Inc., Dallas) using both semi-automatic clustering methods and manual sorting. For all analysis presented in this thesis we did not differentiate between single-units and multi-units. Our goal was maximize population predictive power and spatial coverage of the cortex and not just to select the very best isolated single-units. The number of units collected in each experimental session typically ranged from 100-180 per array.
2.1.6
Datasets
For each task version and monkey we analyzed all datasets from each brain area that met two behavioral inclusion criteria: 1) over 750 trials and 2) a behavioral
bias (|β0|) under 5%, as determined by a logistic regression fit.. These criteria were
imposed to guarantee we have a sizeable number of trials per condition (6 coherence x 2 directions = 12 conditions) and that the behavior of the monkey is virtually
Figure 2.3: Electrophysiological Recordings. Snapshot of the waveforms cap-tured through the 192 Channels corresponding 2 the Utah Arrays in a) PMd and b) M1. Data is shown for the same recording session in Monkey H.
unbiased, such that both neural and behavioral results are more easily interpretable. These criteria resulted in a selection of 9 (7) sessions of the fixed duration task and 6 (5) sessions of the variable duration task with no delay for monkey H (F), respectively. Data from both areas was collected simultaneously and the same recording sessions were used.
2.1.7
Peri-stimulus time histograms (PSTHs)
PSTHs were generated by aligning spike trains of each trial to relevant task events: target onset, stimulus onset, go cue, and movement initiation. These spike trains were then convolved with a gaussian kernel with a 50 msec acausal and a 50 ms causal component. The standard deviation of the gaussian used was 30 msec. The resulting spike density functions were then sorted by experimental condition. For the red/blue PSTHs we sorted trials based on the final choice of the monkey (left or right) and whether the reported decision was correct or wrong (correct wrong). For the black and grey PSTHs we focused on coherence and choice effects thus sorting the trials by choice (left or right) and the coherence of the stimulus: 3.2%, 12.8% and 51.2%. The other 3 coherences were not plotted to prevent crowding the figures. Only correct choices were selected for this figure, meaning the direction of the stimulus and the choice of the monkey are always congruent. Once the trials were selected for the
specified condition, their spike density functions were averaged.
2.1.8
Choice predictive activity
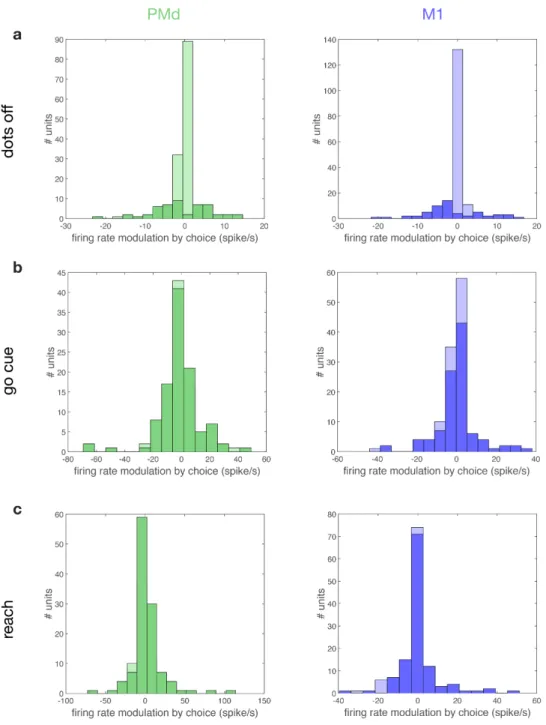
For each cell, choice modulation was calculated as the average difference in spike counts between correct right choices and correct left choices in a 50 msec window. These spike counts were calculated at 3 different timepoints in the trial (end of dots presentation, go cue and reach initiation) and then converted into firing rates. To assess the statistical significance of the difference between the two choices we imple-mented a Wilcoxon rank sum test that tests the hypothesis that median firing rates for the two choices are identical and rejects it at p<0.001.
2.2
Results
2.2.1
Behavioral results
We employed a classical direction discrimination task (Britten et al., 1992), in which
monkeys are asked to report the net direction of motion in a random dot
kine-matogram presented on a LCD touchscreen Figure 2.1). In contrast to most studies
that have used this paradigm (Britten et al., 1992, 1996; Shadlen and Newsome,
2001), the operant response was an arm reach to one of two targets corresponding to
the perceived direction of motion instead of a saccadic eye movement. In the fixed duration task the stimulus was always presented for 1000 ms followed by random de-lay period (400-900 ms) after which the monkey was cued to report a decision. After extensive training on this task and as expected from previous studies using a similar paradigm, monkeys displayed excellent behavioral performance in this task, achieving
close to 100% accuracy for high coherence stimulus (Figure 2.4). The monkeys’
per-formance decreased smoothly with stimulus difficulty (lower coherence) and remained above chance for the lowest (non-zero) coherence stimulus (3.2%). For 0% trials the performance was at chance levels as expected. Psychophysical thresholds were 11.1% and 12.8% stimulus coherence for Monkey H and F, respectively (see Methods).
Figure 2.4: Behavioral performance - Fixed duration task. a) Psychophysical performance for Monkey H in the variable duration task. Percentage correct is plotted as a function of net motion coherence (calculated for both directions). Data points are fit with a Weibull curve. b) Same as a) for Monkey F.
Figure 2.5: Behavioral performance - Variable duration task (no delay).
a) Psychophysical performance for Monkey H in the variable duration task with no
delay. Percentage correct is plotted as a function of net motion coherence (calculated for both directions). Data points for long (red) and short (orange) stimuli are fit separately by a Weibull curve. b) Same as a) for Monkey F.
After data collection was concluded in the fixed duration task, monkeys per-formed a variable duration task, which required a modest amount of retraining to obtain excellent behavior. For this new version of the task, the stimulus duration was randomly selected on each trial (200-1000 ms, median 435 ms), and for the vast majority of sessions (no delay variant) the delay period eliminated, requiring subjects to report their decision immediately after stimulus offset. While the best strategy for the motion discrimination task is always to integrate as many stimulus samples
as possible, due to the noisy nature of the stimulus, the results shown so far have not confirmed the monkeys were indeed doing that. One of the advantages of using a variable duration stimulus is the ability to compare performance for different ranges of stimulus duration. The behavioral results for the variable duration show that both subjects performed better for longer stimuli suggesting additional visual evidence
was integrated to improve decisions (Figure 2.5). This effect tapered off with
perfor-mance saturating between the 3rd and 4th quartile of stimulus duration (not shown) suggesting that both monkeys used additional evidence provided by longer stimulus durations, but only up to a certain point. This is also compatible with results found
in previous studies (Kiani and Shadlen, 2009). The main advantage of the variable
duration task is the ability to query the subject as soon as the stimulus is terminated. However, this advantage comes at the cost of not having the convenient temporal sep-aration between evidence integration (dots period), action planning (hold period) and action execution (post-go period) afforded by the fixed duration task. For this reason, and only for monkey H, we ran a hybrid version that had the same duration for dots stimulus as the variable duration task (200-1000 ms) and the same delay period of the fixed duration task (400-900). We called this version ”variable duration with delay” and will use it as a control for the other 2 tasks in Chapter 3.
Besides describing discrimination performance as function of stimulus strength in the dots task we also quantified the relationship between reaction time (RT) and
stimulus strength (Figure 2.6 and Figure 2.7). Since none of the task versions used
in our study are self-paced but are instead under the control of the experimenter (the subject always has to wait for the go cue), the reaction times quantified are not classical reaction times but instead ”post go cue” reaction times. Nevertheless, this metric allows us to compare the readiness of the subject to report its decision as a function of stimulus difficulty and also across task versions. While RTs vary from subject to subject, in both cases (and both tasks) the median values are only slightly
longer than the average for much simpler instructed reach tasks (Churchland and
Shenoy, 2007b). This observation suggests that, on most trials, the monkeys are well prepared to report their decision once the go cue is presented. Interestingly there is
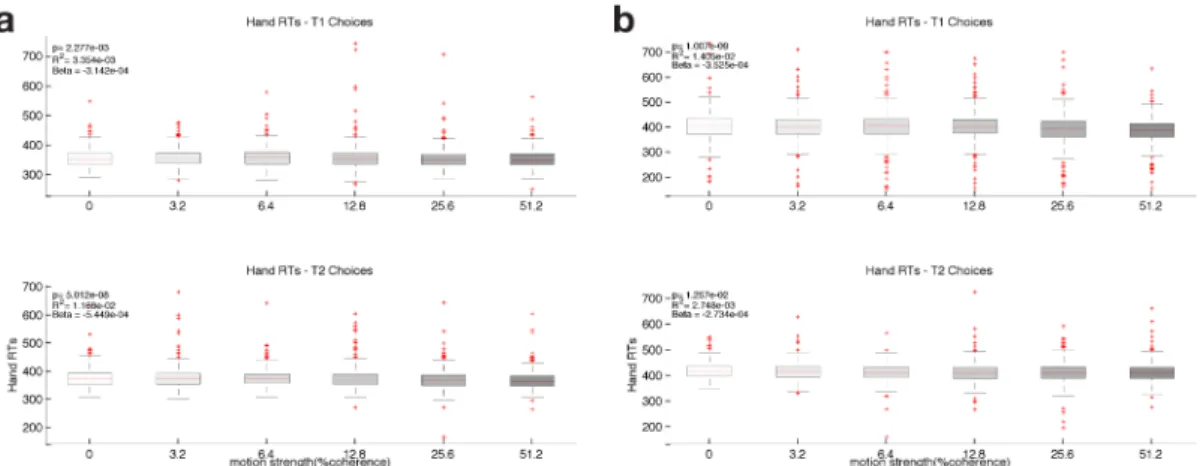
Figure 2.6: Hand RT as a function of coherence - Fixed Duration. a) Hand Reaction Times for left choices (top) and right choices (bottom) as a function of stimulus coherence for Monkey H. Box shows median RT (red) and 25th and 75th percentile and whiskers show most extreme data points not considered outliers. Red crosses show outliers. Inset denotes the results of a linear regression of RT on coher-ence. b) Same as a) for Monkey F.
Figure 2.7: Hand RT as a function of coherence - Variable Duration. a) Hand Reaction Times for left choices (top) and right choices (bottom) as a function of stimulus coherence for Monkey H. Box shows median RT (red) and 25th and 75th percentile and whiskers show most extreme data points not considered outliers. Red crosses show outliers. Inset denotes the results of a linear regression of RT on coherence. b) Same as a) for Monkey F.
a small but highly significant effect of coherence on RT: easier trials are associated with slightly shorter RTs when compared to harder trials. This effect is present for all monkeys, task versions and directions of reach and, even though its magnitude is only ∼20-30 ms, it could be a signature of higher confidence in the decision for easier trials. Because these RTs don’t correspond to the time of commitment to a choice