Cyclic response of RC beam-column joints reinforced
with plain bars: An experimental testing campaign
J. Melo & H. Varum
Dept. of Civil Engineering, University of Aveiro, Portugal
T. Rossetto
Dept. of Civil, Environmental & Geomatic Eng., University College of London, UK
A. Costa
Dept. of Civil Engineering, University of Aveiro, Portugal
SUMMARY:
Existing reinforced concrete (RC) buildings constructed until the mid-70’s, with plain reinforcing bars, are expected to behave poorly when subjected to earthquake actions. This paper describes an experimental program designed to investigate the influence of poor detailing on the cyclic behaviour of RC beam-column joint elements.
Cyclic tests were performed on five interior and five exterior full-scale beam-column joints with different detailing characteristics and reinforced with plain bars. An additional joint of each type was built with deformed bars for an evaluation of the influence of bond properties on the cyclic response of the structural element. The force-displacement global response, energy dissipation, equivalent damping and damage behaviour of the joints was investigated and the main results are presented and discussed. The experimental results indicate that the bond-slip mechanism has significantly influenced the cyclic response of the beam-column joints. The specimens built with plain bars showed lower energy dissipation, stiffness and equivalent damping.
Keywords: Plain reinforcing bars; RC beam-column joints; Cyclic behaviour
1. INTRODUCTION
A significant number of existing reinforcing concrete (RC) structures in seismic Mediterranean regions were designed and built before the 1970s, using plain reinforcing bars, prior to the enforcement of the modern seismic-oriented design codes. As a consequence of absence of any capacity design principles in design and poor detailing, a significant lack of ductility, at both the local and global levels, is expected for these structures, resulting in inadequate structural performance even under moderate seismic excitations (Pampanin et al. 2002). The hysteretic behaviour of RC structures built with plain reinforcing bars is particularly sensitive to bond properties. Cyclic load reversals, like the ones induced by earthquakes, produce progressive concrete-steel bond degradation that leads to significant bar slippage. This process can lead to failure at a cyclic stress level lower than the ultimate stress under monotonic loading (CEB 1996). The poor bond capacity has a strong contribution on fixed-end rotations and normally increases its contribution to the element deformation. The bond-slip mechanism may represent up to 80%~90% of the element overall deformability on elements built with plain bars (Melo et al. 2011; Verderame et al. 2008a, 2008b, 2010).
The number of experimental tests developed on RC elements built with plain bars is reduced when compared with the available data for elements with deformed bars (for example, Rodrigues et al. 2012). More tests are needed to characterize with precision the cyclic behaviour of RC elements built with plain bars. Moreover, the existing literature on bond mechanisms of RC elements with plain reinforcing bars is much less rich and detailed than the one available for deformed bars, especially regarding the aspects of cyclic and post-elastic nature (Verderame et al. 2009). Recent reports on experimental tests conducted on beams and beam-column joints with plain reinforcing bars can be found in Fernandes et al. (2011a,b,c), Bedirhanoglu et al. (2010) and Pampanin et al. (2002).
In this paper are presented the results of the cyclic tests carried out on twelve full-scale beam-column joints, representative of typical beam-column joints in existing RC building structures built with plain reinforcing bars and without adequate reinforcement detailing for seismic loading. Six specimens represent interior beam-column joints and the other corresponds to exterior beam-column joints. Two monotonic tests were performed on the exterior beam-column joints to establish the comparison between the cyclic and corresponding monotonic tests. One specimen of each beam-column type was built with deformed bars, to establish the performance comparison with the specimens built with plain bars. The influence of bond properties, lap-splice, beam anchorage reinforcing bars details, load type, slab participation, and bent-up bars in the beam, are investigated.
2. SPECIMENS DETAILS, MATERIAL PROPERTIES AND TEST SETUP 2.1. Details of Beam-Column Joints Specimens
Interior and exterior beam-column joints were made to characterize the cyclic behaviour of old RC elements. The experimental campaign consisted in the unidirectional cyclic test of several full-scale specimens that represented interior and exterior beam-column joints with different reinforcing details and geometry. Monotonic tests were made on the exterior beam-column joints to compare the results with the results obtained in similar specimens under cyclic loading. The beam-column joints simulated the first floor connection between beams of 4m span and columns with 3m height, of a four storeys building structure. The specimen nomenclature adopted is: i) the first letter, I or T, refers to the interior or exterior beam-column joints, respectability; ii) the second letter (P or D) refers to the reinforcing steel type, plain (P) or deformed (D); iii) the third letter refers to the type of reinforcing details, and the cross-section type.
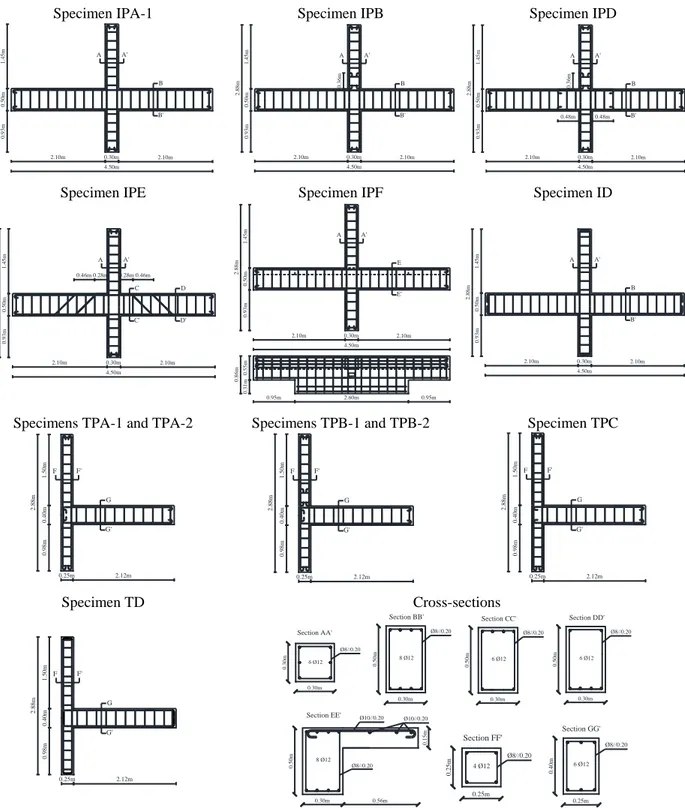
The geometrical characteristics and reinforcing detailing of the specimens are presented in Figure 1. All the interior beam-column joints had the same column cross-section with dimensions 0.30x0.30m2 and the same beam cross-section with dimensions 0.30x0.50m2. Specimen IPF had also a slab in one side with 0.15m thickness. All the exterior beam-column joints had the same column and beam cross-sections with dimensions 0.25x0.25m2 and 0.25x0.40m2, respectively. The anchorage detailing of reinforcing plain bars were designed according to the first Portuguese codes RBA (1935) and REBA (1967) for reinforced concrete structures. The bar anchorage consist of end hooks. The lap-splice length adopted in specimens IPB, TPB-1 and TPB-2 were also defined according to the above mentioned Portuguese codes.
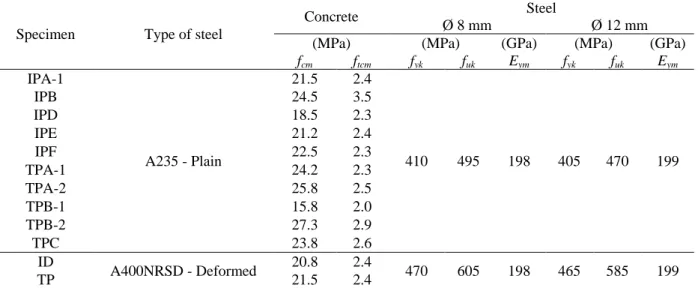
Table 1. Mean values of the material mechanical properties
Specimen Type of steel
Concrete Steel
Ø 8 mm Ø 12 mm
(MPa) (MPa) (GPa) (MPa) (GPa)
fcm ftcm fyk fuk Eym fyk fuk Eym IPA-1 A235 - Plain 21.5 2.4 410 495 198 405 470 199 IPB 24.5 3.5 IPD 18.5 2.3 IPE 21.2 2.4 IPF 22.5 2.3 TPA-1 24.2 2.3 TPA-2 25.8 2.5 TPB-1 15.8 2.0 TPB-2 27.3 2.9 TPC 23.8 2.6 ID A400NRSD - Deformed 20.8 2.4 470 605 198 465 585 199 TP 21.5 2.4
Specimens IPA-1, TPA-1 and TPA-2 are the standard beam-columns joints with continuous longitudinal bars. Specimens IPB, TPB-1 and TPB-2 were similar to the standard specimens but
included lap splicing in the upper column. Specimen IPD had lap-splice in the beams and columns. Specimen IPE had less longitudinal bars in the beam than the other specimens and it had bent-up bars in the beam. Specimen IPF had a 0.15m thick slab in one side (0.56m width). Specimens ID and TD had the same reinforcing details than the corresponding standard specimens but were built with deformed bars. In specimen TPC the anchorage of the beam longitudinal bars in the joint consists of end hooks instead 90º bents, as in specimens TPA and TPB.
Specimen IPA-1 Specimen IPB Specimen IPD
2.88m 1.45m 0.50m 0.93m 2.10m 0.30m 2.10m 4.50m A A' B B' 0.36m 2.88m 1.45m 0.50m 0.93m 2.10m 0.30m 2.10m 4.50m A A' B B' 0.36m 0.48m 0.48m 2.88m 1.45m 0.50m 0.93m 2.10m 0.30m 2.10m 4.50m A A' B B'
Specimen IPE Specimen IPF Specimen ID
0.28m 0.46m 0.28m 0.46m 2.88m 1.45m 0.50m 0.93m 2.10m 0.30m 2.10m 4.50m A A' D D' C C' 0.86m 0.55m 0.31m 0.95m 2.60m 0.95m 2.88m 1.45m 0.50m 0.93m 2.10m 0.30m 2.10m 4.50m A A' E E' 2.88m 1.45m 0.50m 0.93m 2.10m 0.30m 2.10m 4.50m A A' B B'
Specimens TPA-1 and TPA-2 Specimens TPB-1 and TPB-2 Specimen TPC
2.88m 0.25m 2.12m 1.50m 0.40m 0.98m F F' G G' 0.25m 2.12m 2.88m 1.50m 0.40m 0.98m F F' G G' 0.25m 2.12m 2.88m 1.50m 0.40m 0.98m F F' G G' Specimen TD Cross-sections 0.25m 2.12m 2.88m 1.50m 0.40m 0.98m F F' G G' 0.30m 6 Ø12 0.30m Section AA' Ø8//0.20 0.50m 8 Ø12 Section BB' 0.30m Ø8//0.20 0.50m 6 Ø12 0.30m Section CC' Ø8//0.20 0.50m 6 Ø12 0.30m Section DD' Ø8//0.20 0.50m 8 Ø12 0.30m Ø8//0.20 0.56m 0.15m Ø10//0.20 Ø10//0.20 Section EE' 0.2 5m 4 Ø12 0.25m Section FF' Ø8//0.20 0.4 0m 6 Ø12 Section GG' 0.25m Ø8//0.20
Figure 1. Geometry, dimensions and reinforcement detailing of specimens
Table 1 summarize the mean values of the material properties. Compressive tests of concrete cylinder samples (Ø150mmx300mm) and steel tensile strength tests were made for determining the materials properties used in each specimen. All concrete specimens were tested after 90 days of curing.
2.2. Test Setup and Loading History
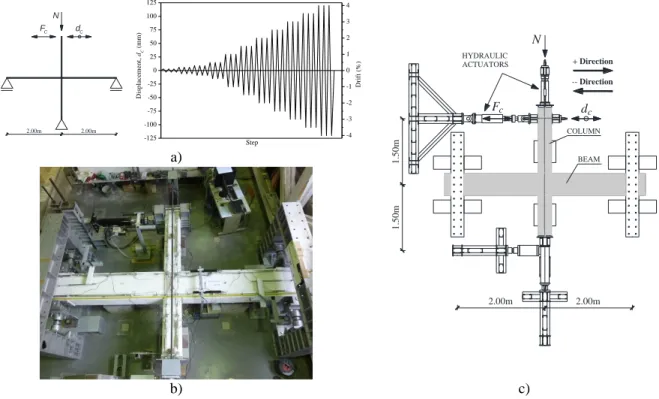
The test setup adopted, the supports, the loading conditions idealized and the lateral displacements history imposed at the top of the upper column adopted for the interior beam-column tests are illustrated in Figure 2. The specimens were tested in the horizontal position and four high load carrying capacity and reduced friction devices were placed below the specimen to carry the elements’ self-weight. The tests were performed under displacement controlled conditions. The lateral displacements (dc) and the axial force (N) were imposed by two hydraulic actuators at the top of the
upper column. The cyclic lateral displacement history adopted consisted in: three cycles applied for each of the following peak drift values (± %): 0.1, 0.2, 0.3 and than 0.5 to 4.0 with 0.5 increments (Figure 2-a). In specimens TPA-1 and TPB-1, an increasing displacement demand was applied monotonically in the negative direction up to 5% drift. The axial force was constant and equal to 450kN and 200kN in the interior and exterior beam-column joints, respectively. The test setup and loading history used on the exterior beam-column joint tests were the same that were used on the interior beam-column joint tests.
2.00m 2.00m 1.50m 1.50m N FC dC -125 -100 -75 -50 -25 0 25 50 75 100 125 D is p la c e m e n t, dC ( m m ) Step -4 -3 -2 -1 0 1 2 3 4 D ri ft ( % ) N 2.00m 2.00m 1.50m 1.50m COLUMN Fc BEAM HYDRAULIC ACTUATORS dc + Direction -- Direction a) b) c)
Figure 2. Interior beam-column joint test setup: a) support and loading conditions idealized, and lateral displacement history imposed; b) general view; c) test setup schematics
3. EXPERIMENTAL RESULTS
In this section, the main results from the experimental campaign are presented. The envelopes of the force-displacement diagrams and the evolution of the hysteretic dissipated energy with the drift are presented. Moreover, the equivalent damping-displacement ductility relationships are provided. Several comparisons are established between the cyclic test results, in terms of force-displacement relationships to show the influence of the bond properties (plain or deformed bars), detailing of reinforcing steel (lap-splice, bent-up bars and anchorage details) and slab on the cyclic behaviour. Finally, the damage pattern is represented and discussed. The hysteretic dissipated energy was computed for all cyclic tests performed as the sum of the area under the force-displacement diagrams. In the hysteretic dissipated energy diagrams the large mark corresponds to the ultimate point. The equivalent damping (ξeq) was computed according to Varum (2003) and Priestley et al. (2007). The
displacement ductility (µΔ) corresponds to the ratio between the imposed displacement (dc) and the
yielding displacement (Δy). The yielding force and yield displacement were computed according to Annex B.3 of Eurocode 8 (considering an idealized elasto-perfectly plastic force-displacement relationship). The ultimate strength was determined for a point corresponding to a strength reduction of 20% relatively to the maximum strength, as adopted by Park and Ang (1987).
3.1. Experimental Results from the Tests on Interior Beam-Column Joints 3.1.1. Global results
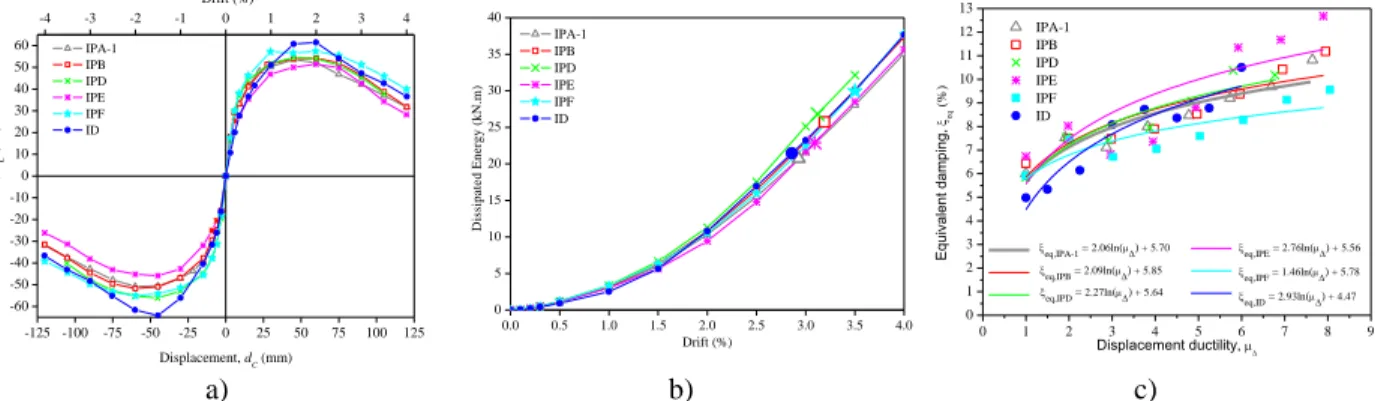
The force-displacement envelopes, evolutions of the dissipated energy and the equivalent damping-displacement ductility diagrams obtained from the experimental results are shown in Figure 3. In Table 2 the values of maximum lateral force (Fc,max) and the corresponding drift (DriftFc,max), the
ultimate force (Fc,ult) and corresponding drift (DriftFc,ult), and also the yielding force and yielding
displacement, are presented.
-125 -100 -75 -50 -25 0 25 50 75 100 125 -60 -50 -40 -30 -20 -10 0 10 20 30 40 50 60 IPA-1 IPB IPD IPE IPF ID F o rc e , FC ( k N ) Displacement, d C (mm) -4 -3 -2 -1 0 1 2 3 4 Drift (%) 0.0 0.5 1.0 1.5 2.0 2.5 3.0 3.5 4.0 0 5 10 15 20 25 30 35 40 D is si p a te d E n e rg y ( k N .m ) Drift (%) IPA-1 IPB IPD IPE IPF ID 0 1 2 3 4 5 6 7 8 9 0 1 2 3 4 5 6 7 8 9 10 11 12 13 eq,IPE = 2.76ln() + 5.56 eq,ID = 2.93ln() + 4.47 eq,IPD = 2.27ln() + 5.64 eq,IPB = 2.09ln() + 5.85 eq,IPA-1 = 2.06ln() + 5.70 Eq ui va le nt d amp in g, eq ( % ) Displacement ductility, IPA-1 IPB IPD IPE IPF ID eq,IPF = 1.46ln() + 5.78 a) b) c)
Figure 3. Global results of interior beam-column joints: a) force-displacement envelopes; b) hysteretic dissipated energy evolution; c) equivalent damping-displacement ductility diagram
Table 2. Maximum and ultimate force, drift values and yielding displacement of interior beam-column joints
Specimen Max. force, Fc,max
(kN)
DriftFc,max
(%)
Ult. force, Fc,ult
(kN) DriftFc,ult (%) Yielding force (kN) Δy (mm) IPA-1 53.6 1.5 42.8 2.93 48.7 15.7 IPB 54.2 2.0 43.4 3.19 49.5 15.1 IPD 54.6 1.5 43.6 3.12 52.4 15.5 IPE 51.4 2.0 41.1 3.09 44.8 15.2 IPF 57.4 2.0 45.9 3.50 53.3 14.9 ID 61.5 1.5 49.2 2.86 56.6 20.0
The initial stiffness is similar in all specimens and the maximum force had a variation between 51.4kN and 61.5kN for all specimens, and it was achieved for a drift equals to 2.0%, except in specimens IPA-1, IPD and ID that was 1.5%. The ultimate force was achieved for a drift value between 2.86% and 3.5% in all specimens. The yielding displacement values for the specimens with plain bars were similar (between 14.9mm and 15.7mm). However, the yielding displacement in specimen ID was 20.0mm. Specimen ID display a peak force 15% larger, a larger strength degradation, 4% larger dissipated energy, lower displacement ductility and larger increase in equivalent damping with displacement ductility than specimen IPA-1. Specimen IPB shows similar maximum strength, strength degradation and equivalent damping-displacement relationship, and 25% larger dissipated energy (until the ultimate point) than specimen IPA-1 (standard specimen). Specimen IPD showed a cyclic response similar to specimen IPA-1, but it dissipates until the ultimate point 30% more energy than specimen IPA-1. Specimen IPE shows lower peak force and lower stiffness after cracking than specimen IPA-1, because had less amount of steel in the beams. Finally, specimen IPF displays larger stiffness after cracking, greater peak force, 45% larger dissipated energy and lower equivalent damping than specimen IPA-1.
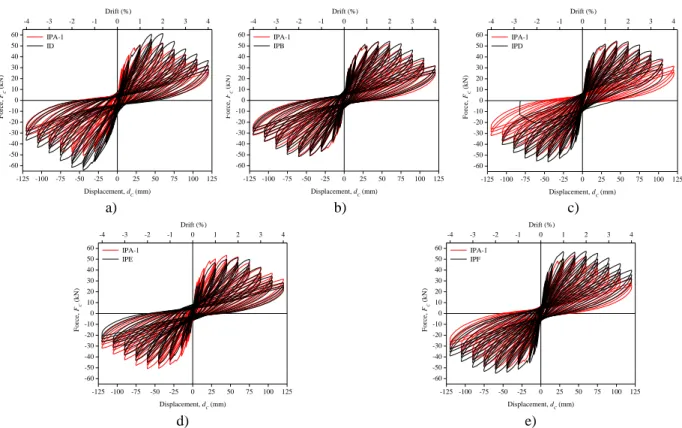
-125 -100 -75 -50 -25 0 25 50 75 100 125 -60 -50 -40 -30 -20 -10 0 10 20 30 40 50 60 F o rc e , FC ( k N ) Displacement, d C (mm) IPA-1 ID -4 -3 -2 -1 0 1 2 3 4 Drift (%) -125 -100 -75 -50 -25 0 25 50 75 100 125 -60 -50 -40 -30 -20 -10 0 10 20 30 40 50 60 F o rc e , FC ( k N ) Displacement, d C (mm) IPA-1 IPB -4 -3 -2 -1 0 1 2 3 4 Drift (%) -125 -100 -75 -50 -25 0 25 50 75 100 125 -60 -50 -40 -30 -20 -10 0 10 20 30 40 50 60 F o rc e , FC ( k N ) Displacement, d C (mm) IPA-1 IPD -4 -3 -2 -1 0 1 2 3 4 Drift (%) a) b) c) -125 -100 -75 -50 -25 0 25 50 75 100 125 -60 -50 -40 -30 -20 -10 0 10 20 30 40 50 60 F o rc e , FC ( k N ) Displacement, dC (mm) IPA-1 IPE -4 -3 -2 -1 0 1 2 3 4 Drift (%) -125 -100 -75 -50 -25 0 25 50 75 100 125 -60 -50 -40 -30 -20 -10 0 10 20 30 40 50 60 F o rc e , FC ( k N ) Displacement, dC (mm) IPA-1 IPF -4 -3 -2 -1 0 1 2 3 4 Drift (%) d) e)
Figure 4. Force-displacement diagrams comparison of interior beam-column joints
As far as the cyclic behaviour is concerned (see Figure 4), all specimens displayed similar response in terms of pinching and the unloading and reloading stiffness is also identical. The inferior column of specimen IPD failed at 3.5% of drift, and therefore the 4.0% of drift was not imposed as for the other specimens.
3.1.1. Damage observed
Figure 5 displays the damage state observed at the end of the tests in the interior beam-column joints. The core joint of all specimens failed at the end of the tests, except in specimen IPD. Due to the beam lap-splice in specimen IPD (larger amount of beam reinforcing steel in the core joint), it failed at the inferior column and not in the core joint.
IPA-1 IPB IPD
IPE IPF ID
In specimen IPE the damage was more concentrated in the core joint than in specimen IPA-1. Specimen IPF displayed more cracks in the top face than in the inferior face of the beam due to the slab that increased the stiffness in that zone and the damages are more distributed. In specimen ID, the damage was more distributed along the elements’ spans than for the specimens with plain bars.
3.2. Experimental Results from the Tests on the Exterior Beam-Column Joints 3.2.1. Global results
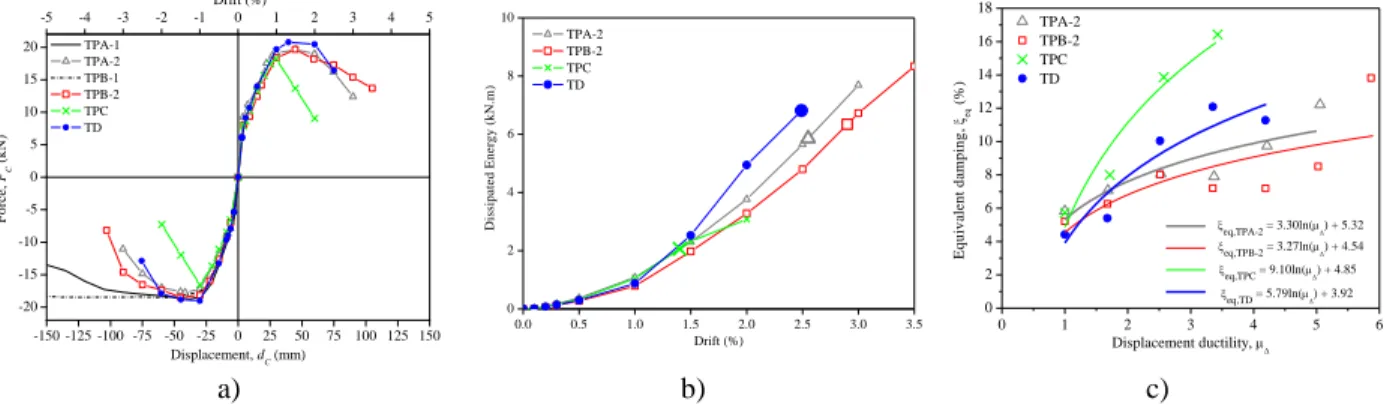
In Figure 6 is shown the force-displacement envelopes, hysteretic dissipated energy evolutions and equivalent damping-displacement ductility relationship. Table 3 shows the peak force and corresponding drift value, the ultimate force and corresponding drift value, and also the yielding force and yielding displacement. All specimens had similar stiffness until the peak force. However, after the peak force the strength degradation took different shapes. Specimen TPB-2 displayed lower strength degradation, 8% greater dissipated energy (until ultimate point), and lower equivalent damping than specimen TPA-2. Specimen TPC shown larger strength degradation, lower dissipated energy (64% until ultimate point), lower displacement ductility and larger damping than specimen TPA-2. Specimen TD presented a peak force 6% larger, a larger strength degradation, 16% larger dissipated energy and also greater increase in equivalent damping with displacement ductility than specimen TPA-2. Specimens TPA-1 and TPB-1, tested monotonically, had similar stiffness that specimens tested cyclically until the peak force. After peak force, Specimen TPA-1 had strength degradation and achieved the ultimate point for a drift value equals to 4.31%. Specimen TPB-1 didn’t have strength degradation until 5% of drift. The monotonic tests were made in the negative direction, because is the direction which develops compression stresses on the unconfined concrete in the core joint (weak direction). These compression stresses controlled the fail mechanism. Therefore, the specimens achieve firstly the ultimate point in negative direction.
-150 -125 -100 -75 -50 -25 0 25 50 75 100 125 150 -20 -15 -10 -5 0 5 10 15 20 TPA-1 TPA-2 TPB-1 TPB-2 TPC TD F o rc e , FC ( k N ) Displacement, dC (mm) -5 -4 -3 -2 -1 0 1 2 3 4 5 Drift (%) 0.0 0.5 1.0 1.5 2.0 2.5 3.0 3.5 0 2 4 6 8 10 D is si p a te d E n e rg y ( k N .m ) Drift (%) TPA-2 TPB-2 TPC TD 0 1 2 3 4 5 6 0 2 4 6 8 10 12 14 16 18 eq,TPC = 9.10ln() + 4.85 eq,TPB-2 = 3.27ln() + 4.54 eq,TPA-2 = 3.30ln() + 5.32 E q u iv a le n t d a m p in g , eq ( % ) Displacement ductility, TPA-2 TPB-2 TPC TD eq,TD = 5.79ln() + 3.92 a) b) c)
Figure 6. Global results of exterior beam-column joints: a) force-displacement envelopes; b) hysteretic dissipated energy evolution; c) equivalent damping-displacement ductility diagram
Table 3. Maximum and ultimate force, drift values and yielding displacement of exterior beam-column joints
Specimen Max. force, Fc,max
(kN)
DriftFc,max
(%)
Ult. force, Fc,ult
(kN) DriftFc,ult (%) Yielding force (kN) Δy (mm) TPA-1 18.8 1.3 15.0 4.31 17.7 17.3 TPA-2 19.6 1.5 15.7 2.55 17.6 17.8 TPB-1 18.5 1.7 - - 18.3 19.7 TPB-2 19.7 1.5 15.7 2.90 17.4 17.9 TPC 18.2 1.0 14.6 1.40 16.0 17.5 TD 20.8 1.3 16.6 2.49 18.7 17.9
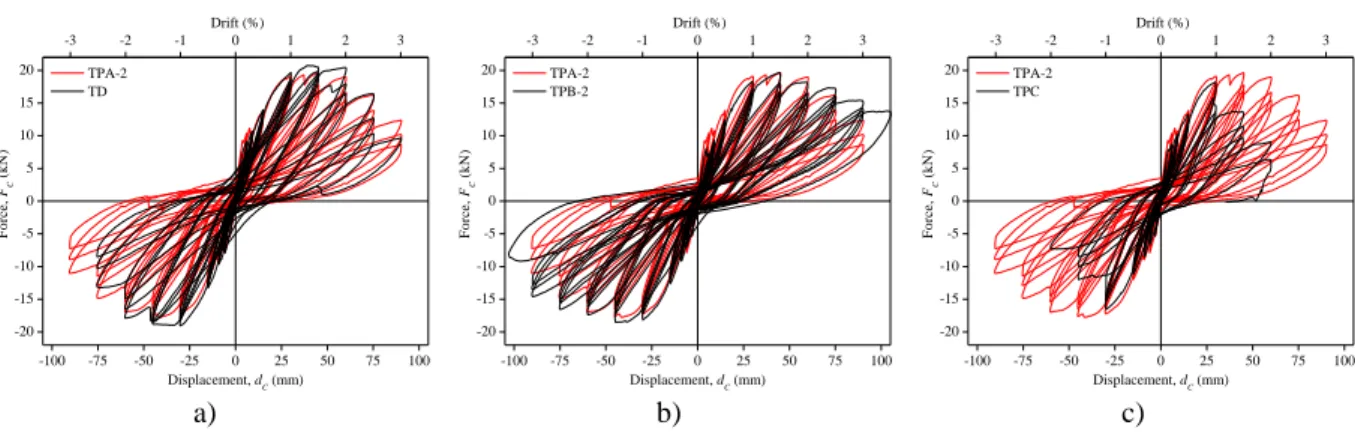
Figure 7 shows the force-displacement diagrams comparison. The pinching effect is similar in specimens TPA-2, TPB-2 and TD. In specimen CPC the pinching effect is more marked than in specimen CPA-2. Specimen CPC achieved the ultimate point for a lower drift value comparing to the other tests, due to the poor confinement of the concrete in the core joint. The large strength
degradation of specimen TPC is evident in Figure 7c comparing to specimen TPA-2. -100 -75 -50 -25 0 25 50 75 100 -20 -15 -10 -5 0 5 10 15 20 TPA-2 TD F o rc e , FC ( k N ) Displacement, dC (mm) -3 -2 -1 0 1 2 3 Drift (%) -100 -75 -50 -25 0 25 50 75 100 -20 -15 -10 -5 0 5 10 15 20 TPA-2 TPB-2 F o rc e , FC ( k N ) Displacement, dC (mm) -3 -2 -1 0 1 2 3 Drift (%) -100 -75 -50 -25 0 25 50 75 100 -20 -15 -10 -5 0 5 10 15 20 TPA-2 TPC F o rc e , FC ( k N ) Displacement, dC (mm) -3 -2 -1 0 1 2 3 Drift (%) a) b) c)
Figure 7. Force-displacement diagrams comparison of exterior beam-column joints 3.2.1. Damage observed
Figure 8 shows the damage state at the end of the tests. Specimens with lap-splice didn’t display shear cracks in the core of the joint because the damage was more concentrate at the column-core joint interface. However specimens without lap-splice had large damage in the core of the joint and in specimen TPC the shear cracks in the core of the joint was evident. Specimens TPA and TPB showed concrete spalling on the exterior face of the joint but in specimen TPC was not limited to the cover but included part of the core of the joint due to the weak concrete confinement in the joint. In the specimens built with plain bars the damage in the beams was concentrated mainly in two cracks but specimen built with deformed bars (TD) showed large number of cracks along the beam. In all specimens the fail mode was the same, concrete spalling in the core of the joint followed by buckling of the longitudinal reinforcing bars of the column in joint region.
TPA-1 TPA-2 TPB-1
TPB-2 TPC TD
Figure 8. Damage state at the end of the tests for the exterior beam-column joints
4. FINAL COMMENTS
Experimental tests were performed to assess the cyclic and monotonic behaviour of full-scale beam-column joints with plain bars and poor reinforcement detailing. The influence of bond properties, lap-splice, and reinforcement detailing on the cyclic behaviour of the elements was investigated. Tests
results were analyzed in terms of initial stiffness, maximum strength, strength degradation, hysteretic dissipated energy, equivalent damping function of displacement ductility and damage state at the end of the tests. From the comparisons established between the tests results, the following main conclusions can be drawn:
Interior beam-column joints showed larger (approximately 50% more) displacement ductility than exterior beam-column joints. Exterior beam-column joints displayed larger equivalent damping than the interior beam-column joints;
In the exterior beam-column joints the differences on the cyclic behaviour due to the bond properties (plain or deformed bars) were more evident than in interior beam-column joints;
Specimens with lap-splice displayed larger dissipated energy than specimens with continuous longitudinal bars;
The force-drift relationship of the monotonic tests was similar to the envelopes of the cyclic tests until the maximum strength.
The differences observed between the cyclic response of the specimens built with plain bars and with deformed bars, make clear the influence of the bond properties in the cyclic response of RC beam-column joints.
The experimental data obtained from the work performed will allow to upgrade and to calibrate numerical models for the adequate simulation of the cyclic behaviour of existing RC structures built with plain reinforcing bars.
AKCNOWLEDGEMENT
The authors acknowledge the staff of the Civil Engineering Laboratory at the University of Aveiro, and to Eng. Renato Garcia and Eng. Diogo Mariano, for the support in the preparation and implementation of the testing setup and campaign. This paper reports research developed under financial support provided by “FCT - Fundação para a Ciência e Tecnologia”, Portugal, namely through the PhD grant of the first author, with reference SFRH/BD/62110/2009.
REFERENCES
Bedirhanoglu, I., Ilki, A., Pujol, S. and Kumbasar, N. (2010). Behavior of Deficient Joints with Plain Bars and Low-Strength Concrete, ACI Structural Journal, 107:03,300-310.
CEB (1996). RC Elements under Cyclic Loading. State of-the-art report, Thomas Telford Ltd., London, UK. CEN (2004). Eurocode 8: Design of structures for earthquake resistance - Part 1: General rules, seismic actions
and rules for buildings. European Committee for Standardization, Brussels, Belgium.
Fernandes, C., Melo, J., Varum, H. and Costa, A. (2011a). Cyclic behavior of a two-span RC beam built with plain reinforcing bars, Periodica Polytechnica Civil Engineering 55:1, 21-29.
Fernandes, C., Melo, J., Varum, H. and Costa, A. (2011b). Cyclic behaviour of substandard RC beam-column joints with plain bars, ACI Structural Journal, (accepted for publication).
Fernandes, C., Melo, J., Varum, H. and Costa, A. (2011c). Comparative analysis of the cyclic behavior of beam-column joints with plain and deformed reinforcing bars, IBRACON Structures and Materials Journal 4:1,147-172.
Governo, D. (1935). Regulamento do Betão Armado (RBA), Decreto n.º 25948, 16 de Outubro, serie I, num. 240, Lisbon.
Governo, D. (1967). Regulamento de Estruturas de Betão Armado (REBA), Decreto n.º 47723, 20 May, serie I, num. 119, Lisbon.
Rodrigues, H., Varum, H., Arêde, A. and Costa, A. (2012). A comparative analysis of energy dissipation and equivalent viscous damping of RC columns subjected to uniaxial and biaxial loading. Engineering
Structures, Elsevier 35,149-164.
Melo, J., Fernandes, C., Varum, H., Rodrigues, H., Costa, A. and Arêde, A. (2011). Numerical modelling of the cyclic behaviour of RC elements built with plain reinforcing bars. Engineering Structures, Elsevier 33:2,273-286.
Pampanin, S., Calvi G.M. and Moratti, M. (2002). Seismic behaviour of RC beam-column joints designed for gravity loads. Twelfth European Conference on Earthquake Engineering: Paper 726.
Park ,Y. J., Ang, A. H. S., and Wen, Y. K., (1987). Damage-limiting aseismic design of buildings, Earthquake
Spectra 3:1,1-26.
Priestley, M., Calvi, G. and Kowalsky, M. (2007). Displacement-Based Seismic Design of Structures, IUSS PRESS, Italy.
Varum, H. (2003). Seismic assessment, strengthening and repair of existing buildings, PhD Thesis, University of Aveiro, Portugal.
Verderame, G.M., Fabbrocino, G. and Manfredi, G. (2008a). Seismic Response of R.C. Columns with Smooth Reinforcement. Part II: Cyclic Tests, Engineering Structures 30:9, 2289-2300.
Verderame, G.M., Fabbrocino, G. and Manfredi, G. (2008b). Seismic Response of R.C. Columns with Smooth Reinforcement. Part I: Monotonic Tests, Engineering Structures 30:9,2277-2288.
Verderame, G.M., Ricci, P., Carlo, G.D. and Manfredi G. (2009). Cyclic Bond Behavior of Plain Bars. Part I: Experimental Investigation, Construction and Building Materials 23:12,3499-3511.
Verderame, G.M., Ricci, P., Manfredi, G. and Cosenza E. (2010). Ultimate Chord Rotation of RC Columns with Smooth Bars: Some Considerations about EC8 Prescriptions, Bulletin of Earthquake Engineering,