UNIVERSIDADE DOS AÇORES
DEPARTAMENTO DE BIOLOGIA
POPULATION GENETICS STUDY OF THE GENUS
LEONTODON IN THE AZORES
ELISABETE FURTADO DIAS
MESTRADO EM BIODIVERSIDADE E BIOTECNOLOGIA
VEGETAL
ORIENTADORES:
MÓNICA MOURA
JULIE SARDOS
PONTA DELGADA 2012UNIVERSIDADE DOS AÇORES
DEPARTAMENTO DE BIOLOGIA
POPULATION GENETICS STUDY OF THE GENUS
LEONTODON IN THE AZORES
MASTER DISSERTATION INCLUDED IN DEMIURGO PROJECT
FINANCED BY FEDER, OF THE INICIATIVE MAC/1/C020-
PROGRAMA DE COOPERAÇÃO TRANSNACIONAL
AÇORES-MADEIRA-CANÁRIAS (MAC) 2007-2013
PONTA DELGADA 2012
Index
ABSTRACT RESUMO
ACKNOWLEDGMENTS
INTRODUCTION ... 1
MATERIAL AND METHODS ... 4
PLANT MATERIAL... 4
MICROSATELLITES DEVELOPMENT ... 7
DNAEXTRACTION ... 8
MICROSATELLITES SELECTION ... 8
FULL SCALE GENOTYPING ... 10
DATA ANALYSIS ... 10
RESULTS ... 11
DISCUSSION ... 22
Abstract
The genus Leontodon L. (Asteraceae) comprises around 50 species and its natural distribution area covers Europe, North America, northern Africa, and western Asia (Bogler, 2006). Two of these species are endemic to the archipelago of the Azores:
Leontodon filii (Hochst. ex Seub.) Paiva & Ormonde and Leontodon rigens (Dryand.)
Paiva & Ormond (Silva et al., 2011).
This present work proposes to undertake a comprehensive and complete study of population variability of 452 individuals of Leontodon spp., at the level of the archipelago, through the application of four out of 24 putative microsatellites tested as molecular markers, also known as simple sequence repeats (SSR). As main results, L.
rigens exhibits 77 alleles in total (average of 19.25), ranging from 13 for marker
LR2A02 to 25 for LR4B08, and an overall excess of homozygotes (multilocus Fis=0.377, ranging from 0.117 for LR2A02 to 0.481 for LR4B08), while L. filii displays 59 alleles in total (average of 14.75), ranging from 11 for LR2A02 to 18 for LR4B08, and an overall excess of homozygotes (Multilocus Fis=0.078, ranging from -0.237 at
locus LR2A02 to 0.577 at locus LR4B08). The two species have an equivalent value of
rare alleles, 84.4% for L. rigens and 83.1% for L. filii. PCoA and Bayesian approach confirmed the existence of two well-confirmed groups, but pooled L.filii from Faial with L.rigens, various hypotheses to explain this pattern is discussed.
Conservation measures should be applied to 11 populations of the island of São Miguel, six populations of the island of Pico, two from Terceira and one from São Jorge and Flores and the entire island of Corvo and Faial.
2
Resumo
O género Leontodon L. (Asteraceae) é constituído por cerca de 50 espécies e a sua área distribuição geográfica abrange a Europa, América do Norte, Norte de África e Ásia Ocidental (Bogler, 2006). Duas destas duas espécies são endémicas do Arquipélago dos Açores: Leontodon filii (Hochst. ex Seub.) Paiva & Ormonde and
Leontodon rigens (Dryand.) Paiva & Ormond (Silva et al., 2011).
No presente trabalho pretendeu-se efetuar um estudo completo sobre a variabilidade populacional de 452 indivíduos de Leontodon spp., ao nível do arquipélago. Ao nível genético, testaram-se marcadores moleculares relativos a 24 loci SSR putativos, tendo-se obtido bons resultados em 4.
Entre os quais, L. rigens apresentou 77 alelos no total (media= 19.25), desde13 para o marcador LR2A02 a 25 para o LR4B08 e com um excesso global de homozigotia (Multilocus Fis=0.377, desde 0.117 para LR2A02 a 0.481 para o LR4B08), enquanto L.
filii evidencia 59 alelos no total (em média 14.75), desde 11alelos no locus LR2A02 a
18 para LR4B08, com um excesso global de homozigotia (Multilocus Fis=0.078, desde -0.237 no locus LR2A02 a 0.577 no locus LR4B08). As duas espécies têm um valor equivalente de alelos raros, 84.4% para L. rigens e 83.1% para L. filii. Através do PCoA e análises Bayesianas confirmou-se a existência de dois grupos distintos, as populações de L. filii do Faial agruparam-se com L. rigens, foram formuladas variadas hipóteses para explicar esta disposição.
Medidas de protecção e conservação deverão ser aplicadas em 11 populações da ilha de São Miguel, 2 populações da ilha Terceira, 6 populações da ilha do Pico e 1 população nas ilhas de São Jorge e Flores, assim como todas as populações das ilhas do Corvo e Faial.
Acknowledgments
This study would not have been possible without the financial support of the MAC-PCT, FEDER. I‟m grateful to Secretaria Regional do Ambiente and Serviços Florestais for their support in the field. To my advisers a special and most grateful thank you for all the sharing of knowledge and priceless help, and last to my family, Lurdes Silva and Natália Cabral for being there during hard times.
1
Introduction
The Azorean archipelago is located in the NE of the Atlantic Ocean, between the 36º and 43º of North latitude and the 25º and 31º of West longitude. The closest land is the Iberian Peninsula, about 2000 km East, Madeira at 1200 km Southeast, New Scotland at 2300 km Northwest and Bermuda at 3500 km southwest. Azores is biogeographically part of Macaronesia.
The Azorean vascular plant flora comprises about 1000 taxa (Silva et al., 2011). Of these, no more than 300 are considered as native, of which circa 80 are considered as endemic. However, a series of fine-grain studies at the molecular level have started to unravel important clues about the real amount of plant biodiversity within the Azores, leading to the idea that there might be significantly more diversity in the archipelago‟s flora than has previously been documented. These studies have revealed new species and subspecies (Moura 2006; Moura et al. 2010; Schaefer 2003; Schaefer & Schönfelder 2009), and important population diversity levels (Moura 2006; Silva et al. 2011). Currently as part of Project Demiurgo MAC-PCT, more taxa are being studied, archipelago-wide, either using population diversity markers or phylogenetic markers (Moura et al. 2010).
The genus Leontodon L. (Asteraceae) comprises around 50 species and its natural distribution area covers Europe, North America, northern Africa, and western Asia (Bogler, 2006). Two of these species are endemic to the archipelago of the Azores:
Leontodonfilii (Hochst. ex Seub.) Paiva & Ormonde and Leontodonrigens (Dryand.)
Paiva & Ormond (Silva et al., 2011).
L. rigens is an hemicryptophyte with anemochorous and hydrochorous dispersal
and with natural populations estimated to include more than 10000 individuals. L. filii is also hemicryptophyte with epizoochorous and hydrochorous dispersal, included in Bern Convention (Appendix 1, Annex 1) and its natural populations were estimated to include from 5000 to 10000 individuals (Silva et al. 2009). The geographical distribution of the L. filii is in all the islands of the archipelago, with exception of Santa Maria, Graciosa and Corvo (Silva et al., 2011), usually found in steep slopes, ravines, inland cliffs, wet places in crater margins near watercourses, Juniperus forests and extremely wet bogs. L. rigens is geographically confined to the islands of Flores, Corvo
2 and São Miguel (Silva et al., 2011), mainly found in wetlands, coastal cliffs, steep slopes, craters, ravines, natural forests (Laurus, Juniperus), margins of permanent and semi-natural pastures, natural meadows (Holcus, Festuca), wet meadows, young lava flows with pioneer vegetation, waterfalls and roadside slopes (Silva et al., 2009). These two species sometimes co-exist in the same habitat.
According to Hind (2005), the two currently accepted LeontodonAzorean endemic species are members of the tribe Lactuceae subtribe Hypochaeridinae Less. (syn. Leontodontinae Hoffm.), they were originally described in the genus Crepis L. by Francis Masson (Hort. Kew, 1789), but transferred to Microderis DC., by A. De Candolle (Prod.7:127, 1838) with the type-specie Microderis rigens (Aiton.) DC. (=Crepis rigens Ait.). Seubert in Flora Azorica (1844) adds two more Azorean species in the Microderis genus (M. filii Hochst, ex Seubert and M. umbellata Hochst. ex Seubert). Bentham and Hooke in 1873 included the Azorean species in the genus Picris (M.rigens and M. umbellata = P. rigens; M. filii = P. filii), Hoffman (1894) on his monography of Compositae (in ENGL: & Prantl, Nat. Pflanzenfam. 4, 5: 363) on a final note says that on his opinion the genus Microderis DC., with the two species from Azores should belong to the Section of LeontodonL. instead of the genus Picris L., Hansen (1971) while referring to Microderis DC. added that “ This conception seems quit unacceptable as this genus most likely is closely related to the genus Leontodon, but best of all it should be treated as a separate genus”. Paiva and Ormonde (Bol. Soc. Brot., 1972) in their revision of Picris L. species, concluded that the Azorean species should be included in the Leontodongenus as Leontodonrigens (Ait.) J. Paiva & J. Ormonde and Leontodonfilii (Hochst. ex Seubert) J. Paiva & J. Ormonde. Both species are rosettiform perennial herbs and their mid-yellow to lemon-yellow ligulate capitula have paleaceous receptacles and transversely rugose achenes with plumose pappus setae (Paiva & Ormonde, 1974). Lack (1981) in his study of the Lactuceae of the Azorean islands demonstrated in a cytology essay of root-tip mitoses, that L. filii and L. rigens have 14 chromosomes and are diploids plants. Which was an important breakthrough in science of these endemic plants, because it allowed new genetic methodologies in the development of specific markers to study the members of this genus.
Historical references allied to recent morphological and molecular data point towards the existence of a higher variability than the current taxonomic delimitation presuppose, indicating a need to proceed to a taxonomic re-evaluation within the genus
3
Leontodonin the Azores, with the possible occurrence of a third species, and also a more
precise geographical circumscription (Moura et al., 2010).
As the current main criteria of identification between the species is the structure of the flower, only appearing at some period of the year and not in all plants, the discrimination of the L. rigens and L. filii is problematic in the islands where they both grow. In addition, it raises the question of a putative gene flow between the populations where the species are sympatric.
In this context, this present work proposes to undertake a comprehensive and complete study of population variability of Leontodon spp., at the level of the archipelago, through the application of microsatellites as molecular markers, also known as simple sequence repeats (SSR). This SSR, are non-coding repetitive DNA regions composed of small motifs of 1 to 6 nucleotides repeated in tandem, which are widespread in both eukaryotic and prokaryotic genomes, many studies have shown that primer pairs designed for one species can be used for other species of the same genus (Isagi and Suhandono, 1997; Roa et al., 2000; Zucchi et al., 2002), this microsatellite attribute being known as transferability or cross-species amplification. Transferability can be a very important factor in facilitating the use of microsatellites because it reduces costs when working on taxa with low microsatellites frequencies or from which microsatellites are difficult to isolate. Microsatellite transferability amongst related species is allowed by the homologous nature of the DNA sequence in microsatellite flanking regions. However, as expected, the successful amplification rate declines as genetic divergence between species increases (Oliveira et al., 2006). Therefore, in this study microsatellite markers transferable from one species of Leontodon to another were used in this study to assess the genetic signature of each taxa and to assign the doubtful plants to one of them. They will also be used to obtain a better understanding of the population dynamics within and between L. filii and L. rigens.
The main objectives of this current research are: 1) conduct an exhaustive sampling of populations of Leontodon spp. throughout the Azores archipelago, completing the existing Leontodon collection maintained at the Azorean Flora DNA Bank (AZB herbarium); 2) understand the intra and inter-population genetic variability patterns existing in the various populations of Leontodon spp. and their close relations in the archipelago; 3) identify cases of individuals with very low genetic variability, ie possible bottlenecks; 4) determine the correspondence between the known distribution for current Leontodon species in the Azores and the major groups of genetic variability
4 obtained; 5) screen the occurrence of other possible taxonomic units beyond the currently recognized, in order to complete existing data on morphology and sequences of the ITS region (Moura et al., 2010; Moura et al., unpublished).
Material and Methods
Plant Material
During the summer and the early autumn 2010, field trips to all the islands of the archipelago were carried out in order to enhance the existing collection of Leontodon ssp by sampling new populations and to complement collections already databased and maintained at the AZB herbarium in the DNA Bank Collection of Azores University. Additionally, populations were georeferenced ( Figure 1).
Our total sample was of 52 different populations from 7 islands of the Azores, in a total of 452 individuals (Table 1 and Table 2).
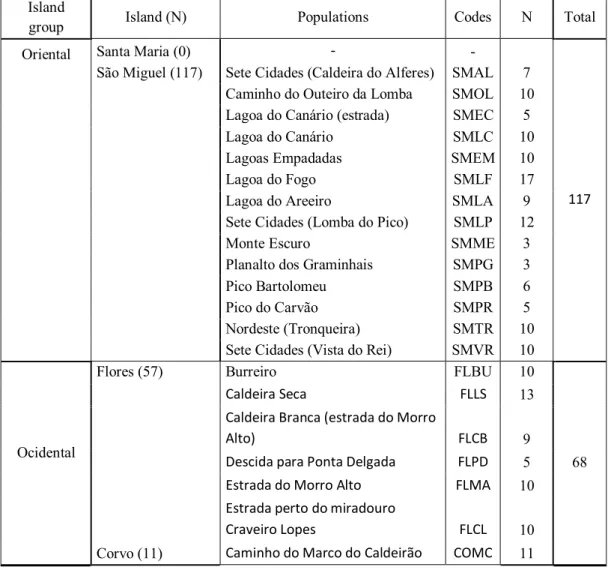
Table 1. Description of the geographical distribution of the collected individuals (N) of L. rigens. A total
of 185 samples were collected. Island
group Island (N) Populations Codes N Total
Oriental Santa Maria (0) - -
117
São Miguel (117) Sete Cidades (Caldeira do Alferes) SMAL 7
Caminho do Outeiro da Lomba SMOL 10
Lagoa do Canário (estrada) SMEC 5
Lagoa do Canário SMLC 10
Lagoas Empadadas SMEM 10
Lagoa do Fogo SMLF 17
Lagoa do Areeiro SMLA 9
Sete Cidades (Lomba do Pico) SMLP 12
Monte Escuro SMME 3
Planalto dos Graminhais SMPG 3
Pico Bartolomeu SMPB 6
Pico do Carvão SMPR 5
Nordeste (Tronqueira) SMTR 10
Sete Cidades (Vista do Rei) SMVR 10
Ocidental
Flores (57) Burreiro FLBU 10
68
Caldeira Seca FLLS 13
Caldeira Branca (estrada do Morro
Alto) FLCB 9
Descida para Ponta Delgada FLPD 5
Estrada do Morro Alto FLMA 10
Estrada perto do miradouro
Craveiro Lopes FLCL 10
5
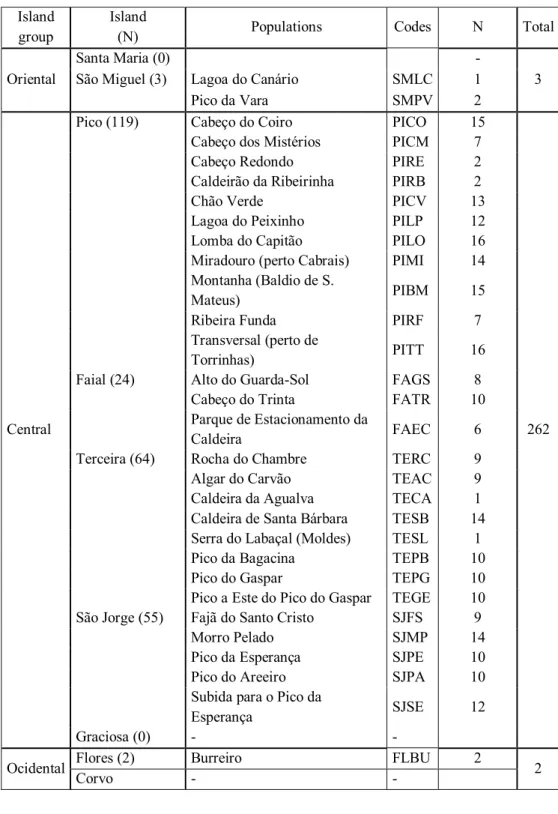
Table 2. Description of the geographical distribution of the samples of Leontodonfilii. A total of 267
individuals were collected. Island
group
Island
(N) Populations Codes N Total
Oriental
Santa Maria (0) -
3
São Miguel (3) Lagoa do Canário SMLC 1
Pico da Vara SMPV 2
Central
Pico (119) Cabeço do Coiro PICO 15
262
Cabeço dos Mistérios PICM 7
Cabeço Redondo PIRE 2
Caldeirão da Ribeirinha PIRB 2
Chão Verde PICV 13
Lagoa do Peixinho PILP 12
Lomba do Capitão PILO 16
Miradouro (perto Cabrais) PIMI 14
Montanha (Baldio de S.
Mateus) PIBM 15
Ribeira Funda PIRF 7
Transversal (perto de
Torrinhas) PITT 16
Faial (24) Alto do Guarda-Sol FAGS 8
Cabeço do Trinta FATR 10
Parque de Estacionamento da
Caldeira FAEC 6
Terceira (64) Rocha do Chambre TERC 9
Algar do Carvão TEAC 9
Caldeira da Agualva TECA 1
Caldeira de Santa Bárbara TESB 14
Serra do Labaçal (Moldes) TESL 1
Pico da Bagacina TEPB 10
Pico do Gaspar TEPG 10
Pico a Este do Pico do Gaspar TEGE 10
São Jorge (55) Fajã do Santo Cristo SJFS 9
Morro Pelado SJMP 14
Pico da Esperança SJPE 10
Pico do Areeiro SJPA 10
Subida para o Pico da
Esperança SJSE 12
Graciosa (0) - -
Ocidental Flores (2) Burreiro FLBU 2 2
6
Fig.1.Location of the Leontodon sample collection in the three groups of the Azores Archipelago. L. filii is represented with green dots and L. rigens is represented by red
dots.
Ocidental Group
7
Microsatellites development
We extracted total DNA from one individual of L. rigens using the CTAB extraction method modified from Doyle and Doyle (1990). Briefly, 3 cm² of fresh leaves were powdered with PolyvinylPyrrolidone using liquid nitrogen. They were then incubated during 45 minutes at 65ºC in 500 µl of 2X CTAB (100 mM Tris-HCl pH 8.0; 1.4 M NaCl; 20 mM EDTA; 2% CTAB), 50 µl of 10% Sarcosyl buffer (100 mM Tris-HCl pH 8.8; 20 mM EDTA; 10% Sarcosyl) and 10 µl of Proteinase K (AppliChem). The sample was thoroughly mixed with 500 µl of 24:1 chloroform: isoamylacohol and centrifuged 3 min at 13000 rpm. The supernatant was slowly mixed with 450 µl of isopropanol to allow DNA precipitation. The tube was then centrifuged 15 minutes at 12000 rpm, the liquid phase was discarded and the pellet obtained was allowed to dry 80m at 30ºC in a dry bath before being re-suspended in 40 µl of pure water. The solution of DNA obtained was sent to the Savannah River Ecology Laboratory (University of Georgia) where the enrichment procedure described in Glenn and Schable (2005) with the exceptions described in Lance et al. (2010) was followed for the microsatellites isolation. Afterwards, the enriched libraries were sequenced on a 454 using titanium chemistry following standard Roche 454 library protocols (454 Life Sciences, a Roche company, Brandford CT). Sequences were subjected to a 3' quality trim where only one base in the last 25 bases of the sequence contains a quality score less than 20 or alternatively contains one ambiguous base. CAP3 was then used to assemble sequences at 98% sequence identity using a minimal overlap of 75 bp. Along with singlets, contigs of two or three sequences were searched for the presence of microsatellite DNA loci using the program MSATCOMMANDER version 0.8.1 (Faircloth 2008) and primers designed with Primer3. One primer from each pair was extended on the end with an engineered sequence (M13R tag 5‟-GGAAACAGCTATGACCAT-3‟) to enable the use of a third primer identical to the M13R that will allow the cheap fluorescent labeling of the PCR product obtained (e.g. Oetting et al. 1995; Schuelke 2000) and a GTTT “pigtail” was added to the 5‟-end of the untagged primers of the pairs to facilitate accurate genotyping (Browstein et al. 1996). Out of the 183 sequences of primer pairs provided by the Savannah River Ecology Lab we selected 24 primer pairs, 12 with expected PCR products ranging between 100-200 bp (A series) and 12 exhibiting expected PCR products ranging between 200 and 300 bp (B series) to allow later multiplex. All the primer pairs (with
8 the tag sequence included) were selected on criteria of non-complementarities within and between primers, low secondary structures and 3‟-end instability (Rychlik 1993).
DNA Extraction
Leaves of 452 individuals of Leontodon collected for the population study were kept dry in silica. DNA was then DNA was extracted from dry leafs kept in silica-gel and all the material was processed using a modified Doyle & Dickson CTAB protocol for DNA extraction. Due to the difficulties encountered to obtain high quality DNA, these modifications, ensued from Borges et al. (2009), consisted in using 700 l of 3 X CTAB, 50 l of Sarcosyl and 10 l of Proteinase K for the initial lyses step, in performing a first washing step with 500l of chloroform-isoamylalchol (24:1) (SEVAG) and then carrying out an additional wash with 500l of SEVAG and 200l of 3 X CTAB. DNA was then precipitated by adding 450l of isopropanol. Finally, the pellet obtained was suspended in 50l of pure water.
DNA samples‟ qualities and quantities were then measured using a Nanodrop 2000 (Thermo Fisher Scientific) spectrophotometer. Samples were the conserved at -20ºC until use.
Microsatellites selection
In the first phase of the test, all the 24 primer pairs were tested on four samples of L.rigens and four samples of L. filii using a unlabelled tag primer in a final volume of 25 µl consisting in 25 ng of DNA, 1X NH4 Buffer, 1.5 mM MgCl2, 0.4 uM of untagged primer, 0.08 uM of tagged primer, 0.36 uM of unlabelled tag primer, 200 uM of dNTPs, 1U of Immolase (Bioline) and using a Biometra TGradient thermocycler. Touchdown thermal cycling programs (Don et al. 1991) encompassing a 10°C span of annealing temperatures ranging between 64-54°C were used for all loci. The PCR program consisted at 95°C for 7 minutes, 96ºC for 3 minutes followed by 20 cycles of 96°C for 30 secondes, the highest annealing temperature of 64°C (decreased of 0.5°C per cycle) for 30 secondes, and 72°C for 30 secondes; 20 cycles of 96°C for 30 secondes, 54°C for 30 secondes, and 72°C for 30 secondes; and finally 72°C for 10 minutes for the final extension of the PCR products. Five µl of PCR products were then run on a 3.5%
9 agarose gel, stained with SafeViewTM Nucleic Acid Stain (abm) and visualized under
UV to check for amplification, polymorphism and scorability of the bands. Eleven primer pairs exhibited scorable amplified product of the expected length range and with at least two alleles. In the second phase, the variability of the eleven polymorphic loci was assessed in 24 samples: 16 L. rigens and 8 L. filii, coming from a total of 13 populations (Table 3).
After careful analysis of the PCR products quality with the use of the universal primer M13R we realized that from the initial 11 primers 6 revealed unclear and dubious amplification patterns therefore the remaining 4 primers with acceptable to high scorability were selected to run the complete study (table 3).
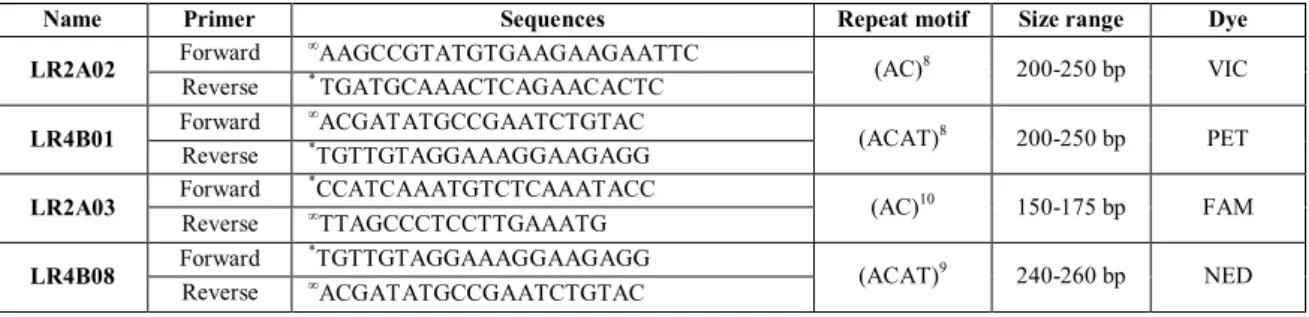
Table 3. Description of the 4 SSR polymorphic loci that exhibited acceptable to high scorability in the
genus Leontodon.*Indicates M13R tag (5‟-GGAAACAGCTATGACCA-3‟); Indicates “pigtail” tag
(5‟-GTTT-3‟).
Name Primer Sequences Repeat motif Size range Dye
LR2A02 Forward AAGCCGTATGTGAAGAAGAATTC (AC)8 200-250 bp VIC Reverse * TGATGCAAACTCAGAACACTC LR4B01 Forward ACGATATGCCGAATCTGTAC (ACAT)8 200-250 bp PET Reverse *TGTTGTAGGAAAGGAAGAGG LR2A03 Forward *CCATCAAATGTCTCAAATACC (AC)10 150-175 bp FAM Reverse TTAGCCCTCCTTGAAATG LR4B08 Forward *TGTTGTAGGAAAGGAAGAGG (ACAT)9 240-260 bp NED Reverse ACGATATGCCGAATCTGTAC
Table 4. PCR conditions for the set of microsatellites selected for the wide-range genotyping of the
Azorean Leontodon.
Name PCR Mix (Vf=25l -100ng of DNA) Cycling Program
LR2A02
100 g/ml of BSA. 1X NH4 Buffer, 2.5 mM MgCl2, 0.4untagged primer., 0.08 M tagged primer., 0.36 M Universal tag M13R., 200 M dNTP, 1.25 U of Biotaq
95ºC for 4 minutes; 22 cycles: 95ºC for 30 seconds, 64ºC (Touchdown -0.5ºC each cycle) for 45 seconds, 72ºC for 45 seconds; 11 cycles: 95ºC for 30 seconds. 53ºC for 45 seconds, 72ºC for 45 seconds; 72ºC for 10 minutes
LR2A03
100 g/ml of BSA, 1X ImmoBuffer, 3 mM MgCl2, 0.4 untagged primer, 0.12M tagged primer, 0.28 M Universal tag M13R, 200 M dNTP, 1 U of Immolase
95ºC for 7 minutes; 96ºC for 3 minutes; 20 cycles: 95ºC for 30 seconds, 65ºC (Touchdown -0.5ºC each cycle) for 30seconds, 72ºC for 45 seconds; 20 cycles: 95ºC for 30 seconds, 55ºC for 30 secondes, 72ºC for 30 seconds; 72ºC for 10 minutes
LR4B01 LR4B08
100 g/ml of BSA, 1X ImmoBuffer, 3 mM MgCl2, 0.4 untagged primer., 0.2 M tagged primer, 0.2 M Universal tag M13R, 200 M dNTP, 1 U of Immolase
95ºC for 7 minutes; 96ºC for 3 minutes; 20 cycles: 95ºC for 30 seconds, 65ºC (Touchdown -0.5ºC each cycle) for 30seconds, 72ºC for 45 seconds; 20 cycles: 95ºC for 30 secondes, 55ºC for 30 secondes. 72ºC for 30 seconds; 72ºC for 10 minutes
10
Full scale genotyping
After optimization, the amplifications for the whole sample were performed using the protocols presented in table 4. The M13R was labelled either with PET, FAM, NED or VIC. The Taq polymerase chosen for all the SSR was Immolase (Bioline) with exception of the primer LR2A02 in which was used Biotaq (Bioline). The amplification products were then diluted, multiplexed and were run on an ABI-3130xl Genetic Analyzer and sized with LIZ500 size standard. The genotypes were scored using the software GeneMarker® V.1.97 Demo version (Softgenetics®).
Data analysis
The diversity of the overall sample of Leontodon in the Azores was described using the software GENETIX 4.02 (Belkhir et al. 2002) by calculating the mean number of alleles, the observed and expected mean heterozygosities (Hobs and Hexp, respectively) and Wright‟s fixation index (Fis) at each locus under the null hypothesis of Hardy-Weinberg (H-W) equilibrium. The expected mean heterozygosity was determined using the unbiased estimate method of Nei (1978); Fis values were calculated following Weir and Cockerham (1984).
The molecular data obtained from the Leontodon samples from the Azores were then analysed using the computer software DARwin version 5.0 (Perrier and Jacquemmoud-Collet 2006; Perrier et al. 2003) using a Principal Coordinate Analysis (PCoA) based on the dissimilarity matrix between genotypes. Dissimilarities were calculated using the simple matching indices for allelic data.
The number of distinct multilocus genotypes (MLGs) present within the islands and within the populations of each island was determined using the software GenoType (Meirmans and Van Tienderen 2004) which computes the genetic distances between all pairs of individuals using a distance index specifically meant for microsatellite data following the stepwise mutation model. In order to assess the exact number of MLGs in the dataset, we chose a threshold of zero, i.e. no difference allowed between clonemates. To shed another light to the genetic structure of Leontodon in Azores, we used a Bayesian Markov Chain Monte Carlo (MCMC) approach to estimate the number of genetic clusters. This model-based analysis was run with the program STRUCTURE version 2.3.3 (Pritchard et al. 2000) using a batch-oriented web program package for
11 construction of supermatrices ready for phylogenomic analyses (Kumar et al. 2009). For a pre-assigned number of genetic clusters K in the dataset, each of which characterized by a set of allele frequencies at each locus under the assumption of H-W and linkage equilibrium. STRUCTURE calculates the posterior probabilities of the data for each K called Ln P(D). We ran 10 replicates for each K value ranging from 1 to 10 with a burn-in length of 50,000 followed by 500,000 iterations of each chain using the admixture model along with the assumption of correlated allele frequencies between groups (Falush et al. 2003). STRUCTURE then partitioned individuals of the sample according to the membership coefficient Q, that ranges from 0 (lowest affinity to the group) to 1 (highest affinity to a group), across the K groups. The optimal value of K was then determined by examining both Ln P(D) and K, an ad hoc quantity related to the second order rate of change of the log probability of data with respect to the number of clusters (Evanno et al. 2005). Graphics of STRUCTURE results were produced by using DISTRUCT 1.1 (Rosenberg 2004).
Results
For both L. rigens and L. filii, the number of alleles, observed and expected heterozigosity, Wright‟s fixation index and percentage of rare alleles were calculated for each locus and for all loci (Table 6).
L. rigens exhibits 77 alleles in total (average of 19.25), ranging from 13 for
marker LR2A02 to 25 for LR4B08, and an overall excess of homozygotes (Multilocus Fis=0.377, ranging from 0.117 for LR2A02 to 0.481 for LR4B08), while L. filii displays 59 alleles in total (average of 14.75), ranging from 11 for LR2A02 to 18 for LR4B08, and an overall excess of homozygotes (Multilocus Fis=0.078, ranging from -0.237 at
locus LR2A02 to 0.577 at locus LR4B08). The two species have an equivalent value of
rare alleles, 84.4% for L. rigens and 83.1% for L. filii.
L. rigens in São Miguel and L. filii in Terceira, even though they don‟t belong to
the same species, display the higher amount of alleles (48 and 29 alleles, respectively) with an elevated excess of homozygotes (Fis=0.536 and Fis=0.209, respectively). The
12 three L. filii sampled in S. Miguel display 9 alleles in total, ranging from 1 for LR4B01 to 3 for LR2A02 and LR4B08.
In Flores, L. rigens exhibits 37 alleles in total and the multilocus Fis value, -0.108, suggests an excess of heterozygotes. However, locus specific Fis values, that are close to zero for loci LR2A02, LR4B08 and LR4B01 (ranging from -0.013 to 0.029) suggest that these markers follow H.W. equilibrium while Lr2A03 exhibits an important excess of heterozygotes (Fis= -0.385). The two individuals from L. filii collected in Flores exhibit a total of 6 alleles, ranging from 1 for LR4B01 and LR4B08 to 2 for LR2A02 and LR2A03.
L. rigens in Corvo (22 alleles in total, ranging from 2 in LR2A02 to 9 in
LR4B01) and L. filii in Faial (28 alleles in total, ranging from 5 in locus LR2A03 and LR4B01 to 12 in locus LR2A02) exhibit the same pattern with positive multilocus Fis value (0.248 and 0.073, respectively). Nevertheless, Fis values for LR2A02 (-0.333 and -0.093, respectively) and LR2A03 (-0.212 and -0.245, respectively) are negative while Fis values for LR4B01 (0.400 and 0.250, respectively) and LR4B08 (0.592 and 0.371, respectively) are positive.
L. filii in São Jorge (16 alleles in total, ranging from 3 in LR2A02 and LR4B01
to 6 alleles in locus LR2A03) have negative Fis values at all loci that reflect an excess of heterozygotes.
L. filii in Pico (20 alleles in total, ranging from 3 on locus LR4B01 to 7 in locus
LR2A03) exhibits negative Fis values at 3 out of the 4 loci, LR2A02 displaying a Fis value strongly positive (0.780). The multilocus Fis value is equal to -0.162, which demonstrates the presence of an excess of heterozygotes (Table 6).
13
Table 6. Number of genotyped individuals, number of alleles, Hobs, Hexp, Fis, percentage of rare alleles (frequency q0.05), for each locus of the L.rigens and L. filii populations distributed in the seven islands of the Azores Archipelago.
.
Species Island N
LR2A03 LR2A02 LR4B08 LR4B01 Multilocus
Alleles Hexp Hobs Fis Rare alleles
(%)
Alleles Hexp Hobs Fis
Rare alleles
(%)
Alleles Hexp Hobs Fis Rare alleles
(%)
Alleles Hexp Hobs Fis Rare alleles
(%)
Alleles Hexp Hobs Fis Rare alleles (%) L. rigens São Miguel 118 7 0.220 0.110 0.501 71.4 11 0.304 0.127 0.583 81.8 16 0.720 0.263 0.636 62.5 14 0.835 0.466 0.443 57.1 48 0.520 0.241 0.536 66.7 Flores 54 9 0.630 0.870 -0.385 77.8 3 0.055 0.056 -0.013 66.7 14 0.703 0.704 -0.001 78.6 11 0.686 0.667 0.029 63.6 37 0.519 0.574 -0.108 73.0 Corvo 11 3 0.454 0.545 -0.212 0.0 2 0.416 0.545 -0.333 0.0 8 0.866 0.364 0.592 0.0 9 0.892 0.545 0.400 0.0 22 0.657 0.500 0.248 0.0 Overall 183 15 0.408 0.361 0.117 86.7 13 0.247 0.131 0.469 84.6 25 0.399 0.141 0.481 88.0 24 0.856 0.530 0.381 79.1 77 0.570 0.355 0.377 84.4 L. filii São Miguel 3 2 0.600 1.000 -1.000 0.0 3 0.600 0.333 0.500 0.0 3 0.600 0.333 0.500 0.250 1 0.000 0.000 - 0.0 9 0.450 0.417 0.091 0.0 Terceira 55 7 0.710 0.636 0.105 57.1 6 0.419 0.291 0.307 50.0 9 0.747 0.600 0.199 0.375 7 0.716 0.527 0.265 28.6 29 0.648 0.514 0.209 44.8 São Jorge 53 6 0.592 0.830 -0.407 50.0 3 0.092 0.094 -0.028 66.7 3 0.509 0.566 -0.114 -0.058 4 0.573 0.679 -0.188 25.0 16 0.441 0.542 -0.232 43.8 Pico 118 7 0.593 0.864 -0.460 57.1 5 0.269 0.059 0.780 60.0 5 0.496 0.610 -0.232 0.018 3 0.488 0.610 -0.252 33.3 20 0.461 0.536 -0.162 50.0 Faial 24 5 0.605 0.750 -0.245 40.0 12 0.802 0.875 -0.093 50.0 6 0.722 0.458 0.371 0.335 5 0.608 0.458 0.250 40.0 28 0.685 0.635 0.073 46.4 Flores 2 2 0.667 1.000 -1.000 0.0 2 0.667 1.000 -1.000 0.0 1 0.000 0.000 0.000 - 1 0.000 0.000 - 0.0 6 0.333 0.500 -1.000 0.0 Overall 255 11 0.647 0.800 -0.237 72.7 16 0.360 0.204 0.435 87.5 18 0.767 0.671 0.577 88.9 14 0.663 0.580 0.125 78.6 59 0.585 0.540 0.078 83.1
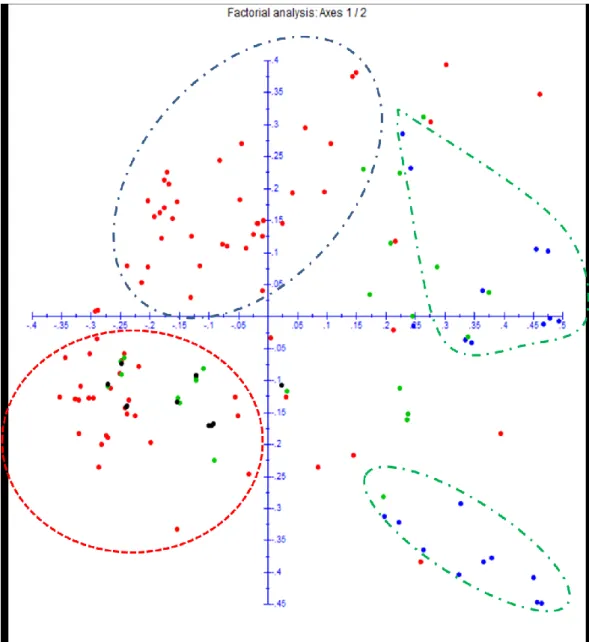
14 The factorial analysis performed on the distance matrix between genotypes of the entire sample of Leontodon is presented in Figure 2. Factors 1 and 2 represented 28.64% of the total variance observed. The L. rigens accessions clustered together in the left side of the graphic. All of the L. filii clustered in the right side of the graphic with the exception of the populations from Faial Islands and some individuals from Terceira Island that clustered on the left side of the graphic.
Fig. 2. PCoA performed on simple matching dissimilarities matrix obtained from the molecular data.
Accessions from the L. rigens are represented with red dots, L. filii accessions with green dots. The green dots inserted inside the black balloon belongs to the samples of Faial Island that unexpectedly clusters with L. rigens.
15 Due to this unexpected clustering structure, obtained with the software DARwin we tried a Bayesian approach by performing an analysis with STRUCTURE.
The posterior probabilities of the data for each K, called Ln P(D) in STRUCTURE output, along with their variance across runs are presented in Figure 3.A. The maximum value of Ln P(D) is reached for K = 10 but the plateau seems to start as soon as K = 2. Variance across runs is very low for K = 1 and K = 2 and increases for the values of K 3. Regarding the partitioning of individuals, clusters for K=2 exhibit a pattern that is consistent with the location of collection of the samples, i.e. all individual collected in a single island are clustering in the same group. The results obtained following the methodology of Evanno et al. (2005) are compiled in Figure 3. We observed two peaks of K. The first at K = 2 is the highest, the second at K = 4 is the smallest. Taking into consideration the variation across runs, the partitioning of individuals and the methodology proposed by Evanno et al. (2005), we assume K=2 as the real value of K with a Fst value of 0.228.
Fig. 3. Methodology from Evanno et al. (2005) for the interpretation of STRUCTURE results. A) Median
Ln(K), B) Ln‟(K), C) Ln‟‟(K) and D) Median Delta K are presented for each value of K. The two peaks of Median K at K = 2 and K = 4 indicate two putative right values for K
L(K) Mean L(K) -7000 -6000 -5000 -4000 -3000 -2000 -1000 0 0 1 2 3 4 5 6 7 8 9 10 K DeltaK 0 500 1000 1500 2000 2500 1 2 3 4 5 6 7 8 9 10 L'(K) 0 200 400 600 800 1000 1200 1400 0 1 2 3 4 5 6 7 8 9 10 K |L''(K)| 0 100 200 300 400 500 600 700 800 900 1 2 3 4 5 6 7 8 9 10 K K L(K) A) B) C) D)
16 The graphical display of STRUCTURE output for K002 is represented in Figure 4. Colours represent the proportion of each individual that belongs to each cluster.
Fig.4. Graphic display of STRUCTURE output. Individuals are represented as thin vertical lines
partitioned into segments corresponding to their membership in genetic clusters indicated by the colours.
As recommended by the user manual of STRUCTURE version 2.3.3 (Pritchard
et al. 2000). We ran a new analysis separately for L. rigens (with Faial included) and L. filii (without Faial) to detect the existence of sub-structures inside the two groups.
For L. rigens and the individuals from Faial, STRUCTURE identified three subgroups. The first one is only found in São Miguel. All but two individuals from Corvo belong to the second one. This second subgroup is also represented by some individuals from Flores and São Miguel. Most of the individuals from Flores belong to the third subgroup, which is also composed of almost all the individuals from Faial and some from São Miguel (data not shown).
According to STRUCTURE, L. filii except Faial is composed of three genetic clusters. The first is composed of individuals from Terceira, some from Pico and few from São Jorge. All the other individuals that do not belong to this first subgroup are assumed to ensue from two populations that are strongly admixed together but no non-admixed individuals were identified in our dataset (data not shown).
We also rerun DARwin separately for the two groups identified by STRUCTURE, and a PCoA was performed for each cluster for a more perceptible graphical display of the clustering, both analyses confirmed the data from STRUCTURE.
For the cluster composed of L. rigens along with the samples of L. filii collected in Faial, factors 1 and 2 represented 29.86% of the total variance observed (Figure 5). According to the results obtained with set of markers, the samples collected in the island of São Miguel exhibit most of the variability existing in this genetic cluster as they are spread all over the graphic (red dots). However, they seem to be concentrated in the left
17 part of the PCoA, and they appear divided into two subgroups: one exclusively composed of individuals from São Miguel and a second composed of individuals from São Miguel along with all the individuals collected in the island of Corvo and a few collected in Flores. The other individuals collected in the island of Flores are spread in the right side of the graphic. The samples from Faial are divided into 2 groups; the first one is mingled with individuals from Flores while the second one clusters separately in the graphic. Interestingly, out of the three individuals of L. filii collected in São Miguel, two clusters within this separate group and the third one is located nearby.
Fig. 5. PCoA performed on simple matching dissimilarities matrix obtained from the molecular data of
the L.rigens cluster. Accessions from São Miguel are represented with red dots, Corvo accessions with black dots, Faial accessions are represented with blue dots and Flores accessions are represented with green dots.
18 Group III
For the PCoA performed on the cluster composed of L. filii without the samples of L. filii collected in Faial, Factors 1 and 2 represented 34.71% of the total variance observed (Figure 6). Group I is composed of samples of the three islands of the analysis, all but one (LF-SJMP-010) of the individuals from São Jorge cluster in this group, out of the 11 populations of Pico, ten also cluster in Group I while out of 15 samples of the population Cabeço do Coiro, 12 constitutes Group II while three individuals cluster in Group III. Group III is mainly composed by individuals from Terceira spread inside the group with the exception of a subgroup composed of most of the individuals from the population of Rocha do Chambre along with LF-SJMP-010.
Fig. 6. PCoA performed on simple matching dissimilarities matrix obtained from the molecular data of
the L. filii cluster. Accessions from the São Jorge are represented with red dots, Pico accessions with black dots and Terceira accessions are represented with green dots.
19 For the allelic frequencies at the four locus, the general pattern indicates a distribution of genetic diversity higher in cluster 2 (L.rigens and L. filii of Faial), with the presence of more alleles than in cluster 1 (L. filii from Pico, Terceira and São Jorge) (Figure 7).
For cluster 1 the dominant alleles for the four markers are similar in all the islands inside this group. In cluster 2, the diversity of dominant alleles between the four is higher. Particular differences appear in Corvo that exhibits unique patterns of alleles in locus LR4B08 and LR4B01. In the case of the island of Faial a large range of alleles present at locus LR2A02.
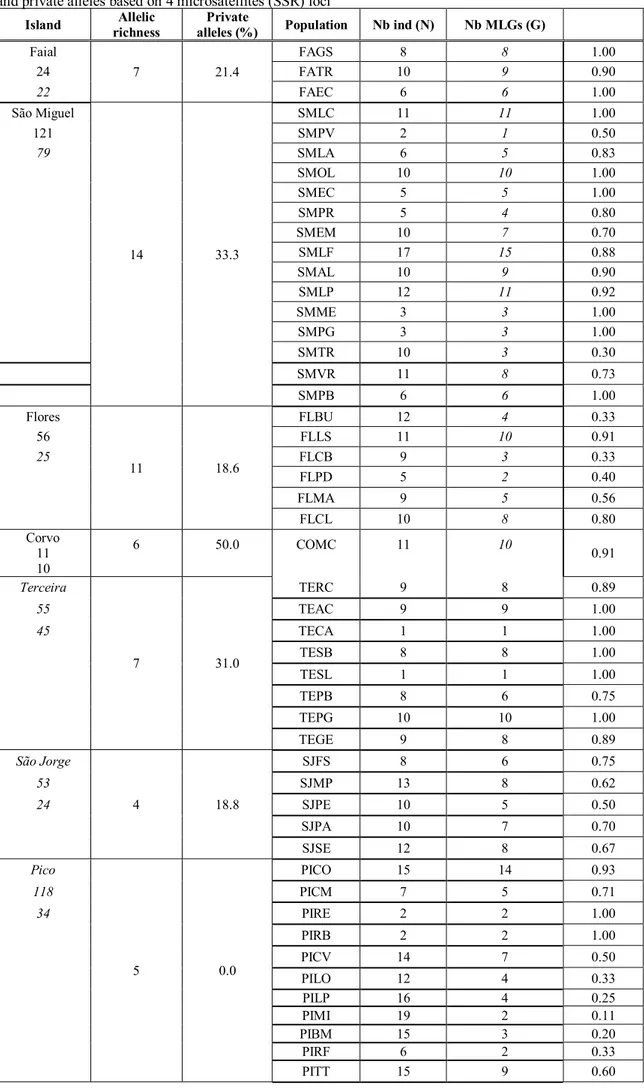
The allelic richness for all islands is given as the average number of alleles per loci. Private alleles are the estimated number of alleles per island that do not appear elsewhere in the sample, for our set of four markers the allelic richness varies from an average of 4 alleles São Jorge to 14 alleles at São Miguel. The island with a higher percentage of private alleles is Corvo (50%) and the island with a lower percentage of allelic richness is Pico with a lack of private alleles (Table 7).
In order to better evaluate genetic diversity within populations and within islands, the number of distinct multilocus genotypes (MLGs) were calculated (Table 7). With our set of four markers L. filii exhibits 90 different Multilocus Genotypes (MLGs) out of 226 individuals sampled while L. rigens exhibits 132 different MLGs out of 212 individuals sampled. In L. filii, the samples of the populations of TEAC, TECA, TESB, TESL and TEPG (Terceira), of PIRE and PIRB (Pico) all display different MLGs while those of PIMI, PIBM, PILP, PIRF and PILO (Pico) exhibit very low rates of different MLGs (G/N < 0.33). In L. rigens, the samples of the populations of FAGs and FAEC (Faial) and of SMLC, SMOL, SMME, SMPG and SMPB (São Miguel) all exhibit different MLGs while those from FLBU, FLCB and FLPD (Flores) display few different MLGs (G/N< 0.40).
20
Island richness Allelic alleles (%) Private Population Nb ind (N) Nb MLGs (G)
Faial 7 21.4 FAGS 8 8 1.00 24 FATR 10 9 0.90 22 FAEC 6 6 1.00 São Miguel 14 33.3 SMLC 11 11 1.00 121 SMPV 2 1 0.50 79 SMLA 6 5 0.83 SMOL 10 10 1.00 SMEC 5 5 1.00 SMPR 5 4 0.80 SMEM 10 7 0.70 SMLF 17 15 0.88 SMAL 10 9 0.90 SMLP 12 11 0.92 SMME 3 3 1.00 SMPG 3 3 1.00 SMTR 10 3 0.30 SMVR 11 8 0.73 SMPB 6 6 1.00 Flores 11 18.6 FLBU 12 4 0.33 56 FLLS 11 10 0.91 25 FLCB 9 3 0.33 FLPD 5 2 0.40 FLMA 9 5 0.56 FLCL 10 8 0.80 Corvo 11 10 6 50.0 COMC 11 10 0.91 Terceira 7 31.0 TERC 9 8 0.89 55 TEAC 9 9 1.00 45 TECA 1 1 1.00 TESB 8 8 1.00 TESL 1 1 1.00 TEPB 8 6 0.75 TEPG 10 10 1.00 TEGE 9 8 0.89 São Jorge 4 18.8 SJFS 8 6 0.75 53 SJMP 13 8 0.62 24 SJPE 10 5 0.50 SJPA 10 7 0.70 SJSE 12 8 0.67 Pico 5 0.0 PICO 15 14 0.93 118 PICM 7 5 0.71 34 PIRE 2 2 1.00 PIRB 2 2 1.00 PICV 14 7 0.50 PILO 12 4 0.33 PILP 16 4 0.25 PIMI 19 2 0.11 PIBM 15 3 0.20 PIRF 6 2 0.33 PITT 15 9 0.60
Table 7.Number of distint multilocus genotypes (G), Number of individuals (N), the number of MLGs per population (G/N), Allelic
21
Fig. 7.Allele frequency for four SSR markers within the L. filii and L.rigens samples collected in the Azores Archipelago.
22
Discussion
The main objectives of this current research were in first place to conduct an exhaustive sampling of the populations of Leontodon spp. throughout the Archipelago of the Azores and to complement the existing Leontodon collection maintained at the Azorean Flora DNA Bank (AZB herbarium). This was fully achieved by the enlargement of the number of populations of Leontodons sp. identified, collected and georeferenced in the seven islands where the genus is present.
This study shed a new light in the understanding of the genetic structure present in the Leontodon ssp. of the Archipelago. The presence of two well-defined groups (L.
rigens and L. filii), is confirmed by the PCoA and the Bayesian approach (Figures 2, 3
and 4). However, these two approaches based on the molecular data obtained with a set of 4 SSR also assessed that L. rigens share a bigger genetic background with L. filii from Faial than those from Pico, Terceira, and São Jorge. The sub-structures within the two main groups are complex and further studies regarding the taxonomical circumscription of this species should occur.
This data induces the formulation of some hypothesis: 1) Are the L. filii from Faial misidentified? According to morphological characterization still at work of the Azorean Leontodon displayed no differences were identified between the individuals from Faial and the other L .filii , also current phylogenetic work indicates that L. filii samples from Faial shows variability from other L. filii sequenced, pertaining to a single base pair position (Moura 2010; personal communication), which assessed that
Leontodon in Faial belongs to L. filii, the possibility of misidentification of the species
in this island is low. 2) Are the L. rigens closer to L. filii from Faial than to L. filii from the other islands? This hypothesis is highly possible, and easy to see in the PCoA in figure 2 and 4. This may suggest an ancestry of L .rigens that could explain why this species holds the higher number of alleles in which many are shared by the populations of Faial. In this case, there is the possibility that in the past, Azores only held one species of Leontodon that has then undergone natural selection and genetic drift which led to speciation.
On the other hand, this genetic pattern displayed in Faial might be a specificity of these populations that are isolated in the Caldeira and might have kept some ancestral alleles and alleles combination, as this might have happened to L. filii in São Miguel
23 and Flores. Additionally, in the PCoA performed (Fig. 5), the three L. filii collected in São Miguel all clustered along with the individuals from Faial. These remnant L. filii in São Miguel and Flores along with the specificity of the populations from Faial may be explained by historical demographic events. According to Silva et al. (2010), these events have a strong influence on the actual genetic architecture of a species and are the most plausible explanation for our results concerning inter-island connectivity between populations. On islands, historical events such as the number of colonizing individuals and possible founder effects, the sequence of island colonization, the colonization between islands, catastrophic events like volcanic eruptions (with subsequent possible bottlenecks), and the episodic occurrence of colonization opportunities for certain islands are especially important considerations that should be taken into account. One island is usually the result of several volcanic events that took place in the last several hundred thousand years. For example, the subaerial eruptions that formed the eastern part of Terceira Island probably began 3.5 million years ago and lasted up to 370,000 years ago. Subsequently, two large volcanic events that shaped the central and western parts of the island began 270,000 and 29,000 years ago, respectively (Calvert et al. 2006). Ensuing smaller eruptions occurred up to AD 1761. Thus, volcanic activity was a periodic disturbance with varying scales of severity, from large caldera-forming eruptions to small lava flows. The most severe events are especially important, since they likely destroyed large areas of vegetation. Surviving populations were small and presumably subject to genetic drift. Moreover, subsequent recolonizing events could have occurred from sources outside the island, leaving relic populations in the older parts of the islands (Trusty et al. 2005). These relic populations may not have been homogenized by gene flow.
This phenomenon may also explain why L. filii from TERC (Terceira) and PICO (Pico) cluster separately in both the PCoA (Fig. 6) and in the second run of STRUCTURE (data not shown) and why the L. rigens from Corvo display 50% of private alleles (Fig. 7, table 7) even though morphological studies does not show any particularities for these populations (Moura et al. 2010) Molecular data is known to be convenient to reveal little differentiation among populations considered divergent based on morphology (Schneider et al. 1999; McKay et al. 2005), particularly when these differences represent largely phenotypic plasticity (Coyne & Orr 2004) but our set of molecular markers also appears to be an efficient tool for assessing genetic differentiation between populations that do not exhibit any morphological variation.
24 Such patterns of differentiation should be taken into consideration for conservation management activities in island biota since evaluation of genetic diversity can be the basis for the establishment of conservation strategies (Grassi et al. 2005). Our results on genetic differentiation between populations strongly suggest that the concept of provenance should be taken into account when formulating augmentation or reintroduction strategies. For example, the comparably high genetic specificity of populations in Corvo and Faial along with TERC in Terceira and PICO in Pico suggests that seeds or individuals from these islands should not be used in reintroduction programs on other islands as might correspond to different genetic entities.
Allelic richness, that is acknowledged to be the most relevant criteria for measuring diversity in the context of genetic conservation (Schoen & Broen 1993; Kremer 1994; Bataillon et al. 1996; El Mousadik & Petit 1996; Marshal and Brown 1975; Petit 1998), is higher in São Miguel, Flores, Terceira and Faial (Table 7). Additionally, our set of four markers, established that the islands with the higher percentage of private alleles are Corvo, São Miguel, Terceira and Faial (Table 7; Figure 7) and that they should be prioritary for conservation. We also took into consideration Fis values which reveal excesses of homozygotes, i.e. the populations with positive Fis values (data not shown) are subjected to inbreeding which can increase the chances of offspring to be affected by recessive or deleterious traits. Furthermore the number of individuals of Leontodon that exhibit identical MLGs is high in some populations. As the sampling was designed to avoid the collect of clones, we assume that these MLGs ensue from different mating events and that their strong occurrence highlights the small amount of alleles taking part into the mating in that specific places (Table 7). The compilation of the percentage of private alleles, of the genetic difference of some populations, of the Fis values for each population along with the rate of MLGs repetition within populations shows that the need to implement protective conservation measures is crucial for the entire islands of Corvo and Faial, for PICO, PIMI, PIBM, PIRF, PILP and PILO in Pico, TERC and TESB in Terceira, SJFS in São Jorge, FLLS in Flores and eleven populations of São Miguel (SMAL, SMLA, SMLC, SMEM, SMLF, SMLP, SMOL, SMPR, SMPB, SMTR and SMVR) (Figure 8).
So besides government imposed restrictions to interpopulation mixture and commerce of Azorean Leontodon plants, other management measures should be undertaken similarly to what is presently implemented in the Canary Islands for endangered species (Martín 2005), such as information campaigns, training of roadside
25 workers in natural areas and the implementation of a regional recovery plan. Further research should focus on the intra and inter-population dynamics and evolution of both species along with the monitoring of sensitive populations. Appropriate Leontodon specific conservation and restoration measures could be, thus, implemented. The present work provides a set of SSR markers that can be used for these purposes.
Fig. 8. Populations of Azorean Leontodon (L. rigens in red dots and L.filii in green dots) in need of
conservation measures implemented according to Fis values, specificity of genetic background( private alleles, allelic richness) and specific clustering in PCoA.
26
References
Bataillon, T.M., David, J.L., & Schoen, D.J. 1996. Neutral genetic markers and consservation genetics : simulated germplasm collections. Genetics 144 :409-417.
Belkhir K, Borsa P, Chikhi L, Raufasre N, BonHomme F (2002) Genetix 4.04, Logiciel sous Windows TM pour la genetique des populations Laboratoire Génome, Populations, Interations. CNRS UMR5000. Université de Montpellier II, France. Bogler, D. J., 2006. LeontodonLinnaeus. Flora of North America. Vol. 19, 20 and 21 Borges, A., Rosa, M.S., Recchia, G.H., Queiroz-Silva, J.R.; Bressan, E.A., &Veasey,
E.A. 2009, CTAB Methods for DNA Extraction of sweetpotato for microsatellite analysis. Sci. Agric. (Piracicaba, Braz.), v.66, n.4, p.529-534.
Calvert AT, Moore RB, McGeehin JP, Silva AMR (2006) Volcanic history and 40Ar/39Ar geochronology of Terceira Island, Azores, Portugal. J Volcanol Geothermal Res 156:103–115
Coyne, J. A., and H. A. Orr. 2004. Speciation. Sinauer Associates, Inc.,Sunderland, Massachusetts.
Don RH, Cox PT, Wainwright BJ, Baker K, Mattick JS (1991) „Touchdown‟ PCR to circumvent spurious priming during gene amplification. Nucleic Acids Research 19: 4008-4008.
El Mousadik, A., & Petit, R.J. 1996. High level of genetic differentioation for allelic richness among populations of the argan tree Argania spinosa(L.) Skeels endemic to Morocco. Theoretical and Applied Genetics 92:832-839.
Faircloth, B.C., 2008. MSATCOMMANDER: detection of microsatellite repeat arrays and automated, locus-specific primer design. Mol. Ecol. Resources, 8: 92-94. França Z, Cruz JV, Nunes JC, Forjaz VH (2003) Geologia dos Açores: uma perspectiva
actual. Açoreana 10(1):11–140
Grassi F, Cazzaniga E, Minuto L, Peccenini S, Barberis G, Basso B (2005) Evaluation of biodiversity and conservation strategies in Pancratium maritimum L for the Northern Tyrrhenian Sea. Biodivers Conserv 14:2159–2169
Hind N. (2005) Leontodonrigens Compositae, The Board of Trustees of the Royal Garden of Kew. Blackwell Publishing Ltd. Oxford, UK, 153-160 p.
27 Isagi Y and Suhandono S (1997) PCR primers amplifying microsatellite loci of Quercus
myrsinifolia Blume and their conservation between oak species. Molecular
Ecology 6:897-899.
Kremer, A. 1994. Diversité génétique et variabilité des caracteres phénotypiques chez les arbres forestiers. Genetics, Selection, Evolution 26 (suppl 1):105s-123s. Kumar S., Åsmund Skjæveland, Russell JS Orr, Pål Enger, Torgeir Ruden, Bjørn-Helge
Mevik, Fabien Burki, Andreas Botnen and Kamran Shalchian-Tabrizi. AIR: A batch-oriented web program package for construction of supermatrices ready for phylogenomic analyses. BMC Bioinformatics 2009, 10:357
Marshall, D.R. & Brown A.H.D. 1975. Optimum sampling strategies in genetic conservation. Pages 53-80 in O.H. Frankel and J.G. Hawkes, editors. Crop genetic resources for today and tomorrow. Cambridge University Press, Cambridge, United Kingdom.g
Martín JL (2005) Guía metodológica para la elaboración de planes de especies amenazadas de Canarias. Dirección General del Medio Natural, Gobierno de Canarias
McKay, J.K. Christian, C.E., Harrison, S. & Rice K.J. 2005. “How Local is Local?” – A Review of Practical and Conceptual Issues in the Genetics of Restoration. Restoration Ecology.
Moura M., Dias E.F., Silva L., Schaefer H. & Carine M.A. 2010. Molecular systematics and morphology of the endemic Leontodonin the Azores islands. Communication. International Symposium FloraMAC 2010. September 23-25, Ponta Delgada, Açores.
Moura, M. 2006. Desenvolvimento de estratégias para a conservação de Viburnum tinus ssp. subcordatum (Trel.) P. Silva: multiplicação por via seminal e vegetativa e estudo da variabilidade genética das suas populações. 277p. Universidade dos Açores, Ponta Delgada.
Nunes JC, Camacho A, Franc¸a Z, Montesinos FG, Alves M, Vieira R, Velez E, Ortiz E (2006) Gravity anomalies and crustal signature of volcano-tectonic structures of Pico Island (Azores). J Volcanol Geothermal Res 156:55–70
Oliveira E.J, Pádua, J.G., Zucchi M.I., Vencovsky R. & Vieira M.L.C (2006), Origin, Evolution and Genome Distribution of microssatellites. Genetics and Molecular
28 Perrier X, Flori A, Bonnot F (2003) Data analysis methods. In: Hamon P, Seguin M, Perrier X, Glaszmann JC (Eds) Genetic diversity of cultivated tropical plants. Enfield, Sciences Publisher, Montpellier, France, pp. 43-76
Perrier X, Jacquemmoud-Collet JP (2006) DARwin software. Available from http://www.darwin.cirad.fr/darwin
Rychlik W (1995) Selection of primers for polymerase chain reactions. Molecular Biotechnology 3:129-134.
Roa AC, Chavarriaga-Aguirre P, Duque MC, Maya MM, Bonierbale, Iglesias C and Tohme J (2000) Cross species amplification of cassava (Manihot esculenta) (Euphorbiaceae) microsatellites: Allelic polymorphism and degree of relationship American Journal of Botany 87:1647-1655.
Rozen, S. & Skaletsky H.J., 2000. Primer3 on the WWW for general users and for biologist programmers. In: Bioinformatics Methods and Protocols: Methods in
Molecular Biology (eds Krawetz S, Misener S). Humana Press, Totowa, NJ.
Schaefer H. & Schönfelder P. 2009. Smilax azorica, S. canariensis (Smilacaceae) and the genus Smilax in Europe. Monografías del Instituto de Estudios Canarios, 78: 297–307.
Schaefer H. 2003. Chorology and diversity of the Azorean flora. Dissertationes
Botanicae, 374: 1–130.
Schneider, C. J., T. B. Smith, B. Larison, and C. Moritz. 1999. A test of alternative models of diversification in tropical rainforests: ecological gradients vs. rainforest refugia. Proceedings of the National Academy of Sciences U.S.A. 96:13869–13873.
Schoen, D.J. & Brown, A.H.D. 1993. Conservation of allelic richness in wild crop relatives is aided by assessment of genetic markers. Proceedings of the National Academy of Sciences U.S.A. 90:10623-10627.
Schuelke M (2000) An economic method for the fluorescent labeling of PCR fragments: a poor man‟s approach to genotyping for research and high-throuput diagnostics. Nature Biotechnology 18:233-234.
Silva L., Elias R.B., Moura M., Meimberg H. & Dias E. 2011. Genetic Variability and differentiation among populations of the Azorean endemic gymnosperm
Juniperus brevifolia: baseline information for a conservation and restoration
29 Silva, L., Moura, M., Schaefer, H., Rumsey, F. & Dias, E.F. (2010). List of vascular plants (Tracheobionta). In: Borges, P.A.V., Costa, A., Cunha, R., Gabriel, R., Gonçalves, V., Martins, A.F., Melo, I., Parente, M., Raposeiro, P., Rodrigues, P., Santos, R.S., Silva, L., Vieira, P. & Vieira, V. (eds.) A list of the terrestrial and marine biota from the Azores. pp. 9-33, Princípia, Cascais, 432 pp.
Trusty JL, Olmstead RG, Santos-Guerra A, Sa´-Fontinha S, Francisco-Ortega J (2005) Molecular phylogenetics of the Macaronesian endemic genus Bystropogon (Lamiaceae): palaeo-islands, ecological shifts and interisland colonisations. Mol Ecol 14:1177–1189
Zucchi MI, Brondani RV, Pinheiro JB, Brondani C and Vencovsky R (2002) Transferability of microssatellites markers from Eucalyptus ssp. To Eugenia