Acta Scientiarum
http://www.uem.br/acta ISSN printed: 1679-9275 ISSN on-line: 1807-8621
Doi: 10.4025/actasciagron.v38i2.26607
Soil water balance in different densities of
Pinus taeda
in Southern
Brazil
Jorge Luiz Moretti de Souza1, Kharyn Freitas Fezer1, Bruno César Gurski1*, Daniela Jerszurki1
and Paulo Eugênio Pachechenik2
1
Departamento de Solos e Engenharia Agrícola, Universidade Federal do Paraná, Rua dos Funcionários, 1540, 80035-050, Curitiba, Paraná, Brazil. 2Escola de Ciências Agrárias e Medicina Veterinária, Pontifícia Universidade Católica, Curitiba, Paraná, Brazil. *Author for correspondence. E-mail: brunogurski@ufpr.br
ABSTRACT. This study aimed to quantify and compare water balance components over the course of a year for different Pinus taeda planting densities in an oxisol in southern Brazil. This experiment was conducted on 6-year-old trees in a clay oxisol at the Monte Alegre Farm, a property of the Klabin Company. The experimental design was a randomized block with four replicates and five treatments with different amounts of soil coverage: T100 (100% coverage - standard planting coverage); (T75, 75; T50, 50; and T25, 25%), and; T0 (without cover - clearcutting). The soil water storage and actual evapotranspiration under non-standard conditions were determined in a weekly estimated soil water balance (SWB) with measured components. By the end of the year, the treatments had not reached field capacity or wilting point storage. The average value of total downward drainage was 100.2 mm, and the highest values occurred in the T75 and T100 treatments. The lowest population density (T25) had the highest actual evapotranspiration (ETr), due to the growth of the remaining Pinus taeda trees. The highest evapotranspiration occurred in September, due to the resumption of Pinus taeda growth.
Keywords: exotic forest, spacing, hydric relations, soil water storage, hydric consumption.
Balanço hídrico do solo em diferentes densidades de
Pinus taeda
no Sul do Brasil
RESUMO. Teve-se por objetivo no presente trabalho quantificar e comparar as componentes do balanço hídrico em um Latossolo, ao longo de um ano, para diferentes densidades de plantio de Pinus taeda, em Telêmaco Borba, Paraná. O experimento foi instalado na Fazenda Monte Alegre, pertencente à Empresa Klabin, em um plantio com seis anos de idade, em Latossolo Vermelho A moderado de textura argilosa. O delineamento experimental foi em blocos ao acaso, com quatro repetições e cinco tratamentos, sendo: T100 (100% de cobertura – plantio padrão); T75 (75%); T50 (50%); T25 (25%); e T0 (sem cobertura - corte raso). O armazenamento da água no solo e evapotranspiração real da cultura foram determinados em um balanço hídrico do solo (BHS), calculado a partir de valores medidos de suas componentes, com periodicidade semanal. Em média, nenhum tratamento atingiu ao longo do ano os armazenamentos na capacidade de campo ou ponto de murcha permanente. O valor total médio da drenagem profunda foi de 100,2 mm ano-1, sendo que os maiores valores ocorreram nos tratamentos T100 e T75. A menor densidade
populacional (T25) proporcionou maior evapotranspiração real (ETr), devido ao crescimento das árvores de Pinus taeda remanescentes. A maior evapotranspiração ocorreu em setembro devido à retomada do crescimento do Pinus taeda.
Palavras-chave: floresta exótica, espaçamento, relações hídricas, armazenamento de água no solo, consumo hídrico.
Introduction
Forest cultivation depends on local water availability and has been identified as a practice that is capable of reducing soil water resources. However, this is contradicted by numerous authors who report a resulting improvement in soil water storage, a reduction in water losses by evaporation, a decrease in runoff, and soil aggregation that prevents erosion (Chow, 1964; Tundizi, 2000; Serengil et al., 2007; Van Dijk & Keenan, 2007). Pinus taeda has
The soil water balance (SWB) is defined as the inputs and outputs of water in a given control volume and time interval (Reichardt & Timm, 2004; Libardi, 2005). Monitoring of the soil water storage dynamics associated with crop water requirements is considered an essential tool for numerous agricultural activities and the efficient use of soil water resources (Frizzone, Andrade Júnior, Souza, & Zocoler, 2005; Souza & Gomes, 2007). Studies of the water requirements of exotic plantation forest plants, such as Pinus taeda, can assist in developing alternative approaches that use water efficiently without compromising environmental balance, and promote the expansion of forest cultivation. This study aimed to quantify and compare the components of the water balance for different Pinus
taeda planting densities in an oxisol, over the course
of a year in Telêmaco Borba, Paraná State, Southern Brazil.
Material and methods
This experiment was conducted at the Monte Alegre Farm, which belongs to the Klabin Company and is located in Telêmaco Borba, Paraná State, Brazil. The site has the coordinates 24° 13' 19" S, 50° 32' 33" W and an altitude of 700 m. Data were collected in 2009 in an area of 12.5 ha of 6-year-old
Pinus taeda trees in a clay oxisol with undulated relief
(Empresa Brasileira de Pesquisa Agropecuária [Embrapa], 2006). According to Köppen, the climate classification of the region is Cfa Cfb-1,
transitional humid subtropical to temperate, with the coldest average temperatures below 16°C with frosts, and the warmest average temperatures above 22°C, with hot summers (Caviglione, Kiihl, Caramori, & Oliveira, 2000).
The experimental design was a randomized block with four replicates. Each block was 3.125 ha and each treatment comprised 0.625 ha. The treatments consisted of water balances with different trees coverage: T100 (100% coverage - standard planting coverage; T75, 75; T50, 50; T25, 25% coverage); and T0 (without cover – clear cutting) (Figure 1).
Figure 1. Distribution of treatments in experimental area (12.5 ha) of Monte Alegre Farm in Telêmaco Borba, Paraná State.
Disturbed soil samples were taken weekly throughout 2009 (54 weeks) using a dutch auger. Two samples were collected from each treatment at depths 0-0.1; 0.1-0.2; 0.2-0.4; 0.4-0.6, and 0.6-1.0 m. The gravimetric water content was determined according Empresa Brasileira de Pesquisa Agropecuária (Embrapa, 1997), based on the average of the two moisture samples taken at each depth. During 2009, a total of 10,800 samples were collected to determine gravimetric moisture. Undisturbed samples were collected in October 2009 in two 1.5 x 3.0 x 1.8 m trenches, using soil cores at the same depths as the disturbed samples, with three replicates at each depth. Only two trenches were sampled because the area was homogeneous and commercial and because there were several other studies in the same experimental area (Rigatto, Dedecek, & Matos, 2004). The physical soil characteristics (bulk density, saturated soil hydraulic conductivity, and the soil water retention curve) were determined according to Embrapa (1997) (Table 1).
The SWB was estimated at weekly intervals, with a total of 52 in 2009. The calculations were carried out based on vertical flow only. Because the study area is relatively flat, the input and output runoffs were considered equal, and there was no irrigation in the area.
Table 1. Physical and hydraulic soil characteristics at different depths on Monte Alegre Farm, in Telêmaco Borba, Paraná.
Depth Sand Silt Clay C organic ρ(1) Macropores Micropores
α(2) K
0
(3)
(m) --- % --- (kg m-3) --- (m3 m-3) --- (mm day-1)
0.0-0.1 41 10 49 1.70 1100 a 0.200 a 0.395 c 0.598 a 15607.34 a 0.1-0.2 40 11 49 1.20 1210 a 0.137 ab 0.403 bc 0.541 a 4097.95 b 0.2-0.4 40 11 50 0.89 1210 a 0.140 ab 0.395 c 0.537 a 5651.00 ab 0.4-0.6 36 11 53 0.68 1230 a 0.080 b 0.462 a 0.542 a 957.20 b 0.6-1.0 36 11 53 0.45 1160 a 0.116 ab 0.443 ab 0.561 a 904.80 b CV (%)(4) - - - 5.8 6.0 24.8 3.5 4.0 71.2
(1)
Soil bulk density; (2)
Total porosity; (3)
Soil saturated hydraulic conductivity; (4)
Coefficient of variation. *
Water balance in different pine densities 267
Actual evapotranspiration under non-standard conditions (ETr) was calculated as follows as equation 1:
where:
ETr: actual evapotranspiration under non-standard conditions (mm period−1);
ΔS: soil-moisture storage variation in the root zone (mm period−1);
P: precipitation (mm period−1);
D: downward drainage out of the root zone (mm period−1);
U: upward capillary flow into the root zone (mm period−1).
The volumetric water content (θi) was obtained
by multiplication of gravimetric water content (ui)
by bulk density (ρi) of each soil i-th layer. Soil water
storage (S) was calculated using trapezoidal rule, with a ΔS obtained from the difference between previous (Sj) and current storage (Sj+1), according equation 2:
where:
Sj: soil water storage in j-th week year (mm); θi: volumetric moisture in i-th soil depth (cm3 cm-3);
zi: soil depth (mm);
j: weeks over year that samples were taken (52 weeks);
i: sample collection depths: 1: 0-0.1; 2: 0.1-0.2; 3: 0.2-0.4; 4: 0.4-0.6; and, 5: 0.6-1.0 mm.
Precipitation rates (P in mm day-1) were
measured with 60 acrylic gauges with 40 mm of water capacity installed within the experimental area. Two rain gauges were installed in each treatment 0.50 m from the edge of the trees, 1.30 m above the ground. A third rain gauge was placed at the midpoint between the rows of trees. The mean P
was calculated as the average of the three rain gauges.
Downward drainage (D) and upward capillary flow (U) into the root zone were estimated using the Darcy-Buckingham water flow equation. Unsaturated soil hydraulic conductivity K(θ) was estimated according to Mualem (1976) with regression parameters obtained from the model described in Van Genuchten (1980). Soil water retention values, for each depth, were obtained between -0.006 and -1.500 MPa with a pressure
plate apparatus (Richards, 1965) by desorbing the saturated cores at several pressure steps. The saturated cores were used to obtain water retention values over the entire range studied; i.e., under -0.006 MPa (pressure table) and -0.010 to -1.500 MPa (Richard's pressure chamber). Water content at each pressure was calculated from the volume of outflow between pressure steps, the final water content, and the weight of oven-dried soil. Volumetric water content and soil-water pressure potential, obtained for each depth, were adjusted as proposed by Van Genuchten (1980), using the Soil
Water Retention Curve program (Dourado Neto,
Nielsen, Hopmans, Reichardt, & Bachhi, 2001). Volumetric water content at field capacity (θfc)
and wilting point (θwp) were set at the -0.01 MPa and
-1.500 MPa pressure points, respectively. The field capacity (θfc) was considered to be constant when the
drainage rate was very slow. Total porosity (α) was considered equal to the volumetric water content at saturation (θs). Analysis of variance was carried out
with a Tukey's test, at 5% of probability, to compare differences in root-zone soil moisture storage.
Results and discussion
The study period was characterized by the occurrence of well-distributed precipitation, with atypical months compared to the historical averages in Telêmaco Borba, Paraná State, Brazil (Figure 2a). The precipitation (P) changed between treatments, but the water collected was not related to tree density.
Although P in January was above historical average, four months (July, September, October and December) had greater P than January. Historically, winter is the driest season of the year in the study region (Figure 1), but in 2009, it fairly rainy, especially during July. In fact, July’s monthly P was almost three times the historical average (82 mm). Additionally, the spring had higher P than the historical average. Conversely, summer and autumn had rainfalls lower than the historical average, by approximately 35 and 27%, respectively.
The T0 treatment had the highest annual P
(1,802 mm year-1) of all treatments. This result is
expected, as the absence of trees meant there was no interception of the rainfall by leaves and trunks. The treatment with the greatest number of trees, the T100 treatment, had a significantly lower annual P
(1,533 mm year-1). The T75, T50 and T25
treatments showed no significant difference (p = 0.05) in annual P.
and T50 (1,408.7 mm year−1) treatments, which had
higher water consumption than the T100 (1,225.5 mm year−1) and T75 (1,305.8 mm year−1)
treatments (Figure 2b). Similar results were reported by Van Dijk and Keenan (2007), who found greater evapotranspiration consumption in a pine forest after thinning. This finding is due to the increased growth of the remaining trees, especially the leaf area index (LAI), because of the greater light and space availability.
Figure 2. Main component of input and output of soil water for the treatments (T100 – 100; T75 – 75; T50 – 50; T25 – 25% coverage and; T0 – without cover), from January to December 2009, in Monte Alegre Farm, Telêmaco Borba, Paraná State: a) monthly precipitation (P); (b) monthly actual evapotranspiration under non-standard conditions (ETr), and; c) monthly average comparison between P and ETr.
*
Climatological normal observed between the period 1947 to 2005 for the same region (Nunes, Batista, Soares, Fier, & Santos, 2009).
In at least 6 months of 2009, the T0 treatment had the highest ETr, which is theoretically impossible because there are no plants in the treatment. Weeding was conducted in the T0 treatment area to prevent plant growth. Therefore, one possible explanation of this result is that the high ETr occurred because the trunks and roots were not removed from experimental area. Thus, the addlement roots may have formed infiltration pores and channels, causing runoff out of the experimental control volume. The portion of the water that was precipitated could not be computed as D with the Darcy-Buckingham equation because
it was not stored in the soil of the experimental volume control, so it was computed as ETr at SWB. However, this hypothesis needs further study to be verified.
The average ETr across all treatments was 1,388 mm year−1, or 3.8 mm day−1. Studies
conducted with Pinus taeda in United States (Lu, Sun, Amatya, & Mcnulty, 2003; Ford, Hubbard, Kloeppel, & Vose, 2007), in a similar climate, reported values of a similar magnitude to those found in this study.
According Carneiro et al. (2008), stomatal conductance and leaf water potential decrease when the soil water content and transpiration rate are reduced. Under conditions of high soil water availability and liquid radiation, stomatal closure does not occur, and the plant regulates water availability itself. This may explain the increase in monthly ETr with higher P (Figure 2c). Trinidad, Hernández, Orozco and Upton (2002) reported that
Pinus taeda species have high transpiration rates
when the soil moisture is close to field capacity. Higher water consumption also occurred in September, likely as a result of resumed Pinus
growth.
In the analysis, the T0 and T25 treatments showed the highest and lowest soil water storage (S), respectively. The T100, T75, and T50 treatments were intermediate (Table 2). Interestingly, contrary to expectations, decreasing the number of trees per area did not promote greater
S (Table 2 and Figure 3a). Similar results were obtained by Van Dijk and Keenan (2007), who found a decrease in soil water storage after thinning a forest. According to the same authors, the growth of the remaining trees, especially with respect to Leaf Area Index (LAI), increased with the increased availability of light and space among the trees.
Table 2. Statistical analysis of average monthly soil water storage with different densities of Pinus taeda (T100 – 100; T75 – 75; T50 – 50; T25 – 25% coverage and; T0 – without cover), over 2009, in Monte Alegre Farm, Telêmaco Borba, Paraná State.
Treatments Average monthly soil water storage (mm)*
T100 336,6 bc
T75 337,0 bc
T50 328,6 bc
T25 326,4 c
T0 349,5 a
F Value 11,23**
*Means followed by same letter do not differ by Tukey test (p < 0.05); **p < 0.01.
Water balance in different pine densities 269
than the T100, T75, T50, and T25 treatments, respectively. However, from March to May, the T0 treatment had an average soil water storage that was 3.2; 3.7; 2.9, and 1.7% lower than T100, T75, T50, and T25 treatments, respectively (Figure 3a).
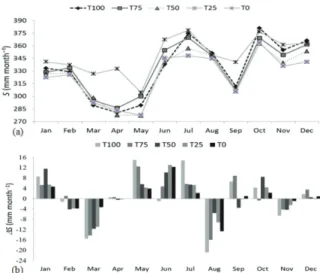
Figure 3. Soil water storage (S) from January to December of 2009, in Monte Alegre Farm, Telêmaco Borba, Paraná State:
a) Average monthly; and b) soil water storage variation (ΔS) with different densities of Pinus taeda (T100 – 100; T75 – 75; T50 – 50; T25 – 25% coverage and; T0 – without cover).
The average depth of stored water for the T100, T75, T50, T25, and T0 treatments was approximately 425.3 and 205.0 mm, respectively, considering the volumetric water content at field capacity and wilting point. In samples collected weekly over the year, none of treatments reached this S (Figure 3a). Based on S values during the monitored period, the Pinus taeda did not use the water that was retained in soil at tension lower than -1.5 MPa. However, Myers and Talsma (1992) concluded that Pinus radiata managed to remove water from soil retained at even higher tension. Thus, the available soil water did not limit Pinus
development in the study period.
Among treatments, the average S in the T0 treatment (in July) was 13.51% lower than the S at field capacity. With absence of vegetation cover (clearcut - T0), it is clear that the S varied in same proportion as P (contrast between Figures 1 and 2a). The highest water storage value in year occurred in April for other treatments, on average 32.7% below field capacity storage (Figure 3a). The S in the T100, T75, T50, and T25 treatments showed the same trends over the year; S decreased gradually from June until December. From September to December, plants had higher water consumption, resulted in higher ETr.
The average ΔS values in January, May, June, July, September, October, and December were 7.1; 8.3; 7.9; 6.7; 2.6; 3.8, and 1.4 mm, respectively; and in February, March, April, August, and November were -2.4; -11.1; -0.1; -12.8, and -3.7 mm, respectively (Figure 3b). The ΔS in the soil profile for all treatments followed the same trends as P, which agrees with Antonino, Sampaio, Dall’olio and Salcedo (2000) and Lima, Antonino, Soares, Souza and Lira (2006).
In January, May, July, and December, water was entering the soil in all treatments. However, because
S remained high during this period, only the T75 treatment reflected the water entering the soil in February. Over the course of the year, the T50 (12 mm year−1) and T25 (5 mm year-1) treatments
had the highest and lowest recorded amount of water entering the soil, respectively. The average drainage (D) was highest in July (16.8 mm month-1),
followed by October (16.7 mm month-1), and
December (14.3 mm month-1). The total annual
drainage was 100.2 mm year-1, on average (Figure 4).
Cruz, Libardi, Carvalho and Rocha (2005) found an average D of 72.4 mm year-1 for citrus in red oxisol
in Piracicaba, São Paulo State, Brazil. Azevedo, Silva and Silva (2003) found an average D of 99.5 mm year-1 in oxisol cultivated with mango in
the Petrolina, Pernambuco State, Brazil.
Figure 4. Downward drainage (D) estimated using the Darcy-Buckingham equation, with different densities of Pinus taeda
(T100 – 100; T75 – 75; T50 – 50; T25 – 25% coverage and; T0 – without cover), from January to December of 2009, in Monte Alegre Farm, Telêmaco Borba, Paraná State.
The highest P values (Table 2), with D of 16.8, 16.7, 14.3 and 6.7 mm month-1, occurred in July,
September, October, and December, respectively (Figure 3). These values are considered high for to soil type in the region; oxisols are characterized by high infiltration capacity and are naturally well drained (Embrapa, 2006). The T75 treatment had the highest annual D (166.8 mm year-1), followed by
the T100 (160.3 mm year-1) and T0
(116.3 mm year-1) treatments. The T25 and T50
treatments had the lowest annual D: 9.6 and 47.9 mm year-1, respectively. The T50 and T25
water consumption. With increasing light availability and space between trees, there was greater tree growth and an increase in tree canopy diameter. The T0 treatment (without cover - clearcutting) had the highest D value, possibly because it had greater amounts of water entering the soil (15% more than other treatments). In the absence of trees, there was no P interception by leaves and trunks. Consequently, the T0 treatment had the highest annual ETr (1,542.4 mm year-1) (Figure 2c).
Conclusion
In 2009, the treatments did not reached field capacity and wilting point storages. The average total downward drainage was 100.2 mm, and the highest values occurred in the T75 and T100 treatments. The lowest population density treatment (T25) had the greatest ETr,due to greater Pinus taeda growth. The highest evapotranspiration occurred in September, as a result of resumed Pinus taeda
growth.
References
Antonino, A. C. D., Sampaio, E. V. S. B., Dall’olio, A., & Salcedo, I. H. (2000). Balanço hídrico em solo com cultivos de subsistência no semiárido do nordeste do Brasil. Revista Brasileira de Engenharia Agrícola e Ambiental, 4(1), 29-34. doi: 10.1590/S1415-43662000000100006
Azevedo, P. V., Silva, B. B., & Silva, V. P. R. (2003). Water requirements of irrigated mango orchards in northeast Brazil. Agricultural Water Management, 58(3), 241-254. doi: 10.1016/S0378-3774(02)00083-5
Carneiro, R. L. C., Ribeiro, A., Huaman, C. A. M. Y., Leite, F. P., Sediyama, G. C., & Neves, J. C. L. (2008). Consumo de água em plantios de eucalipto: parte 2 modelagem da resistência estomática e estimativa da transpiração em tratamentos irrigados e não‑irrigados. Árvore, 32(1), 11‑18. doi: 10.1590/S0100-67622008000 100002
Caviglione, J. H., Kiihl, L. R. B., Caramori, P. H., & Oliveira, D. (2000). Cartas climáticas do Paraná. Londrina, PR: Iapar. Retrevied from http://www.iapar.br/modules/conteudo/conteudo.php? conteudo=677
Chow, V. T. (1964). Handbook of applied hydrology: a compendium of water-resources technology. New York City, NY: McGraw-Hill Book Company.
Cruz, A. C. R., Libardi, P. L., Carvalho, L. A., & Rocha, G. C. (2005). Balanço de água no volume de solo explorado pelo sistema radicular de uma planta de citros. Revista Brasileira de Ciência do Solo, 29(1), 1-10. doi: 10.1590/S0100-06832005000100001
Dourado Neto, D., Nielsen, D. R., Hopmans, J. W., Reichardt, K., & Bachhi, O. O. S. (2001). Software to
model soil water retention curves. SWRC, version 2.00. Scientia Agricola, 57(1), 191-192.
Empresa Brasileira de Pesquisa Agropecuária (1997). Manual de métodos de análise de solo. Rio de Janeiro, RJ: SNLCS.
Empresa Brasileira de Pesquisa Agropecuária (2006). Sistema brasileiro de classificação de solos. Rio de Janeiro, RJ: Embrapa.
Ford, C. R., Hubbard, R. M., Kloeppel, B. D., & Vose, J. M. (2007). A comparison of sap flux based evapotranspiration estimates with catchment-scale water balance. Agricultural and Forest Meteorology, 145 (3-4), 176-185. doi: 10.1016/j.agrformet.2007.04.010 Frizzone, J. A., Andrade Júnior, A. S., Souza, J. L. M., &
Zocoler, J. L. (2005). Planejamento da irrigação: análise de decisão de investimento. Brasília, DF: Embrapa.
Leite, H. G., Nogueira, G. S., & Moreira, A. M. (2006). Efeito do espaçamento e da idade sobre variáveis de povoamentos de Pinus taeda L. Árvore, 30(4), 603-612. Libardi, P. L. (2005). Dinâmica da água no solo. São Paulo,
SP: USP.
Lima, J. R. S., Antonino, A. C. D., Soares, W. A., Souza, E. S., & Lira, C. A. B. (2006). Balanço hídrico no solo cultivado com feijão caupi. Revista Brasileira de Ciências Agrárias, 1(1), 89-95.
Lu, J., Sun, G., Amatya, D. M., & Mcnulty, S. G. (2003). Modeling actual evapotranspiration from forested watersheds across the Southeastern United States. Journal of American Water Resources Association, 39(4), 887-896. doi: 10.1111/j.1752-1688.2003.tb04413.x Mualem, Y. (1976). A new model for predicting the
hydraulic conductivity of unsaturated porous media. Water Resources Research, 12(3), 513-522. doi: 10.1029/ WR012i003p00513
Myers, B. J., & Talsma, T. (1992). Site water balance and tree water status in irrigated and fertilized stands of Pinus radiata. Forest Ecology and Management, 52(1-4), 17-42. doi: 10.1016/0378-1127(92)90494-T
Nunes, J. S. N., Batista, A. C., Soares, R. V., Fier, I. S. N., & Santos, C. C. (2009). Climatologia do comportamento da precipitação no distrito florestal de Monte Alegre, PR, Brasil. Floresta, 39(4), 783-792. doi: 10.5380/rf.v39i4.16313
Reichardt, K., & Timm, L. C. (2004). Solo, planta e atmosfera: conceitos, processos e aplicações. Barueri, SP: Manole.
Richards, L. A. (1965). Physical conditions of water in soil. In Black, C. A., Evans, D. D., White, J. L., Ensminge, L. E., & Clark, F. E. (Orgs.), Methods of soil analysis: physical and mineralogical properties, including statistics of measurements and sampling (p. 128-152). Madison, WI: ASA-SSSA.
Rigatto, P. A., Dedecek, R. A., & Matos, J. L. M. (2004). Influência dos atributos do solo sobre a qualidade da madeira de pinus taeda para produção de celulose kraft. Árvore, 28(2), 267-273. doi: 10.1590/S0100-676220040 00200013
Water balance in different pine densities 271
Hydrological impacts of a slight thinning treatment in a deciduous forest ecosystem in Turkey. Journal of Hidrology, 333(2-4), 569-577. doi:10.1016/j.jhydrol. 2006.10.017
Souza, J. L. M., & Gomes, S. (2007). Avaliação e desempenho das equações de estimativa do armazenamento de água no solo em um balanço hídrico climatológico decendial irrigacionista. Acta Scientiarum. Agronomy, 29(4), 433-446. doi: 10.4025/actasciagron. v29i4.383
Trinidad, T. M., Hernández, J. V., Orozco, A. M., & Upton, J. L. (2002). Respuesta al déficit hídrico en Pinus leiophylla: consumo de agua y crecimento en plântulas de diferentes poblaciones. Agrociencia, 36(3), 365-376.
Tundisi, J. G. (2000). Limnologia e gerenciamento integrado de recursos hídricos. Ciência e Ambiente, 21(1), 9-20.
Van Dijk, A. I. J. M., & Keenan. R. J. (2007). Planted forests and water in perspective. Forest Ecology and Management, 251(1-2), 1-9. doi: 10.1016/j.foreco. 2007.06.010
Van Genuchten, M. T. (1980). A closed-form equation for predicting the hydraulic conductivity of unsaturated soil. Soil Science Society of America Journal, 44(5), 892-898. doi: 10.2136/sssaj1980.03615995004400050002x
Received on February 12, 2015. Accepted on July 24, 2015.
License information: This is an open-access article distributed under the terms of the Creative Commons Attribution License, which permits unrestricted use, distribution, and reproduction in any medium, provided the original work is properly cited.