Soil and Plant Nutrition |
Article
Spectral behavior of some modal soil profiles from
São Paulo State, Brazil
José Alexandre Melo Demattê (1); Fabrício da Silva Terra (1*); Carlos Fernando Quartaroli (2)
(1) Universidade de São Paulo (USP), Escola Superior de Agricultura “Luiz de Queiroz” (ESALQ), Departamento de Ciência do Solo
(LSO), Caixa Postal 9, 13418-900 Piracicaba (SP), Brasil.
(2) Embrapa Monitoramento por Satélite, Av. Soldado Passarinho, 303, Fazenda Chapadão, 13070-115 Campinas (SP), Brasil.
(*) Corresponding author: [email protected]
Received: Jan. 10, 2012; Accepted: Sep. 5, 2012
Abstract
Remote sensing has a high potential for environmental evaluation. However, a necessity exists for a better understanding of the relations between the soil attributes and spectral data. The objective of this work was to analyze the spectral behavior of some
soil profiles from the region of Piracicaba, São Paulo State, using a laboratory spectroradiometer (400 to 2500 nm). The rela
-tions between the reflected electromagnetic energy and the soil physical, chemical and mineralogical attributes were analyzed, verifying the spectral variations of soil samples in depth along the profiles with their classification and discrimination. Sandy soil reflected more, presenting a spectral curve with an ascendant form, opposite to clayey soils. The 1900 nm band discriminated soil with 2:1 mineralogy from the 1:1 and oxidic soils. It was possible to detect the presence of kaolinite, gibbsite, hematite and goethite in the soils through the descriptive aspects of curves, absorption features and reflectance intensity. A relation exists between the weathering stage and spectral data. The evaluation of the superficial and subsuperficial horizon samples allowed characterizing and discriminating the analytical variability of the profile, helping to soil distinguishing and classification.
Key words: soil reflectance, soil attributes, soil classification.
Comportamento espectral de alguns perfis modais de solos do Estado de São Paulo, Brasil
ResumoO sensoriamento remoto representa um importante potencial na avaliação do ambiente, contudo, ainda existe a necessidade
de entender melhor as relações entre atributos do solo e dados espectrais. O objetivo do trabalho foi analisar descritivamente
o comportamento espectral de alguns perfis de solos da região de Piracicaba, Estado de São Paulo, utilizando o espectrorra
-diômetro de laboratório (400 a 2500 nm). Procurou-se ainda, avaliar as relações entre energia eletromagnética refletida com atributos químicos, físicos e mineralógicos dos solos, verificando as variações espectrais das amostras ao longo dos perfis e suas relações com classificação e discriminação dos solos. Observou-se que solos mais arenosos refletiram mais, com curvas espectrais de aspecto ascendente, ao contrário dos solos argilosos. A banda centrada em 1900 nm discriminou solos com mineralogia 2:1 dos de 1:1 e oxídicos. Foi possível detectar a presença de caulinita, gibbsita e dos óxidos de ferro (hematita e goethita) presentes nos solos pelos aspectos descritivos das curvas, feições de absorção e intensidade de reflectância; e que existe uma relação entre níveis de intemperismo e informações espectrais. A avaliação dos dados espectrais de amostras dos horizontes superficiais e subsuperficiais permitiu caracterizar e discernir a variabilidade analítica do perfil, auxiliando na discriminação e classificação dos solos.
Palavras-chave: reflectância do solo, atributos do solo, classificação do solo.
1. INTRODUCTION
The soil spectral behavior is determined by the cu-mulative property resulting from the intrinsic spectral behavior of the heterogenic combinations of mineral and organic material and their humidity (Stoner and Baumgardner, 1981). Thus, by examining the spectral reflectance, it is possible to obtain valuable informa-tion about the physical and chemical attributes of the soils. The possibility to identify the spectral variations, normally linked to specific absorption phenomena,
makes the reflectance spectroscopy an important tool in the study of soil composition in the laboratory, field or through satellite images (Madeira Netto, 1996; Demattê et al., 2004).
relevant (Sorensen and Dalsgaard, 2005; Cozzolino and Morón, 2006; Viscarra Rossel et al., 2006).
On the other hand, it is important to move ahead in the studies of spectral behavior of soil attributes that contribute to the development of more accurate and rapid techniques that enable mapping of the spatial variability of soils in extensive areas. The study of soil attributes through remote sensing can assist in soil survey and map-ping techniques, as well as prediction of the erosion and a more accurate fertilizing management practices (Shepard and Walsh, 2002; Odlare et al., 2005).
The hypothesis of this study is based on the inter-action between electromagnetic energy with organic and inorganic components of the soil, which amounts, compositions and distinct structures form different re-flectance curves, permitting its detection and discrimi-nation. So, the objective of this study is to analyze the relation between the reflected energy and the physical, chemical and mineralogical attributes of the soils from the region of Piracicaba, São Paulo State, further to de-termine the spectral variations of the soil samples along a profile and a toposequence, as well as to evaluate the potential of the descriptive spectral analyses in the dis-crimination of these soils.
2. MATERIAL AND METHODS
Description of the study area
The study area is localized in the municipality of Rafard, region of Piracicaba, State of São Paulo, between the latitudes 22°58’56” S and 23°00’33” S and longitudes 47°37’55” W and 47°39’32” W, comprising an area of approximately 198 acres bordering the Capivari river, with altitudes varying between 475 and 567 meters. The climate is of Cwa-type, according to the Köppen classification.
The region is located in the geotectonic unit called Parana Basin and the physiographic unit called Paulista pe-ripheral depression. The regional geology is dominated by the Itararé Formation, dated as the Upper Carboniferous to Mid Permian, which manifests as a complex association of different detritic lithofacies that succeed one another vertically and horizontally. The predominant lithologies are heterogenically granulated sandstones, mineralogically immature, that transform into feldspathic sandstones. The formation also contains diamictite with clasts of various li-thologies, forms and dimensions; rhythmic sediments, gen-erally referred to as varvite; conglomerates and conglomeratic sandstones; siltstones, argellites and shales. There are further occurrences of basic eruptive rocks (diabase) that form intru-sive bodies of dykes and sills with the same composition as the tholeiitic basalts in the Serra Geral Formation from the Jurassic-Cretaceous (Almeida and Melo, 1981).
Location of the profiles
The choice of the sampling sites in the relief was based on observations and studies of the planialtimetric maps, aerial photographs and field observations. A digital eleva-tion model (DEM) was made that permitted a general view of the landscape, which facilitated marking out the points. The model was made from the contour lines that were digitalized from the topographic maps and simpli-fied by Douglas-Peucker´s algorithm with an isoline and breakline tolerance of 2 meters. The triangular irregular network (TIN) was chosen, using Delaney´s modified tri-angulation as criteria, which gave a more authentic repre-sentation of the terrain, avoiding smoothening of features such as valleys and ridges.
Soil analyses
A morphological description of the seventeen soil profiles from the different locations in the landscape was made. The positions of the profiles were georeferenced with a GPS (Global Positioning System) with post-processing differential correction of the data.
The soil samples were collected and separated from each horizon or layer detected in the morphological de-scription. The sampling depths varied between 0–20 cm for the superficial horizons and 40–60 cm for the subsu-perficial horizons. The samples were dried under forced air in a temperature of 45 ºC for 48 hours, then weighed, crushed and sieved. Fractions smaller than 2 mm were separated in sub-samples and subjected to granulomet-ric, chemical, mineralogical and radiometric analyses. Fractions above 2 mm were washed in running water and separated through 20 mm sieves for determination of the amount of pebbles and gravel.
The soil colors were determined in the laboratory through a Minolta CR300 colorimeter, programmed for readings according to the Munsell system. Mottle colors and variegated horizons were evaluated in the field using Munsell color chart.
The chemical analyses were done using the method of Camargo et al. (1996), comprising of pH determination in water, KCl 1N and CaCl2; determination of exchange-able bases (Ca++, Mg++, K+); sum of bases (SB); cation
ex-change capacity (CEC); exex-changeable aluminum (Al3+);
base saturation percentage; aluminum saturation percent-age; potential acidity (H+ + Al3+); assimilable phosphorus;
organic matter and organic carbon; amounts of Fe2O3, SiO2 and Al2O3 through sulfuric acid attack and further calculation of the Ki index.
agents. The sand was separated into five fractions: very coarse sand (2–1 mm), coarse sand (1–0.5 mm), medium sand (0.5–0.25 mm), fine sand (0.25–0.1 mm), and very fine sand (0.1–0.05 mm). The textural classification was done according to the soil texture triangle of the United States Department of Agriculture (USDA).
The mineralogical analyses of the silt and clay frac-tions were done using the method demonstrated by Moore and Reynolds (1997), in which the crystal-lographic properties are analyzed through the powder method, without chemical treatment at 25 °C. The sam-ples were X-rayed with Philips equipment. A file contain-ing information regardcontain-ing the difratometry was produced for each sample. These files were then compared with ex-isting X-ray diffraction patterns in a database. After the identification, the presence or absence of certain minerals was determined for each sample.
The soils were classified according to the Soil Taxonomy (Soil Survey Staff, 2010) and Brazilian Soil Classification System (EMBRAPA, 2006).
Spectral data acquisition
The spectral data was obtained through the Infra-Red Intelligent Spectroradiometer – IRIS with resolution of 2 nm in the range of 400 to 1,000 nm and 4 nm between 1,000 and 2,500 nm. The samples were placed in Petri dishes with 9 cm diameter and 1.5 cm height and distributed so that the surface became as smooth as possible. The geometry for the data acquisition followed the procedures set by Demattê and Garcia (1999). A white dish with 100% reflectance was used as absolute reference. Three readings were done for each sample, turning the Petri dish 120° for each reading so that all the points of the sample were covered.
The ratio between the spectral radiant flux reflected by the sample surface and the flux reflected by the refer-ence dish under the same geometric conditions resulted in the bidirectional reflectance factor. The spectral radiant flux used in the calculation of the reflectance factor was determined by the arithmetic mean of the three readings.
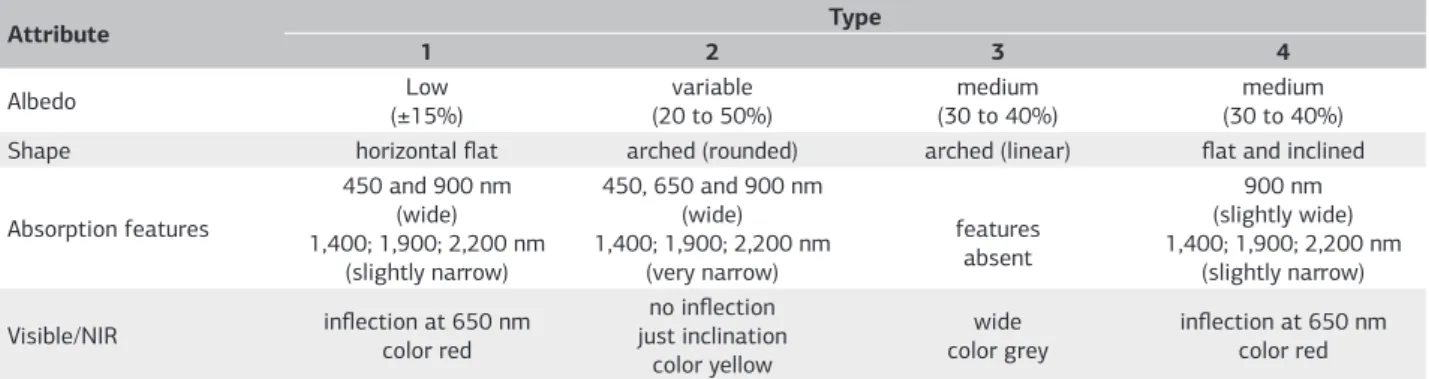
All spectral data were passed through a filtering sys-tem to eliminate the syssys-tematic noise from the device and were shown in graphs were the reflectance factor was plotted against the wavelength resulting in the spectral curves. For subsequent comparisons, these curves were clustered according to the methodology of Formaggio et al. (1996), where four soil spectra standards were identi-fied depending on the shape of the curve and the intensity of the influence of the following parameters: amount of iron oxide, amount of organic matter and parent material (Table 1 and Figure 1).
3. RESULTS AND DISCUSSION
Characterization of the main studied soils
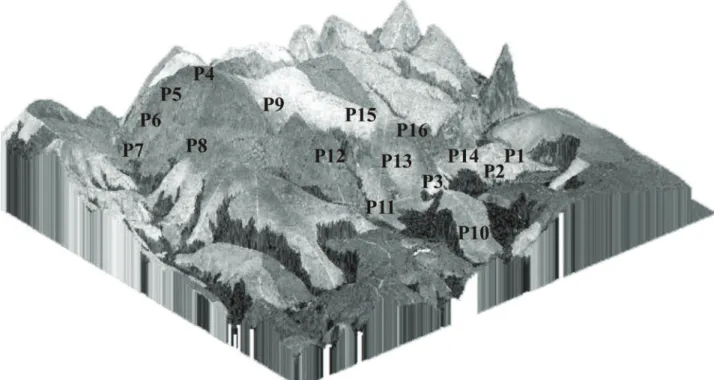
The distribution of the soil profiles in the landscape can be observed in the digital elevation model (Figure 2). The data of the chemical and physical analyses, as well as the soil clas-sification of the seventeen profiles, are presented in table 2.
The Typic Hydraquent (Gleissolo Háplico Ta Distrófico típico – GXvd) (Profile 1), moderately deep soil, is found in the slightly flat (5% slope) relief region in the lowlands (Figure 2), with sandstone as parent mate-rial and constantly suffering the influence of the ground water table. Gleyzation could be seen from the Bg hori-zon, indicating low permeability. Chemically, this profile is dystrophic, however, there is clay that consists of 2:1 minerals as well, bearing in mind the high ki results of 3.43 (Table 2).
The physical results for Profile 2 show an elevated tex-tural contrast between the superficial and subsuperficial horizons, with the clay content increasing from 100 g kg-1
to 220 g kg-1, showing evidence of an abruptic character
(Table 2). The chemical results showed a base saturation below 30%; on the other hand, the aluminum satura-tion was extremely high, allowing the soil to be classi-fied as Typic Haploxerult (Argissolo Vermelho-Amarelo Ta Distrófico abrúptico – PVAvd). The CEC character-izes a colloidal complex of high activity with evidence of
Table 1. Characteristics of the four standards of spectral curves
Attribute Type
1 2 3 4
Albedo Low
(±15%)
variable (20 to 50%)
medium (30 to 40%)
medium (30 to 40%)
Shape horizontal flat arched (rounded) arched (linear) flat and inclined
Absorption features
450 and 900 nm (wide) 1,400; 1,900; 2,200 nm
(slightly narrow)
450, 650 and 900 nm (wide) 1,400; 1,900; 2,200 nm
(very narrow)
features absent
900 nm (slightly wide) 1,400; 1,900; 2,200 nm
(slightly narrow)
Visible/NIR inflection at 650 nm color red no inflection just inclination color yellow wide color grey
inflection at 650 nm color red
a mixed mineralogy. As this soil is moderately deep, the degree of weathering is not so pronounced, as could be seen from the ki index values above 2.4.
It was observed in the slope regions the presence of deep soils that converge into shallow and stony soils, which is the case of Lithic Dystrustept (Cambissolo Háplico Ta Eutrófico típico – CXve) (Profile 3) (Figure 2) which data indicate a small textural gradient (Table 2). The presence of small fragments of parent material, shales in this case – confirmed by the silt content – is common in the mass of the incipient B horizon. It is characterized by an elevated base saturation in both horizons and high activity clay. Due to the high ki value (5.24) in the B horizon, it can be inferred that the 2:1 mineralogy is predominant. This is the least weathered soil of all.
The Profile 4 (Kandiudalfic Eutrudox/Nitossolo Vermelho Eutroférrico latossólico – NVef) is a deep soil,
well drained and situated on a flat area on the top of a slope (Figure 2). The texture varies from clay to heavy clay. It shows high fertility, with base saturation above 65%. The ki index in the subsuperficial horizon is below 2.0, which characterizes a soil with low activity clay, as confirmed by CEC values (Table 2). The mineralogy is mainly constituted by kaolinite and iron oxides, which is reflected by the Fe2O3 content and the parent material represented by basic rocks.
The Profile 9 (Lithic Udipsamment/Neossolo Regolítico Distrófico típico – RRd), with sandstone as parent material, has a massive aspect in depth with the two first horizons of sandy texture. The chemical results indicate a low base satu-ration and ki indexes close to 2.0 (Table 2).
Similar to the fourth profile, even with respect to the elevated values of base saturation, total iron content and ki index, the Profile 16 was classified as Kandiudalfic Eutrudox (Nitossolo Vermelho Eutrófico latossólico – NVe).
The morphological characteristics of Typic Haploxerult (Argissolo Amarelo Eutrófico abrúptico – PAe) (Profile 17) indicate a deep soil with moderate drainage occurring in an undulating relief (Figure 1). The horizon of the sub-surface shows an accentuated textural gradient characterizing a Bt with high base saturation, thus eutrophic, with low activity clay and a ki around 1.8, indicating a mixed mineralogy with kaolinite and oxides (Table 2).
Soil spectral reflectance
The Typic Hydraquent (GXvd) in profile 1 shows typical spectral curves of soils with high sand content, given by the high reflectance intensity around 0.6 (Figure 3a). As the reflectance is high for quartz and low for organic mat-ter, removal of the organic matter exposes more quartz, which results in an increase of the reflectance intensity. A weak concavity in the absorption feature at 850 nm in both horizons, associated with the bright colors indi-cate the lowest presence of iron oxides, such as hematite (Fontes and Carvalho, 2005), as confirmed by the analyses. The low iron contents produce higher reflec-tance intensities (Demattê et al., 2003). With respect to the curves determined by Formaggio et al. (1996), all the soil sample curves along the profile resemble type 2 (Table 1 and Figure 2). However, they are different when their shapes are analyzed in detail. The curve regarding the superficial layer shows a positive tendency, while the subsuperficial curve has a flat tendency (Figure 3a). Such curves show a slightly straight shape, with a small concav-ity in the 700 nm range.
The Typic Haploxerult (PVAvd) from the second profile, developed over stratified sandstones, shows a similar spectral curve behavior in all subsuperficial lay-ers, with high reflectance intensity, especially in hori-zon CR1 with 73%, and strong absorption features at Figure 1. Types of soil spectral behavior according to
Figure 2. Distribution of the soil profiles in the study area using digital elevation model (DEM).
1,400 and 1,900 nm (Figure 3b) attributed to the OH – in the soil hygroscopic water (Ben-Dor et al., 2002) and the presence of 2:1 minerals, confirmed by the high ki value (Demattê et al., 2004), and at 2,200 nm, caused by the OH– groups of the clay minerals. The weak features in the range between 800 and 1,050 nm are caused by the low concentrations of iron oxides (Vitorello and Galvão, 1996). In the Ap horizon there is influence of organic matter with resulting reduction of albedo and smoothening of the absorption features (Demattê and Garcia, 1999). In the superficial layer, the soil from Profile 2 shows a type 2 spectral curve, however, in the subsurface layer one can detect differ-ences that alter the classification into type 4 (Table 1 and Figure 1), characterized by strong absorption fea-tures. This confirms the preliminary observations by Demattê et al. (2004) where the curve types separated soil samples from the surface and subsurface layers.
The Lithic Dystrustept (CXve) is the only profile de-veloped over shale with a solum that has a coarser tex-ture of sandy loam natex-ture. The evaluation of the spectral curves showed that the least weathered material gave type 2 curves (Table 1 and Figure 1), with intensive absorption features and patterns similar to those of sandstones and siltstones (Figure 3c). In the Bi and Ap horizons these features are masked by the effect of organic matter. The highest reflectance intensity, around 75%, was found in layer R, followed by the CR and C horizons, with wave-lengths smaller than 1,900 nm. The samples’ yellowish color is confirmed by the absorption features that are
characteristic of the goethite, with narrow bands between 450 and 600 nm and slight concavity between 600 and 750 nm (Scheinost and Schwertmann, 1999).
Soils that are rich in hematite show a wider concavity between 400 and 600 nm (Sherman and Waite, 1985), as well as lower reflectance intensity when compared to goethite (Kosmas at al., 1984). This can be observed in Profile 4 (Kandiudalfic Eutrudox / NVef) (Figure 3d). Besides, all horizons show a strong concavity at 850 nm, corroborating the results found by Vitorello and Galvão (1996) and Demattê et al. (2001). The presence of 1:1 minerals, such as kaolinite, can be observed through the typical feature (step) at 2200 nm (Hauff et al., 1990), later confirmed by Demattê and Garcia (1999). The curves of this profile could be associated with standard type 1 (Table 1 and Figure 1), related to soils derived from basic eruptive rocks, normally heavy clayey with high val-ues of total iron.
Table 2. Results of the chemical and physical analyses of the soil samples: organic matter (O.M; sum of bases (SB); cation exchange capacity (CEC); base saturation (V); aluminum saturation (m); and the molar relationship SiO2/Al2O3 (Ki)
Horizons
pH Granulometry (g kg-1)
CaCl2 O.M Ca2+ Mg2+ SB CEC V m Sand Silt Clay Fe
2O3
(1) Ki
g kg-1 mmol
c kg
-1 % g kg-1
Profile 1 – Typic Hydraquent / Gleissolo Háplico Ta Distrófico típico (GXvd)
A 5.80 10.00 25.00 13.00 40.00 51.00 78.00 0.00 800.00 120.00 80.00 8.30 3.73
Bg 4.90 10.00 10.00 4.00 14.80 46.80 32.00 0.00 660.00 200.00 140.00 11.50 3.43
Profile 2 – Typic Haploxerult / Argissolo Vermelho-Amarelo Ta Distrófico abrúptico (PVAvd)
A 4.70 10.00 6.00 3.00 11.00 37.00 30.00 21.00 840.00 60.00 100.00 2.70 3.27
Bt 3.80 10.00 5.00 2.00 8.30 75.30 11.00 85.00 710.00 70.00 220.00 10.90 2.43
Profile 3 – Lithic Dystrustept / Cambissolo Háplico Ta Eutrófico típico (CXve)
A 5.40 15.00 28.00 14.00 43.30 64.30 67.00 0.00 560.00 300.00 140.00 9.70 2.32
Bi 5.40 10.00 23.00 7.00 30.40 58.40 52.00 0.00 620.00 220.00 160.00 11.00 5.24
Profile 4 – Kandiudalfic Eutrudox / Nitossolo Vermelho Eutroférrico latossólico (NVef)
A 6.40 29.00 115.00 29.00 147.70 160.70 92.00 0.00 200.00 160.00 640.00 218.00 2.06
Bn 6.20 10.00 38.00 9.00 47.30 68.30 69.00 0.00 210.00 100.00 690.00 235.20 1.97
Perfil 5 – Typic Hapludoll / Chernossolo Háplico Órtico típico (MXo)
A 5.40 17.00 130.00 34.00 165.80 187.80 88.00 0.00 310.00 250.00 440.00 182.40 2.82
Bi 6.10 8.00 84.00 24.00 108.60 134.60 81.00 0.00 510.00 240.00 250.00 154.80 2.95
Profile 6 – Lithic Eutrudept / Cambissolo Háplico Eutroférrico léptico (CXef)
A 5.50 22.00 52.00 21.00 74.80 115.80 65.00 0.00 250.00 170.00 580.00 204.10 2.30
Bi 5.10 10.00 43.00 25.00 68.80 100.80 68.00 0.00 160.00 150.00 690.00 180.20 2.15
Profile 7 – Lithic Udorthent / Neossolo Litólico Distrófico típico (RLd)
A 3.90 4.00 3.00 12.00 16.90 77.90 22.00 72.00 260.00 470.00 270.00 39.50 3.60
Cr 4.50 10.00 5.00 9.00 16.80 71.80 23.00 68.00 270.00 460.00 270.00 44.60 2.89
Profile 8 – Lithic Dystrustept / Cambissolo Háplico Tb Distrófico léptico (CXbd)
A 5.30 29.00 39.00 16.00 57.80 99.80 58.00 0.00 360.00 210.00 430.00 108.00 2.91
Bi 4.90 15.00 19.00 11.00 31.20 75.20 41.00 6.00 380.00 170.00 450.00 115.50 1.91
Profile 9 – Lithic Udipsamment / Neossolo Regolítico Distrófico típico (RRd)
A 4.50 13.00 5.00 2.00 7.60 37.60 20.00 28.00 640.00 240.00 120.00 8.80 2.17
C 4.40 13.00 16.00 3.00 19.80 63.80 31.00 31.00 580.00 160.00 260.00 26.10 2.09
Profile 10 – Inceptic Hapludox / Latossolo Vermelho-Amarelo Distrófico cambissólico (LVAd)
A 5.10 22.00 19.00 10.00 32.40 65.40 50.00 0.00 660.00 200.00 140.00 14.70 2.91
Bw 4.20 15.00 10.00 4.00 14.60 57.60 25.00 38.00 640.00 140.00 220.00 22.40 1.76
Profile 11 – Typic Distrustept / Cambissolo Háplico Tb Distrófico típico (CXbd)
A 4.70 20.00 13.00 6.00 19.90 51.90 38.00 5.00 640.00 180.00 180.00 18.60 2.31
Bi 4.50 13.00 12.00 3.00 15.70 52.70 30.00 24.00 560.00 220.00 220.00 20.30 2.39
Profile 12 – Typic Distrustept / Cambissolo Háplico Tb Distrófico típico (CXbd)
A 4.70 10.00 11.00 5.00 17.20 46.20 37.00 5.00 660.00 220.00 120.00 11.00 2.24
Bi 3.90 13.00 8.00 2.00 10.70 58.70 18.00 61.00 680.00 180.00 140.00 29.80 2.34
Profile 13 – Typic Haploxerult / Argissolo Vermelho Distrófico abrúptico (PVd)
A 5.60 24.00 40.00 23.00 66.60 90.60 74.00 0.00 570.00 160.00 270.00 92.60 1.74
Bt 6.20 24.00 43.00 16.00 60.20 87.20 69.00 0.00 510.00 160.00 330.00 138.00 1.90
Profile 14 – Lithic Udipsamment / Neossolo Regolítico Distrófico típico (RRd)
A 5.70 17.00 18.00 11.00 30.70 51.70 59.00 0.00 860.00 20.00 120.00 9.30 1.92
C 4.70 10.00 10.00 4.00 15.30 44.30 35.00 12.00 860.00 20.00 120.00 12.10 2.49
Profile 15 – Typic Distrustept / Cambissolo Háplico Tb Distrófico típico (CXbd)
A 5.50 13.00 8.00 4.00 13.30 39.30 34.00 7.00 780.00 80.00 140.00 8.20 2.11
Bi 3.90 10.00 2.00 1.00 3.70 34.70 11.00 68.00 760.00 80.00 160.00 27.00 1.94
Profile 16 – Kandiudalfic Eutrudox / Nitossolo Vermelho Eutrófico latossólico (NVe)
A 5.40 29.00 31.00 13.00 45.00 86.00 52.00 0.00 210.00 280.00 510.00 160.90 1.79
Bn 6.20 20.00 33.00 13.00 46.50 66.50 70.00 0.00 270.00 80.00 650.00 172.00 1.81
Profile 17 – Typic Haploxerult / Argissolo Amarelo Eutrófico abrúptico (PAe)
A 5.40 15.00 33.00 11.00 46.50 62.50 74.00 0.00 740.00 140.00 120.00 6.20 2.56
Bt 4.70 9.00 1.00 3.00 4.40 17.40 25.00 0.00 740.00 140.00 120.00 21.30 1.88
in the range between 800 and 1,050 nm, making the curves of the A horizons take on a linear aspect in this interval. The features between 450 and 600 nm cause subtle differences in the absorption intensity, which can be sufficient to separate the subhorizons in the field by their colors. In this range, the deeper horizons show a slightly smaller reflectance factor, which is associated with a bigger proportion of hematite, which in turn makes the horizon more reddish closer to the rock. The spectral curves fit in the type 2 standard for superficial horizons and type 4 for subsuperficial horizons (Table 1 and Figure 1).
Apart from the physical, chemical and morphological attributes, Profile 16 showed spectral curves with a be-havior similar to that of Profile 4, with a slight fall in the reflectance factor. The analyses of both profiles revealed agreement with the attributes described by Formaggio et al. (1996) for type 1 curves (Table 1 and Figure 1). A particularity for these profiles is the spectral behavior of the deepest profiles, the oxic B horizons (Bw), that show reflectance intensities close to or even lower than those of the surface horizons (Figures 2d and 3b). The lower reflectance in the superficial horizons is attributed to or-ganic matter, a fact that cannot explain the same behavior in Bw, which more likely is explained by the presence of opaque minerals and a high content of total iron (Table 2) (Demattê et al., 2001). The higher reflectance of the second horizon described in the soil profile (textural
horizon/ Bt) is probably caused by a sandier texture, re-sulting from the formation processes of this type of ho-rizon. The spectral feature that can be observed at 2,265 nm, representing the presence of gibbsite (mineral 1:1), is characteristic of weathering tropical soils (Madeira Netto, 1996).
The Typic Haploxerult/PAe (Profile 17), derived from a sandstone, shows an E horizon with bright colors and a sand fraction with high quartz content, resulting in high spectral intensities around 73% (Figure 4c). The spectral pattern is close to type 4 (Table 1 and Figure 1), with a weak influence of iron oxide until 1,000 nm, given its low content, such behavior could be similar to that of Quartzipsamments (Valeriano et al., 1995). The Bt horizon seems to fit into the same pattern, although less sandy, with more pronounced features and lower reflec-tance intensity. The superficial horizon (Ap), likewise san-dy, with a maximum reflectance factor around 59%, has its features masked by organic matter (Figure 4c) and has a type 2 behavior standard (Table 1 and Figure 1).
Organic matter, texture and mineralogy effects on the soil reflectance
Figure 4. Spectral behavior of the soil classes: Lithic Udipsamment (a), Kandiudalfic Eutrudox (b), and Typic Haploxerult (c), and their respective horizons; Ap: A horizon with pedoturbation (numeric suffixes indicate subdivisions); E: mineral horizon with clay removal; Bw and Bt: B horizon with intense alteration and with clay accumulation, respectively; Cr: C horizon (unconsolidated material) with saprolite (Santos et al., 2005).
becomes rectilinear (Figure 5a). These results confirm the findings described in the literature where organic matter in the soil absorbs electromagnetic energy and modifies the spectrum geometry (Demattê et al., 2003). The shape acquired by the spectrum with the addition of organic matter helps in identifying the effect of the iron oxide absorption by creating a con-cavity at 850 nm.
The granulometric variation of the soil, as men-tioned earlier, has an influence on the descriptive aspects of the spectral data. Sandier soils reflect more electro-magnetic energy and show spectra with an ascending shape up to approximately 1,700 nm and thereafter a descending shape within the rest of the infrared spec-trum. With increasing clay content, the albedo intensity decreases and the spectra take a flat shape (Figure 5b) (Demattê and Garcia 1999). As a matter of fact, the relation between the textural characteristics and spectral
forms strengthen the possibility to quantify the clay content through mathematical models, as stated by Sorensen and Dalsgaard (2005).
Soils that are less weathered with a high ki index show a predominantly 2:1 mineralogy, while soils with a low ki index are more developed and can have kaolinitic or oxidic mineralogy. As previously observed, the absorption features, principally at 1,900 nm and 2,200 nm, indicate a presence of 2:1 and 1:1 minerals, depending on their de-scriptive aspects. In this case, when the ki index increases, these features become more pronounced, mainly because of the 2:1 mineralogy (Figure 5c). More weathered soils, indicated by their low ki index, show less distinct absorp-tion features.
The effects of the iron oxides and their relation to the color variation in the soils can also be found through the descriptive aspects of the spectral data (Figure 5d). Yellowish soils show a spectral behavior similar to that of goethite, with absorption features of higher reflectance intensity, however more narrow at 480 nm and less deep at 750 nm. In the reddish soils, with a predominance of hematite, the bands were less intense with bigger am-plitude at 480 nm and deeper at 750 nm (Fontes and Carvalho, 2005).
Spectral behavior of soils along the landscape and its relation with classification
The spectral evaluation of the soils along a toposequence can help determining the soil limits and consequently their mapping. According to this idea, three representative soil classes were chosen in the study area: Kandiudalfic Eutrudox (Nitossolo Vermelho Eutroférrico latossólico – NVef) (Profile 4); Typic Hapludoll (Chernossolo Háplico Órtico típico – MXo) (Profile 5) and Lithic Eutrudept (Cambissolo Háplico Eutroférrico léptico – CXef) (Profile 6). The spec-tral curves for these soil classes, obtained in the laboratory with soil samples collected in situ, with their respective posi-tion in the landscape, can be seen in Figure 6a.
Figure 5. Influence of the soil attributes in the soil spectra: organic matter (a); granulometry (b); Ki index (c); iron oxides (d); P: studied profile, Ap: A horizon with pedoturbation; Bi, Bw, Bt and Btg: incipient B horizon, with intense alteration, with clay accumulation and gley, respectively (Santos et al., 2005).
REFERENCES
ALMEIDA, F.F.M.; MELO, M.S. A bacia do Paraná e o vulcanismo mesozóico. In: ALMEIDA, F.F.M.; HASUI, Y.; PONÇANO, W.L.; DANTAS, A.S.L.; CARNEIRO, C.D.R.; MELO, M.S.; BISTRICHI, C.A. Mapa geológico do Estado de São Paulo. São Paulo: IPT, 1981. Cap. 4, p. 46-81.
BEN-DOR, E.K.; PATKIN, K.; BANIN, A.; KARNIELI, A. Mapping of several soil properties using DAIS-7915 hyperspectral scanner data. A case study over clayey soil in Israel. International Journal of Remote Sensing, v.23, p.1043-1062, 2002.
CAMARGO, O.A.; MONIZ, A.C.; JORGE, J.A.; VALADARES, J.M. Métodos de análise química, mineralógica e física de solos do IAC. Campinas: Instituto Agronômico de Campinas, 1986. 94 p. (Boletim Técnico, 106)
COZZOLINO, D.; MORÓN, A. The potential of near-infrared reflectance spectroscopy chemometrics to predict soil organic carbon fractions. Soil and Tillage Research, v.85, p.78-85, 2006.
DEMATTÊ, J.A.M.; GARCIA, G.J. Alteration of soil properties through a weathering sequence as evaluated by spectral reflectance. Soil Science Society of American Journal, v.63, p.327-342, 1999.
DEMATTÊ, J.A.M.; DEMATTÊ, J.L.; CAMARGO, W.P.; FIORIO, P.R.; NANNI, M.R. Remote sensing in the recognition and mapping of tropical soils developed on topographic sequences. Mapping Sciences and Remote Sensing, v.38, p.79-102, 2001.
DEMATTÊ, J.A.M.; EPIPHANIO, J.C.; FORMAGGIO, A.R. Influência da matéria orgânica e de formas de ferro na reflectância de solos tropicais. Bragantia, v.62, p.451-464, 2003.
DEMATTÊ, J.A.M.; CAMPOS, R.C.; ALVES, M.C.; FIORIO, P.R.; NANNI, M.R. Visible-NIR reflectance: a new approach on soil evaluation. Geoderma, v.121, p.95-112, 2004.
EMPRESA BRASILEIRA DE PESQUISA AGROPECUÁRIA – EMBRAPA. Centro Nacional de Pesquisa de Solos. Sistema Brasileiro de Classificação de Solos. 2.ed. Rio de Janeiro: Embrapa Solos, 2006. 306p.
FONTES, M. P.F.; CARVALHO, A. Color attributes and mineralogical characteristics, evaluated by radiometry, of highly weathered tropical soils. Soil Science Society of American Journal, v.69, p.1162-1172, 2005.
FORMAGGIO, A.R.; EPIPHANIO, J.C.; VALERIANO, M.M.; OLIVEIRA, J.B. Comportamento espectral (450-2.450 nm) de solos tropicais de São Paulo. Revista Brasileira de Ciência do Solo, v.20, p.467-474, 1996.
KOSMAS, C.S.; CURI, N.; BRYANT, R.B.; FRANZMEIER, D.R. Characterization of iron oxide minerals by second-derivative visible spectroscopy. Soil Science Society of American Journal, v.48, p.401-405, 1984.
MADEIRA NETTO, J.S. Spectral reflectance properties of soil. Photo Interpretation, v.34, p.59-70, 1996.
MOORE, D.M.; REYNOLDS, R.C. X-ray diffraction. In: MOORE, D.M.; REYNOLDS, R.C. (Ed.). X-Ray diffraction and the identification and analysis of clay minerals. New York: Oxford University Press, 1997. chap. 3, p. 61-103.
ODLARE, M.; SVENSSON, K.; PELL, M. Near infrared reflectance spectroscopy for assessment of spatial soil variation in an agricultural field. Geoderma, v.126, p.193-202, 2005.
The Typic Hapludoll (MXo), localized in an inter-mediate position in the landscape, has a great content of 2:1 minerals (ki index around 2.9) and a differentiated texture with depth, giving distinct spectral curves be-tween horizons regarding intensity and form when com-pared to the Kandiudalfic Eutrudox (Figure 6c). The high intensity of the absorption features, corresponding to the 2:1 minerals, gives this profile the characteristics of a less weathered soil. The same can be said for the Lithic Eutrudept (CXef ), which presents poorly devel-oped subsurface horizons and close to the parent materi-al with a high materi-albedo, different from the surface horizons that are influenced by organic matter.
4. CONCLUSION
The hypothesis of the study was confirmed. Each soil class shows distinct classification characteristics due to the na-ture of the analytical and morphological data that in turn are closely related to the descriptive spectral data.
By the methodology of clustering the spectra ac-cording to the behavioral standards, the sandy soils are classified mainly as type 2 and 4, while the soils with higher content of clay are of type 1. However, a more detailed analysis of the spectral curves with respect to shape, features and absorption intensity gives better information about the soil samples than by clustering alone.
The evaluation of the spectral data of soil samples from the surface and subsurface horizons permits to dis-criminate the profile’s analytic variability, supporting the soil discrimination and classification.
SANTOS, R.D.; LEMOS, R.C.; SANTOS, H.G.; KER, J.C.; ANJOS, L.H.C. Manual de descrição e coleta de solo no campo. 5.ed. Viçosa: Sociedade Brasileira de Ciência do Solo, Centro Nacional de Pesquisa de Solos, 2005. 92p.
SCHEINOST, A.C.; SCHWERTMANN, U. Color identification of iron oxides and hydroxysulfates: Use and limitations. Soil Science Society of American Journal, v.63, p.1463-1471, 1999.
SHEPHERD, K.D.; WALSH, M.G. Development of reflectance spectral libraries for characterization of soil properties. Soil Science Society of American Journal, v.66, p.988-998, 2002.
SHERMAN, D.M.; WAIT, T.D. Electronic spectra of Fe+3 oxides
and oxides hydroxides in the near IR to near U.V. American Mineralogist, v.70, p.1262-1269, 1985.
SORENSEN, L.K; DALSGAARD, S. Determination of Clay and Other Soil Properties by Near Infrared Spectroscopy. Soil Science Society of American Journal, v.69, p.159-167, 2005.
STONER, E.R.; BAUMGARDNER, M.F. Characteristics variations in reflectance of surface soils. Soil Science Society of American Journal, v.45, p.1161-1165, 1981.
VALERIANO, M.M.; EPIPHANIO, J.C.N.; FORMAGGIO, A.G.; OLIVEIRA, J.B. Bidirectional reflectance factor of 14 soil classes from Brazil. International Journal of Remote Sensing, v.16, p.113-128, 1995.
VISCARRA ROSSEL, R.A.; WALWORT, D.J.J.; MCBRATNEY, A.B.; JANIK, L.J.; SKJESMSTAD, J. O. Visible near infrared or combined diffuse reflectance spectroscopy for simultaneous assessment of various soil properties. Geoderma, v.131, p.59-75, 2006.