Revista Brasileira de
Engenharia Agrícola e Ambiental
Campina Grande, PB, UAEA/UFCG – http://www.agriambi.com.br
v.21, n.9, p.587-593, 2017
Dripper testing: Application of statistical quality control
for measurement system analysis
Hermes S. da Rocha
1, Patricia A. A. Marques
2, Antonio P. de Camargo
2,
Douglas L. dos Reis
3, Eric A. da Silva
4& José A. Frizzone
2DOI: http://dx.doi.org/10.1590/1807-1929/agriambi.v21n9p587-593
A B S T R A C T
Laboratory tests for technical evaluation or irrigation material testing involve the measurement of many variables, as well as monitoring and control of test conditions. This study, carried out in 2016, aimed at using statistical quality control techniques to evaluate results of dripper tests. Exponentially weighted moving average control charts were elaborated, besides capability indices for the measurement of the test pressure and water temperature; and study on repeatability and reproducibility (Gage RR) of flow measurement system using 10 replicates, in three work shifts (morning, afternoon and evening), with 25 emitters. Both the test pressure and water temperature remained stable, with “excellent” performance for the pressure adjustment process by integrative-derivative proportional controller. The variability between emitters was the component with highest contribution to the total variance of the flow measurements, with 96.77% of the total variance due to the variability between parts. The measurement system was classified as “acceptable” or “approved” by the Gage RR study; and non-random causes of significant variability were not identified in the routine of tests.
Ensaios de gotejadores: Aplicação de controle estatístico
de qualidade na análise de sistema de medição
R E S U M O
Os ensaios laboratoriais para avaliação técnica ou estudo de material de irrigação envolvem a medição de diversas grandezas, bem como o monitoramento e controle das condições de ensaio. A presente pesquisa, realizada em 2016, teve por objetivo utilizar técnicas de controle estatístico de qualidade para avaliar resultados de ensaios de tubos gotejadores. Foram elaborados gráficos de controle para média móvel exponencialmente ponderada, além de índices de capacidade para o processo de medição da pressão de ensaio e temperatura da água; e estudo de repetitividade e reprodutibilidade (Gage RR) para vazão, no qual foram utilizadas 10 repetições, sob três turnos de trabalho (manhã, tarde e noite), com 25 emissores. Tanto a pressão quanto a temperatura se mantiveram estáveis, com desempenho “excelente” para o ajuste da pressão via controlador proporcional integrativo-derivativo. A variabilidade entre emissores foi a componente de maior contribuição na variância total das medições de vazão, sendo 96,77% devida à variabilidade entre peças. Classificou-se o sistema de medição como “aceitável” ou “aprovado” mediante o estudo Gage RR; e não foram identificadas causas não aleatórias de variabilidade relevantes na rotina de ensaios.
Key words:
dripper flow
statistical process control repeatability and reproducibility control charts
stability and capability for measurement process
Palavras-chave:
vazão de gotejadores
controle estatístico de processos repetitividade e reprodutibilidade gráficos de controle
estabilidade e capacidade do processo de medição
1 Universidade Federal dos Vales do Jequitinhonha e Mucuri/Instituto de Ciências Agrárias/Campus Unaí. Unaí, MG. E-mail: [email protected]
(Corresponding author)
2 Universidade de São Paulo/Escola Superior de Agricultura “Luiz de Queiroz”/Departamento de Engenharia de Biossistemas. Piracicaba, SP. E-mail:
[email protected]; [email protected]; [email protected]
3 Instituto Federal de Santa Catarina/Campus Criciúma. Criciúma, SC. E-mail: [email protected]
4 Universidade de São Paulo/Instituto de Pesquisas Energéticas e Nucleares/Centro de Tecnologia das Radiações. São Paulo, SP. E-mail: [email protected]
Introduction
Laboratory tests for technical evaluation of irrigation material involve the measurement of many variables, as well as the monitoring and control of test conditions. Any measurement system has instabilities due to causes such as interference of the operator, imperfections in mechanical or electronic devices, oscillations in the power source, mechanical vibrations and electrical noises.
In the determination of flow rate uniformity and ratio between flow rate and pressure of drippers and drip lines, test pressures are defined, for which the corresponding flow rate is determined. It is noted that, at the test pressure, there are fluctuations in the readings of the pressure and flow rate sensors. Particularly, the main concern consists in determining if such oscillations are acceptable and also the tolerance limits of these variations, to ensure the quality of the results.
Measurement, monitoring, control and improvement of quality constitute the concept of statistical quality control, whose implementation is based on approaches such as: planning of experiments, statistical process control (SPC) techniques and measurement system analysis (MSA) (Montgomery, 2016). Therefore, the research involves the study and improvement of systems of measurement of the flow variables in drippers, using statistical quality control tools.
With the hypothesis that it is possible to contribute to the improvement in the quality of test results, and propose methodologies that help in the evaluation and approval of the control and measurement systems, the present study aimed to use techniques and tools of statistical quality control to evaluate the adequacy level of the test structure. It aimed to propose a methodology to diagnose the contribution of the factors inherent to the measurement system, in the total variability of the flow rate measurements and, eventually, propose improvements for the process.
Material and Methods
The research was conducted at the Laboratory of Irrigation Material Testing (LEMI/INCT-EI/ESALQ/USP), in Piracicaba-SP. Some of the commonly called “seven tools” of quality, presented and described in detail by Montgomery (2016), were implemented and/or applied to a workbench for testing drippers and drip lines (Figure 1). This structure was especially projected to determine the flow rate-pressure curve and flow rate uniformity of drippers and drip lines, with tests performed according to NBR ISO 9261 (ABNT, 2006).
Flow rate measurement is based on the principle of level variations in collecting tubes and utilizes pressure transducer to measure the hydraulic load, which operates within the range from 0 to 100 mbar, with expanded uncertainty of 0.02% in relation to the full scale and resolution of 0.01 mbar. Additionally, the test bench has a pressure transmitter to monitor the test pressure, which operates within the range from 0 to 5 bar, with expanded uncertainty of 0.03% in relation to the full scale and resolution of 0.001 bar; and temperature transducer to monitor water temperature, calibrated in the range from 20 to 40 ºC, with expanded uncertainty of 0.15 ºC and resolution of 0.1 ºC.
Twenty five emitters (Naan TIF 25 16 mm, model manufactured by NaanDanJain®) were installed on the bench
and their flow rate-pressure ratio (q = kHx), with q in L h-1
and H in kgf cm-2, had coefficient k = 2.3235 and exponent x =
0.5064, with samples collected randomly from a lot belonging to the stock of the LEMI’s material.
The study was conducted in a routine of tests performed in work shifts (morning, afternoon and evening), adjusting the pressure and monitoring the other quality characteristics (water temperature and flow rate of the drippers).
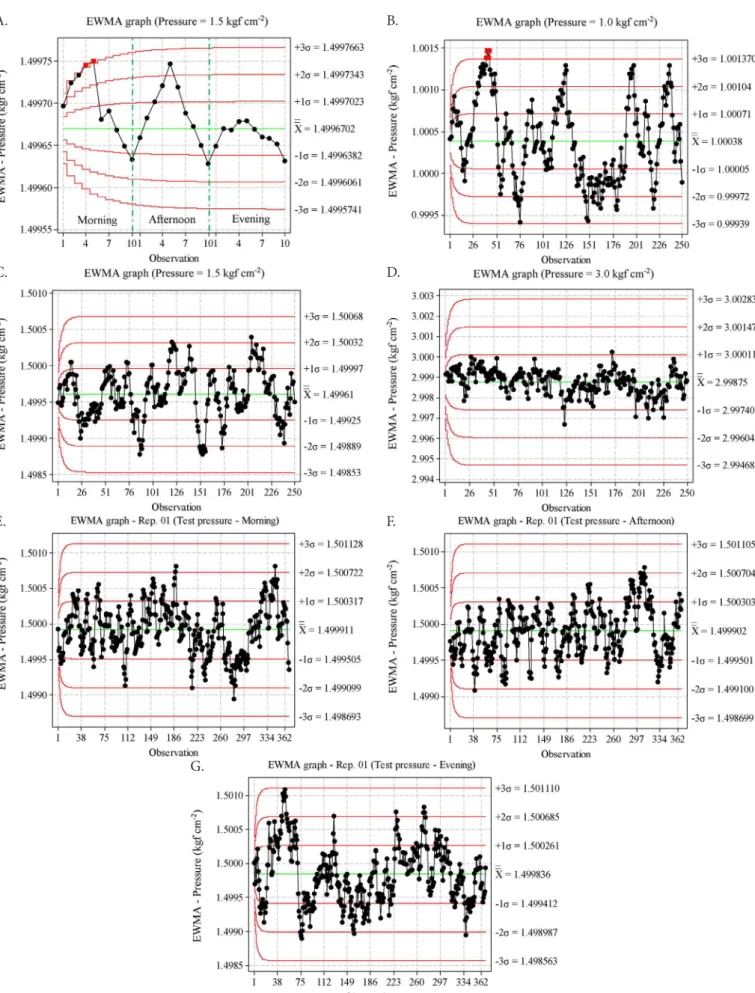
Control charts for the exponentially weighted moving average (EWMA), elaborated according to the methodology described by Montgomery (2016), were used to confront the results of three test shifts, at the test pressure of 1.5 kgf cm-2,
with 10 replicates per shift; and also data of tests conducted at pressures of 1.0, 1.5 and 3.0 kgf cm-2. The data were used
for the analysis of stability, capability and performance of the test pressure control and measurement process, and for the monitoring of water temperature. This procedure tested the hypothesis that the proportional integrative-derivative (PID) controller used to adjust the pressure is able to maintain the measurement process stable at any pressure, regardless of the time of test conduction.
The capability and performance indices of the process were obtained from 3,620 measurements of the test pressure per shift, with total of 10,680 values of the indication of pressure in the general data set, based on the 10 replicates in the three shifts of the tests (morning, afternoon and evening), considering 362 indications of pressure obtained per replicate. For this, specification limits of ± 2% and ± 1% for maximum variation allowed around the reference value (target of the process) were established, based on requirements for the uncertainty of the pressure meters, defined by the NBR ISO 9261 (ABNT, 2006). Similarly, the norm defines that water temperature must remain between 20 and 26 ºC during each test.
variation in the total variance of the obtained measurement. This tool was used to evaluate the impact of the measurement system on flow rate determinations to obtain the flow rate variation coefficient due to effects of manufacture (CVMq), in tests of flow rate uniformity of drippers. Thus, the flow rate of each one of the 25 drippers was measured, at pressure of 1.5 kgf cm-2, with 10 replicates in each work shift, totaling 750
observations.
The experiment was planned to meet the ANOVA model for repeatability and reproducibility (Eq. 1), with a = 3, b = 25, n = 10 and µ as the overall mean of the data, establishing the test conduction shift as variable of the study. This is justified by the absence of influence from the operator in the resulting measurement, since the test pressure controlling system was totally automatized by the PID controller actuation and also the automatic monitoring of the other quality characteristics (water temperature and flow rate), with data acquisition system. Hence, the measurement condition that supposedly could cause interferences in the measurements was the alteration of the work shift.
The number of different categories (NDC = √2[σPart (Emitter)/ σGage RR]) allows to identify the ability of a measurement system
to detect a difference in the measured characteristic (García & Rio, 2013), i.e., it basically quantifies indirectly the resolution of a measurement system. Acceptance criteria based on %σGage RR and NDC, defined in AIAG (2010), have been widely used and reported by various researchers to determine whether the measurement system can or cannot be approved (Al-Refaie & Bata, 2010; Pedott & Fogliatto, 2013; Peruchi et al., 2014; Pereira et al., 2016; Zanobini et al., 2016).
Results and Discussion
Daily oscillations of room temperature led to variations in the mean water temperature during the tests (Figure 2A). Since water temperature must remain between 20 and 26 ºC (ABNT, 2006), the limits were adequately met. However, more important than analyzing water temperature oscillations between tests is analyzing its stability during a single test (Figure 2B), because in this observation scale there should be no variations to the point of significantly affecting the flow rate measurements of the drippers. Thus, there were no points beyond the limits ± 3σ in the EWMA control chart during a test (for example, the replicate 05 in the morning shift).
Two points virtually coincident with the ULC = 3σ in the EWMA control chart were identified in the fourth and fifth replicate, respectively, for test conducted in the morning (Figure 3A). However, it was assumed that this observation y
i a
j b
k
ijk = + +i j+
( )
ij+ ijk= = = µ τ β τβ ε
1 2 3 1 2 3 1 2
, , ,..., , , ,...,
, ,, ,...,3 n
The parameters τi, βj, (τβ)ij and εijk represent the effects of the “i” level of the factor measurement condition (normally operator; or work shift as in the present study); of the “j” level of the factor part (or emitters in the present study); the possible effects of interaction between emitter and measurement condition (“ij” level); and the random error, respectively. The total variance of the observations V(yijk) is obtained by the sum of the partial components of the variability (Eq. 2), and the objective of this ANOVA is to test the hypothesis of equality of the means or of the effects of factors (components of the variability) and interaction being equal to zero (Pedott & Fogliatto, 2013).
V y
(
ijk)
=σTotal =σβ+στ+στβ+σ2 2 2 2 2
where: σ2
β - variability of the emitter;
σ2
τ + σ2τβ - variation relative to the reproducibility
(σ2
reproducibility), resulting from the variation associated with the
factor measurement condition (σ2
τ) and of the possible effects
of interaction (σ2 τβ); and,
σ2 - component of variation relative to the repeatability
(σ2
repeatability).
Normally, the measurement system is expected to exhibit minimum interference and most of the contributions in the total variance are expected to be attributed to the effects of the variation between parts (Pedott & Fogliatto, 2013; Pereira et al., 2016; Zanobini et al., 2016), and it is possible to determine the standard deviation associated with the effects of repeatability and reproducibility (σGage RR = √σ2
repeat. + σ2reprod. + σ2interaction)
and their percentage of contribution in relation to the total variability (%σRR = 100(σGage RR/σtotal)).
Figure 2. Monitoring of mean water temperature along the tests (A) and EWMA control chart for all observation during a single test (B)
B. A. (1)
should not be considered as a sign of instability or absence of control in the test pressure measuring process, because the control range (LLC - ULC) is very restricted, i.e., the variation
range of the process remained within the adequate limits of variability, considering the magnitude of the obtained control limits. In addition, it became evident the greater difficulty
Figure 3. EWMA control charts for test pressure on bench of drippers and drip lines: Mean of each test for different shifts (A); pressure of 1.0 kgf cm-2 (B), 1.5 kgf cm-2 (C), 3.0 kgf cm-2 (D); morning (E), afternoon (F) and evening (G)
A. B.
C. D.
E. F.
to maintain under control the tests conducted at very low pressures, according to Figures 3B, 3C and 3D. Considering a single replicate for the test in the three shifts, the pressure control and measurement system is able to remain stable, regardless of the work shift, during the period of the test, which is approximately 12 min for the utilized model of dripper, at pressure of 1.5 kgf cm-2 (Figures 3E, 3F and 3G).
For 1.0 kgf cm-2, four points beyond the limit + 3σ occurred
in the observations 40, 41, 42 and 43 (Figure 3B), but the variation of pressure occurred only after the fourth decimal place and, therefore, it is technically irrelevant in this type of tests. Hence, it is concluded that the pressure is stable at any of the usually tested values and also does not depend on the shift, as evidenced in Figures 3E, 3F and 3G.
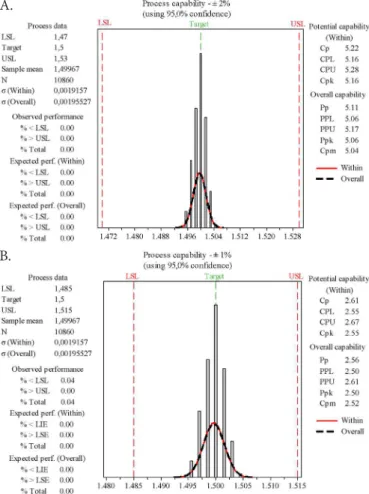
All data remained within the lower and upper limits of specification (LSL and USL), for both ± 2% (LSL = 1.47 kgf cm-2 and USL = 1.53 kgf cm-2) (Figure 4A) and ± 1% (LSL =
1.485 kgf cm-2 and USL = 1.515 kgf cm-2) of maximum variation
allowed around the target (Figure 4B), and also no value was expected to be outside the specification range (% < LSL = 0 and % > USL = 0).
Considering the tolerance of ± 1% (Figure 4B), values of 2.61, 2.56 and 2.52 were obtained for the indices Cp, Pp and Cpm, respectively. The indices Cp (Cp, Cpl, Cpu and Cpk) represent the potential level that the process could reach if all special causes were eliminated, calculated using the variation within the subgroups (σinside); on the other hand, the indices Pp (Pp, Ppl, Ppu and Ppk) are indicators of the actual capability of the
process, i.e., they reflect the actual performance of the process in relation to the specification limits and are calculated based on the global standard deviation (σglobal); the index Cpm indicates the centralization level of the data in relation to the mean of the process and desired target (Montgomery, 2016).
The centralization of the test pressure control and measurement process in relation to the specification limits became evident because the values of the indices Cpk and Cpm are almost identical to those of Cp and Pp (Pan & Li, 2014).
Additionally, the process of adjustment of the pressure and its measurement was classified as “excellent” (Tsai & Chen, 2006; Kaya & Kahraman, 2010, 2011), which leads to the conclusion that, assuming the established specification range, which refers to the limit for uncertainty of the pressure meters, according to the norm for tests of drippers and drip lines (ABNT, 2006), the measurement process meets the normative requirements.
In the absence of effects of interaction between parts and shifts, this component was disregarded in the study on repeatability and reproducibility for flow rate measurement, as recommended by Pedott & Fogliatto (2013). In this study, the effects of flow rate variation between the emitters prevail and those of shifts were irrelevant (p – value = 0.102), considering the level α = 0.05 for the significance of the effects.
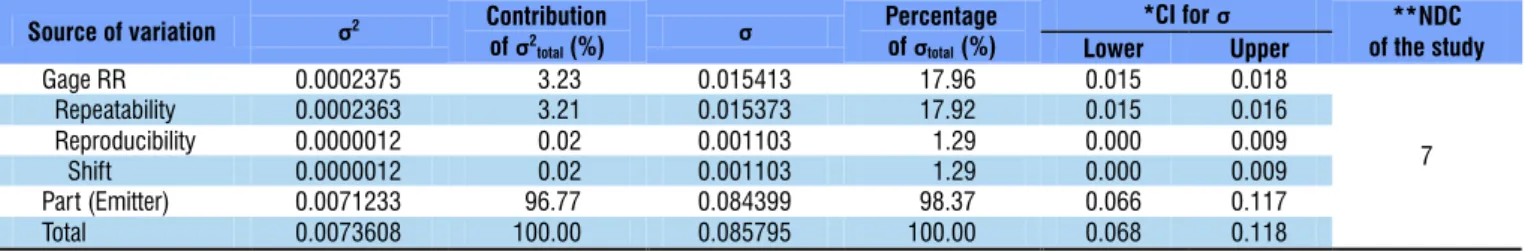
Table 1 shows the follow-up analysis of the ANOVA and quantification of the contribution of each component in the total variation, with the confidence intervals, considering 95% probability, for the respective values obtained, besides the standard deviation associated with each source of variation. Only 3.23% of the total flow rate variation is due to effects associated with the uncertainties of repeatability and reproducibility (Gage RR), i.e., with measurement errors inherent to the measurement system. Thus, 96.77% of the total variance of flow rate is due to the variability between emitters, which allows to claim that the utilized flow rate measurement system operates adequately and has little influence on the results of CVMq obtained in flow rate uniformity tests.
Normally, for 2.0 ≤ NDC ≤ 5.0 and 10.0% ≤ %σRR ≤
30.0% the measurement system can already be considered as “acceptable”; the higher the NDC and lower the %σRR, the better the system’s level of adequacy and reliability (AIAG, 2010). The measurement system used on the bench was able to identify seven categories or classes of drippers with different flow rates, as represented by the index NDC = 7, and the NDC values above 5.0 are considered as “adequate” (Pedott & Fogliatto, 2013).
In this study on repeatability and reproducibility of the measurement system, the total standard deviation was equal to 0.0858, of which 17.96% was relative to Gage RR and 98.37% associated with the parts or drippers. In terms of standard deviation, the sum of the percentages of contribution of the measurement system (Gage RR) and of the parts does not result in 100%, as presented for the variance. This is due to the formulation proposed in the ANOVA model, with the total standard deviation associated with the measurements yijk expressed as the square root of the sum of the partial
components of the total variability, i.e., σtotal = √V(yijk) = √σ2 τ
+ σ2
β + σ2τβ + σ2 (White & Borror, 2011; Montgomery, 2016).
According to the interlaboratory comparison made by Koech et al. (2015) for test of flow rate uniformity of drippers, performed manually through the gravimetric method, greater Figure 4. Analysis of capability for the test pressure control
and measurement process: specification range of de ± 2% (A) and ± 1% (B), in relation to the reference value B.
dispersion in the measurements can be interpreted as higher instability in the test conditions and at least one of the evaluated laboratories exhibited measurement uncertainty significantly different from the others.
Determinations of the variation coefficient of the drip lines pointed to CVMq varying from 2.9 to 3.1%, with overall mean of 3.0%. Therefore, based on the discussed analyses, it can be claimed that the control and measurement systems can measure the variables necessary to obtain the CVMq adequately, with reduced variability, regardless of the moment in which the tests are conducted.
Conclusions
1. The pressure adjustment via PID controller allowed to maintain this variable stable, regardless of the test conduction shift, although lower pressures have led to greater difficulty to maintain the system under control.
2. The pressure control and measurement process was classified as “excellent”, considering the maximum variation range of ± 2% in relation to the desired target, maintaining also the level of excellence by restricting the specification limits to ± 1%.
3. There is no influence of the test conduction shift on the quality of the flow rate measurements of the drippers.
4. The repeatability and reproducibility of the flow rate measurement system were “acceptable” for the test bench and the effect of the variability between the emitters corresponded to 96.77% of the total variance of the flow rate measurements.
5. Relevant non-random causes of variability were not detected in the routine of tests performed in the Laboratory of Irrigation Material Testing (LEMI/INCT-EI/ESALQ/USP).
Acknowledgments
To the Ministry of Science and Technology (MCT), National Council for Scientific and Technological Development (CNPq) and São Paulo State Research Support Foundation (FAPESP) for the financial support to the research, through the National Institute of Science and Technology in Irrigation Engineering (INCT-EI).
Literature Cited
ABNT - Associação Brasileira de Normas Técnicas. NBR ISO 9261: Equipamentos de irrigação agrícolas - Emissores e tubos emissores - Especificação e métodos de ensaio. Rio de Janeiro: ABNT, 2006. 17p.
AIAG - Automotive Industries Action Group. Measurement system analysis - reference manual, 4.ed. Southfield, MI, Daimler Chrysler Corporation, Ford Motor Company, General Motors Corporation, Essex, 2010. 232p.
Al-Refaie, A.; Bata, N. Evaluating measurement and process capabilities by GR&R with four quality measures. Measurement: Journal of the International Measurement Confederation, v.43, p.842-851. 2010. https://doi.org/10.1016/j.measurement.2010.02.016 García, A. C.; Río, A. G. del. Number of distinct data categories
and gage repeatability and reproducibility. A double (but single) requirement. Measurement: Journal of the International Measurement Confederation, v.46, p.2514-2518, 2013. https:// doi.org/10.1016/j.measurement.2013.04.065
Kaya, İ.; Kahraman, C. Fuzzy process capability analyses with fuzzy normal distribution. Expert Systems with Applications, v.37, p.5390-5403, 2010. https://doi.org/10.1016/j.eswa.2010.01.017 Kaya, İ.; Kahraman, C. Fuzzy process capability indices with
asymmetric tolerances. Expert Systems with Applications, v.38, p.14882-14890, 2011. https://doi.org/10.1016/j.eswa.2011.05.059 Koech, R.; Molle, B.; Camargo, A. P. de; Dimaiolo, P.; Audouard,
M.; Saretta, E.; Frizzone, J. A.; Pezzaniti, D.; Benhu, G. Intercomparison dripper testing within the INITL. Flow Measurement and Instrumentation, v.46, p.1-11, 2015. https:// doi.org/10.1016/j.flowmeasinst.2015.08.003
Montgomery, D. C. Introdução ao controle estatístico da qualidade. 7.ed. Rio de Janeiro: LTC, 2016. 528p.
Pan, J.-N.; Li, C.-I. New capability indices for measuring the performance of a multidimensional machining process. Expert Systems with Applications, v.41, p.2409-2414, 2014. https://doi. org/10.1016/j.eswa.2013.09.039
Pedott, A. H.; Fogliatto, F. S. Estudo de repetitividade e reprodutibilidade para dados funcionais. Produção, v.23, p.548-560, 2013. https:// doi.org/10.1590/S0103-65132012005000087
Pereira, R. B. D.; Peruchi, R. S.; Paiva, A. P. de; Costa, S. C. da; Ferreira, J. R. Combining Scott-Knott and GR&R methods to identify special causes of variation. Measurement: Journal of the International Measurement Confederation, v.82, p.135-144, 2016. https://doi.org/10.1016/j.measurement.2015.12.033
Peruchi, R. S.; Paiva, A. P. de; Balestrassi, P. P.; Ferreira, J. R.; Sawhney, R. Weighted approach for multivariate analysis of variance in measurement system analysis. Precision Engineering, v.38, p.651-658, 2014. https://doi.org/10.1016/j.precisioneng.2014.03.001 Tsai, C.-C.; Chen, C.-C. Making decision to evaluate process capability
index Cp with fuzzy numbers. International Journal of Advanced Manufacturing Technology, v.30, p.334-339, 2006. https://doi. org/10.1007/s00170-005-0052-7
Table 1. Discrimination of variation, standard deviation and percentages of contribution of each variation component in the total variability of the flow rate measurements on the bench of tests for drippers and drip lines
Source of variation σ2 Contribution
ofσ2total(%)
σ Percentage
ofσtotal(%)
*CI forσ **NDC
of the study
Lower Upper
Gage RR 0.0002375 003.23 0.015413 017.96 0.015 0.018
7
Repeatability 0.0002363 003.21 0.015373 017.92 0.015 0.016
Reproducibility 0.0000012 000.02 0.001103 001.29 0.000 0.009
Shift 0.0000012 000.02 0.001103 001.29 0.000 0.009
Part (Emitter) 0.0071233 096.77 0.084399 098.37 0.066 0.117
Total 0.0073608 100.00 0.085795 100.00 0.068 0.118
White, T. K.; Borror, C. M. Two-dimensional guidelines for measurement system indices. Quality and Reliability Engineering International, v.27, p.479-487. 2011. https://doi.org/10.1002/ qre.1144