ABSTRACT: The olive (Olea europaea L.) is a leading oil crop in the Mediterranean area. Limited information on the inheritance of agronomic significant traits hinders progress in olive breeding programs, which encourages the development of markers linked to the traits. In this study, we report on the development of 46 olive simple sequence repeat (SSR) markers, obtained from 577,025 expressed sequence tags (ESTs) in developing olive fruits generated in the framework of the Slovenian national olive transcriptome project. Sequences were de novo assembled into 98,924 unigenes, which were then used as a source for microsatellites searching. We identified 923 unigenes that contained 984 SSRs among which dinucleotide SSRs (36 %) were the most abundant, followed by tri- (33 %) and hexa- (21 %) nucleotides. Microsatellite repeat motif GA (37 %) was the most common among dinucleotides, while microsatellite repeat motif GAA was the most abundant trinucleotide SSR motif (16 %). Gene ontology annotations could be assigned to 27 % of the unigenes. A hundred and ten expressed sequence tag-derived-simple sequence repeats (EST-SSRs) with annotated genes were selected for primer designing and finally, 46 (42 %) polymorphic EST-SSRs were successfully amplified and used to validate genetic diversity among 24 olive varieties. The average number of alleles per locus, observed heterozygosity, ex-pected heterozygosity, and polymorphic information content were 4.5, 0.649, 0.604 and 0.539, respectively. Twenty-seven EST-SSRs showed good diversity properties and were recommended for further olive genome investigation.
Keywords: expressed sequence tags, microsatellites, genic markers, genetic diversity, function-al annotation
Identification and validation of novel EST-SSR markers in olives
Alenka Baruca Arbeiter1, Matjaž Hladnik1, Jernej Jakše2, Dunja Bandelj1*
1University of Primorska/Faculty of Mathematics, Natural Sciences and Information Technologies, Glagoljaška ulica, 8 − 6000 − Koper − Slovenia.
2University of Ljubljana/Biotechnical Faculty − Agronomy Dept., Jamnikarjeva ulica, 101 − 1000 − Ljubljana − Slovenia.
*Corresponding author <[email protected]>
Edited by: Leonardo Oliveira Medici
Received March 16, 2016 Accepted June 05, 2016
Introduction
Olive (Olea europaea L.) production is the most im-portant agricultural branch in the Mediterranean basin, and olive oil is the main source of fats in the wealthy Mediterranean diet. In addition to high levels of mono-unsaturated fatty acids, it contains biologically active molecules, including biophenols, squalene, tocopherols, and phytosterols, which have many positive effects on human health (Ali Hashmi et al., 2015; Ghanbari et al., 2012) and are the major contributors to the unique taste of the oil (Cicerale et al., 2009). Consequently, the inves-tigation of genes responsible for the synthesis of these molecules is essential to improve olive oil quality and develop new varieties.
Breeders and the olive industry are currently focused on identifying high-performance genotypes, while the increasing need for diversity of varieties that are well-adopted to changes in the environment, cultivation conditions and consumer requirements dictate the development of new olive varieties (Lavee et al., 2014). For these reasons, the use of new technologies, including new molecular markers, are essential for breeding success and validation of authenticity and traceability of primary products entering the agro-food chain (Corrado, 2016; Pasqualone et al., 2016).
With the improvement and development of next generation sequencing technology, expressed sequence tags (ESTs) are publicly available and represent very useful tool for gene and marker discovery, which are attractive for gene mapping, functional studies, genome annotation
and comparative genomics (Ozgenturk et al., 2010; Rudd, 2003). Among them, genic microsatellites, or expressed sequence tag-derived simple sequence repeats (EST-SSRs), have found a special place in plant genetics and breeding of several agricultural plants (Kalia et al., 2011; Varshney et al., 2005). However, a few transcriptome projects on the generation of ESTs in olive have been completed recently (Alagna et al., 2009; Muñoz-Mérida et al., 2013; Ozgenturk et al., 2010; Rešetič et al., 2013), and a limited number of EST-SSRs are currently available in olives (Adawy et al., 2015; De la Rosa et al., 2013; Essalouh et al., 2014). The main purpose of this study was to increase the number of validated EST-SSRs, for the benefit of all interested research groups, via the identification of simple sequence repeats (SSRs) from the transcripts of developing olive fruits of the variety “Istrska belica”. The validation and putative func-tional annotation of a new set of EST-SSRs and their appli-cability in olive diversity study are reported in this paper.
Materials and Methods
Shotgun Assembly project has been deposited at Databank of Japan/ European Molecular Biology Laboratory (EMBL) Data Library/GenBank under the accession number GDUL00000000 (http://www.ncbi.nlm.nih. gov/nuccore/GDUL00000000). In the current study, all 98,924 assembled sequences were used as a source for microsatellite identification. The mining of microsatellites was performed using the Perl script MIcroSAtelitte (MISA) (http://pgrc.ipk-gatersleben.de/misa). The main criterion for SSR identification was the minimum length, that is, eight repeat units for dinucleotides motif, six repeat units for trinucleotide and tetranucleotide, and four repeat units for pentanuclotide and other higher-order repeats. Sequences containing SSRs longer than 20 nucleotides were first reviewed with the use of Tablet (a next generation sequence assembly viewer) (Milne et al., 2010) in order to exclude all SSR-including sequences that were inappropriate for primer designing according to the following criteria: (a) very short DNA sequence flanking the microsatellite (less than 30 bases) or (b) microsatellite sequence repeat was used by assembler as an overlapping part for the adjacent reads, therefore, there is a probability that this contig is a chimeric one. Sequences were then aligned against National Center for Biotechnology Information (NCBI) non-redundant (nr) protein database using the BLASTX algorithm to determine the putative function (E < 1e-10). Only SSR-containing transcripts with annotated genes were identified as candidates for SSR marker development. Primer3 v.4.0.0 tool (Koressaar and Remm, 2007; Untergrasser et al., 2012) with default parameters was used for designation of 110 primer pairs. A single criterion for primer designation was the length of the microsatellite sequence (150 - 200 bp). A shorter primer in the pair was elongated for the M13 (-21) 18 bp sequence at the 5’ end (5’-TGTAAAACGACGGCCAGT-3’) for economic fluorescent labelling (Schuelke, 2000). Integrated DNA Technologies (IDT) synthesized all primers. GenBank Accession numbers, locus names, primer sequences, repeat motifs, SSR locations, annealing temperatures, size ranges and putative functions are listed in Table 1.
Marker validation
Twenty-four olive varieties (“Arbequina”, “Ascola-na tenera”, “Athe“Ascola-na”, “Buga”, “Cipressino”, “Corati“Ascola-na”, “Črnica”, “Frantoio”, “Grignan”, “Istrska belica”, “Itra-na”, “Leccino”, “Leccio del corno”, “Leccione”, “Mauri-no”, “Moraiolo”, “Nocellara del Belice”, “Oblica”, “Pen-dolino”, “Picholine”, “Samo”, “Santa Caterina”, “Štorta”, “Zelenjak”) from a Slovenian collection orchard (N 45°34’29.98”, E 13°46’09.30”) were used to evaluate the potential of newly developed EST-SSRs for the olive di-versity study. Total DNA was extracted from leaf tissue using the Cetyl trimethylammonium bromide (CTAB) method (Kump and Javornik, 1996) and DNA concentra-tions were measured with a fluorometer.
All 110 developed primer pairs were used for in-itial screening in the genotyping procedure of eight ol-ive varieties. The optimal annealing temperature (Ta)
was experimentally determined for each locus where five different Ta were tested. The highest annealing tem-peratures (Ta1) in touchdown polymerase chain reaction (PCR) were set at 60 ºC, 58 ºC, 55 ºC, 53 ºC and 50 ºC. Loci with unstable PCR amplification were additional-ly optimized by raising the DNA concentration, and by increasing the number of cycles in the second step of the amplification. Finally, the amplification of SSRs was performed in a total volume of 15 µL, containing 1 × supplied PCR buffer, 2 mM MgCl2, 0.2 mM of each deox-ynucleotide (dNTP), 0.2 µM of each locus specific prim-er with one of the primprim-ers in pair that was elongated for M13(-21) universal sequence (Schuelke, 2000), 0.25 µM of M13(-21) universal primer labelled with 6-FAM, VIC, PET or NED, 0.375 unit of Taq DNA polymerase (Ther-mo Fischer Scientific, Waltham, USA) and 40 ng of ol-ive DNA. The amplification was performed in a thermal cycler, and the conditions of the two-step PCR were as follows: 94 ºC for 5 min, then 5 cycles at 94 ºC for 45 s, 30 s at Ta1 (Table 1), which was lowered by 1 ºC in each cycle, and the extension at 72 ºC for 1 min 30 s. The second step of amplification passed through 35 cycles of 30 s at 94 ºC, 30 s at the lowest annealing temperature (Ta2) (Table 1), 1 min 30 s at 72 ºC, and a final extension at 72 ºC for 10 min. Separation of amplified SSRs was performed in a 3130 Genetic Analyzer, using 500 LIZ size standard. Data were analyzed with Gene Mapper v.4.1 software.
Genetic parameters were calculated for 24 olive varieties over 46 EST-SSR loci that produced clear frag-ments after amplification. The observed (Ho) and expect-ed (He) heterozygosity, polymorphic information content (PIC), and the frequency of null alleles (F(null)) were cal-culated using the CERVUS v.3.0.7 computer software. IDENTITY v.1.0 software was used to calculate prob-ability of identity (PI). The effective number of alleles (ne), number of observed and all possible genotypes and deviations from the Hardy-Weinberg equilibrium (HWE) were calculated using the POPGENE v.1.32 software. The algorithm by Levene (1949) was used for calcula-tion expected genotypic frequencies under random mat-ing, and chi-square (χ2) tests were performed for HWE at each locus. Variety-specific alleles were calculated by using MICROSAT software. The AMaCAID script (Caroli et al., 2011) was used to elucidate the minimum num-ber of markers required to distinguish all observed gen-otypes, including the Model3, and the fixed number of combinations was set at 50,000.
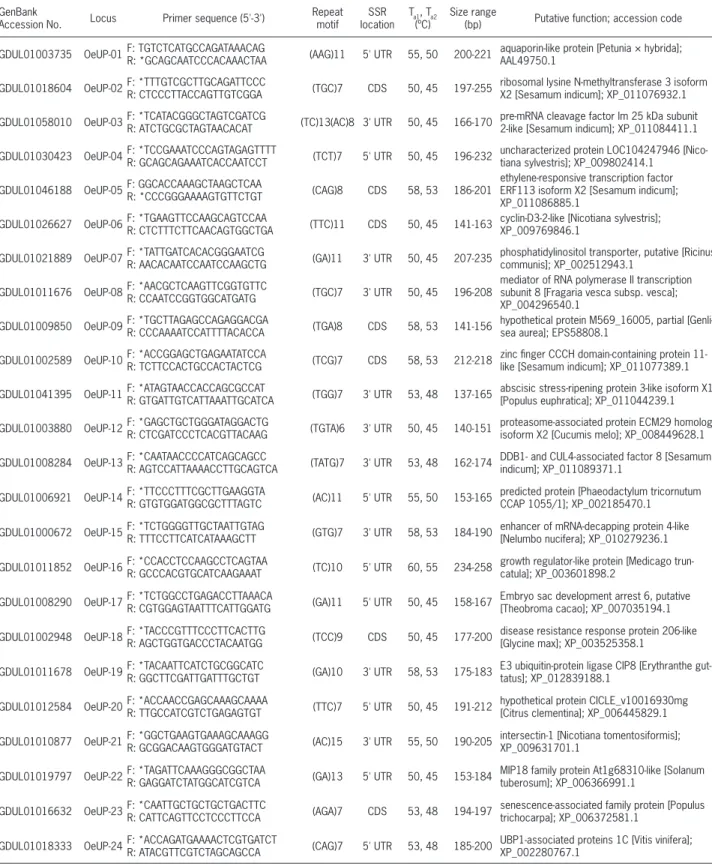
Table 1 – GenBank Accession numbers, locus names, primer sequences, repeat motifs, simple sequence repeat (SSR) locations in untranslated region (UTR) or in coding sequence (CDS), primers the highest (Ta1) and the lowest (Ta2) annealing temperatures in touchdown polymerase chain reaction (PCR), size ranges and putative functions for newly developed expressed sequence tag-derived simple sequence repeats (EST-SSRs).
GenBank
Accession No. Locus Primer sequence (5'-3')
Repeat motif
SSR location
Ta1, Ta2 (ºC)
Size range
(bp) Putative function; accession code
GDUL01003735 OeUP-01F: TGTCTCATGCCAGATAAACAG
R: *GCAGCAATCCCACAAACTAA (AAG)11 5' UTR 55, 50 200-221
aquaporin-like protein [Petunia × hybrida]; AAL49750.1
GDUL01018604 OeUP-02F: *TTTGTCGCTTGCAGATTCCC
R: CTCCCTTACCAGTTGTCGGA (TGC)7 CDS 50, 45 197-255
ribosomal lysine N-methyltransferase 3 isoform X2 [Sesamum indicum]; XP_011076932.1
GDUL01058010 OeUP-03F: *TCATACGGGCTAGTCGATCG
R: ATCTGCGCTAGTAACACAT (TC)13(AC)8 3' UTR 50, 45 166-170
pre-mRNA cleavage factor Im 25 kDa subunit 2-like [Sesamum indicum]; XP_011084411.1
GDUL01030423 OeUP-04F: *TCCGAAATCCCAGTAGAGTTTT
R: GCAGCAGAAATCACCAATCCT (TCT)7 5' UTR 50, 45 196-232
uncharacterized protein LOC104247946 [Nico-tiana sylvestris]; XP_009802414.1
GDUL01046188 OeUP-05F: GGCACCAAAGCTAAGCTCAA
R: *CCCGGGAAAAGTGTTCTGT (CAG)8 CDS 58, 53 186-201
ethylene-responsive transcription factor ERF113 isoform X2 [Sesamum indicum]; XP_011086885.1
GDUL01026627 OeUP-06F: *TGAAGTTCCAAGCAGTCCAA
R: CTCTTTCTTCAACAGTGGCTGA (TTC)11 CDS 50, 45 141-163
cyclin-D3-2-like [Nicotiana sylvestris]; XP_009769846.1
GDUL01021889 OeUP-07F: *TATTGATCACACGGGAATCG
R: AACACAATCCAATCCAAGCTG (GA)11 3' UTR 50, 45 207-235
phosphatidylinositol transporter, putative [Ricinus communis]; XP_002512943.1
GDUL01011676 OeUP-08F: *AACGCTCAAGTTCGGTGTTC
R: CCAATCCGGTGGCATGATG (TGC)7 3' UTR 50, 45 196-208
mediator of RNA polymerase II transcription subunit 8 [Fragaria vesca subsp. vesca]; XP_004296540.1
GDUL01009850 OeUP-09F: *TGCTTAGAGCCAGAGGACGA
R: CCCAAAATCCATTTTACACCA (TGA)8 CDS 58, 53 141-156
hypothetical protein M569_16005, partial [Genli-sea aurea]; EPS58808.1
GDUL01002589 OeUP-10F: *ACCGGAGCTGAGAATATCCA
R: TCTTCCACTGCCACTACTCG (TCG)7 CDS 58, 53 212-218
zinc finger CCCH domain-containing protein 11-like [Sesamum indicum]; XP_011077389.1
GDUL01041395 OeUP-11F: *ATAGTAACCACCAGCGCCAT
R: GTGATTGTCATTAAATTGCATCA (TGG)7 3' UTR 53, 48 137-165
abscisic stress-ripening protein 3-like isoform X1 [Populus euphratica]; XP_011044239.1
GDUL01003880 OeUP-12F: *GAGCTGCTGGGATAGGACTG
R: CTCGATCCCTCACGTTACAAG (TGTA)6 3' UTR 50, 45 140-151
proteasome-associated protein ECM29 homolog isoform X2 [Cucumis melo]; XP_008449628.1
GDUL01008284 OeUP-13F: *CAATAACCCCATCAGCAGCC
R: AGTCCATTAAAACCTTGCAGTCA (TATG)7 3' UTR 53, 48 162-174
DDB1- and CUL4-associated factor 8 [Sesamum indicum]; XP_011089371.1
GDUL01006921 OeUP-14F: *TTCCCTTTCGCTTGAAGGTA
R: GTGTGGATGGCGCTTTAGTC (AC)11 5' UTR 55, 50 153-165
predicted protein [Phaeodactylum tricornutum CCAP 1055/1]; XP_002185470.1
GDUL01000672 OeUP-15F: *TCTGGGGTTGCTAATTGTAG
R: TTTCCTTCATCATAAAGCTT (GTG)7 3' UTR 58, 53 184-190
enhancer of mRNA-decapping protein 4-like [Nelumbo nucifera]; XP_010279236.1
GDUL01011852 OeUP-16F: *CCACCTCCAAGCCTCAGTAA
R: GCCCACGTGCATCAAGAAAT (TC)10 5' UTR 60, 55 234-258
growth regulator-like protein [Medicago trun-catula]; XP_003601898.2
GDUL01008290 OeUP-17F: *TCTGGCCTGAGACCTTAAACA
R: CGTGGAGTAATTTCATTGGATG (GA)11 5' UTR 50, 45 158-167
Embryo sac development arrest 6, putative [Theobroma cacao]; XP_007035194.1
GDUL01002948 OeUP-18F: *TACCCGTTTCCCTTCACTTG
R: AGCTGGTGACCCTACAATGG (TCC)9 CDS 50, 45 177-200
disease resistance response protein 206-like [Glycine max]; XP_003525358.1
GDUL01011678 OeUP-19F: *TACAATTCATCTGCGGCATC
R: GGCTTCGATTGATTTGCTGT (GA)10 3' UTR 58, 53 175-183
E3 ubiquitin-protein ligase CIP8 [Erythranthe gut-tatus]; XP_012839188.1
GDUL01012584 OeUP-20F: *ACCAACCGAGCAAAGCAAAA
R: TTGCCATCGTCTGAGAGTGT (TTC)7 5' UTR 50, 45 191-212
hypothetical protein CICLE_v10016930mg [Citrus clementina]; XP_006445829.1
GDUL01010877 OeUP-21F: *GGCTGAAGTGAAAGCAAAGG
R: GCGGACAAGTGGGATGTACT (AC)15 3' UTR 55, 50 190-205
intersectin-1 [Nicotiana tomentosiformis]; XP_009631701.1
GDUL01019797 OeUP-22F: *TAGATTCAAAGGGCGGCTAA
R: GAGGATCTATGGCATCGTCA (GA)13 5' UTR 50, 45 153-184
MIP18 family protein At1g68310-like [Solanum tuberosum]; XP_006366991.1
GDUL01016632 OeUP-23F: *CAATTGCTGCTGCTGACTTC
R: CATTCAGTTCCTCCCTTCCA (AGA)7 CDS 53, 48 194-197
senescence-associated family protein [Populus trichocarpa]; XP_006372581.1
GDUL01018333 OeUP-24F: *ACCAGATGAAAACTCGTGATCT
R: ATACGTTCGTCTAGCAGCCA (CAG)7 5' UTR 53, 48 185-200
UBP1-associated proteins 1C [Vitis vinifera]; XP_002280767.1
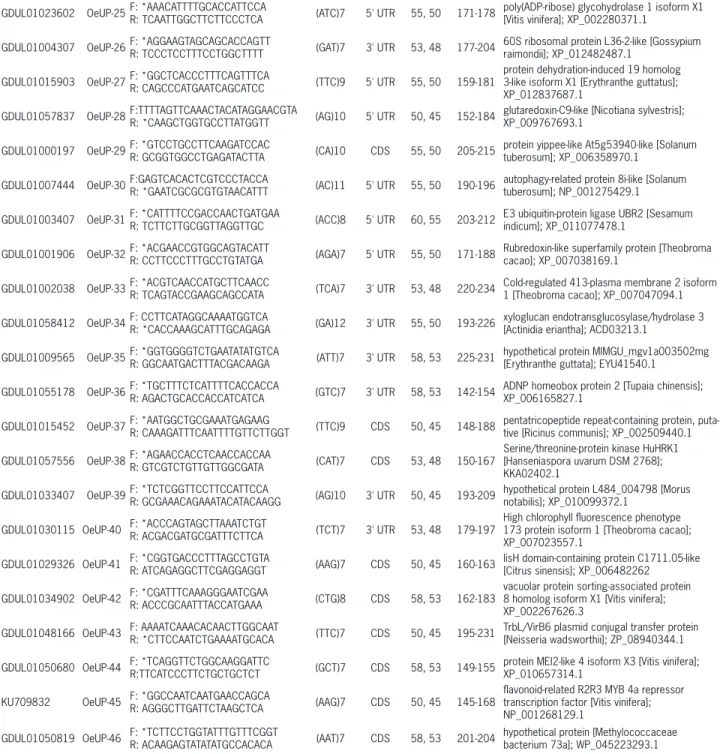
Putative functional annotation of the transcripts containing SSRs
All ESTs containing SSRs were further used for functional annotation with Blast2GO online application (https://www.blast2go.com) in order to assign the se-quences to the following functional Gene Ontology (GO) categories: molecular function, biological process, and GDUL01023602 OeUP-25F: *AAACATTTTGCACCATTCCA
R: TCAATTGGCTTCTTCCCTCA (ATC)7 5' UTR 55, 50 171-178
poly(ADP-ribose) glycohydrolase 1 isoform X1 [Vitis vinifera]; XP_002280371.1
GDUL01004307 OeUP-26F: *AGGAAGTAGCAGCACCAGTT
R: TCCCTCCTTTCCTGGCTTTT (GAT)7 3' UTR 53, 48 177-204
60S ribosomal protein L36-2-like [Gossypium raimondii]; XP_012482487.1
GDUL01015903 OeUP-27F: *GGCTCACCCTTTCAGTTTCA
R: CAGCCCATGAATCAGCATCC (TTC)9 5' UTR 55, 50 159-181
protein dehydration-induced 19 homolog 3-like isoform X1 [Erythranthe guttatus]; XP_012837687.1
GDUL01057837 OeUP-28F:TTTTAGTTCAAACTACATAGGAACGTA
R: *CAAGCTGGTGCCTTATGGTT (AG)10 5' UTR 50, 45 152-184
glutaredoxin-C9-like [Nicotiana sylvestris]; XP_009767693.1
GDUL01000197 OeUP-29F: *GTCCTGCCTTCAAGATCCAC
R: GCGGTGGCCTGAGATACTTA (CA)10 CDS 55, 50 205-215
protein yippee-like At5g53940-like [Solanum tuberosum]; XP_006358970.1
GDUL01007444 OeUP-30F:GAGTCACACTCGTCCCTACCA
R: *GAATCGCGCGTGTAACATTT (AC)11 5' UTR 55, 50 190-196
autophagy-related protein 8i-like [Solanum tuberosum]; NP_001275429.1
GDUL01003407 OeUP-31F: *CATTTTCCGACCAACTGATGAA
R: TCTTCTTGCGGTTAGGTTGC (ACC)8 5' UTR 60, 55 203-212
E3 ubiquitin-protein ligase UBR2 [Sesamum indicum]; XP_011077478.1
GDUL01001906 OeUP-32F: *ACGAACCGTGGCAGTACATT
R: CCTTCCCTTTGCCTGTATGA (AGA)7 5' UTR 55, 50 171-188
Rubredoxin-like superfamily protein [Theobroma cacao]; XP_007038169.1
GDUL01002038 OeUP-33F: *ACGTCAACCATGCTTCAACC
R: TCAGTACCGAAGCAGCCATA (TCA)7 3' UTR 53, 48 220-234
Cold-regulated 413-plasma membrane 2 isoform 1 [Theobroma cacao]; XP_007047094.1
GDUL01058412 OeUP-34F: CCTTCATAGGCAAAATGGTCA
R: *CACCAAAGCATTTGCAGAGA (GA)12 3' UTR 55, 50 193-226
xyloglucan endotransglucosylase/hydrolase 3 [Actinidia eriantha]; ACD03213.1
GDUL01009565 OeUP-35F: *GGTGGGGTCTGAATATATGTCA
R: GGCAATGACTTTACGACAAGA (ATT)7 3' UTR 58, 53 225-231
hypothetical protein MIMGU_mgv1a003502mg [Erythranthe guttata]; EYU41540.1
GDUL01055178 OeUP-36F: *TGCTTTCTCATTTTCACCACCA
R: AGACTGCACCACCATCATCA (GTC)7 3' UTR 58, 53 142-154
ADNP homeobox protein 2 [Tupaia chinensis]; XP_006165827.1
GDUL01015452 OeUP-37F: *AATGGCTGCGAAATGAGAAG
R: CAAAGATTTCAATTTTGTTCTTGGT (TTC)9 CDS 50, 45 148-188
pentatricopeptide repeat-containing protein, puta-tive [Ricinus communis]; XP_002509440.1
GDUL01057556 OeUP-38F: *AGAACCACCTCAACCACCAA
R: GTCGTCTGTTGTTGGCGATA (CAT)7 CDS 53, 48 150-167
Serine/threonine-protein kinase HuHRK1 [Hanseniaspora uvarum DSM 2768]; KKA02402.1
GDUL01033407 OeUP-39F: *TCTCGGTTCCTTCCATTCCA
R: GCGAAACAGAAATACATACAAGG (AG)10 3' UTR 50, 45 193-209
hypothetical protein L484_004798 [Morus notabilis]; XP_010099372.1
GDUL01030115 OeUP-40 F: *ACCCAGTAGCTTAAATCTGT
R: ACGACGATGCGATTTCTTCA (TCT)7 3' UTR 53, 48 179-197
High chlorophyll fluorescence phenotype 173 protein isoform 1 [Theobroma cacao]; XP_007023557.1
GDUL01029326 OeUP-41 F: *CGGTGACCCTTTAGCCTGTA
R: ATCAGAGGCTTCGAGGAGGT (AAG)7 CDS 50, 45 160-163
lisH domain-containing protein C1711.05-like [Citrus sinensis]; XP_006482262
GDUL01034902 OeUP-42 F: *CGATTTCAAAGGGAATCGAA
R: ACCCGCAATTTACCATGAAA (CTG)8 CDS 58, 53 162-183
vacuolar protein sorting-associated protein 8 homolog isoform X1 [Vitis vinifera]; XP_002267626.3
GDUL01048166 OeUP-43 F: AAAATCAAACACAACTTGGCAAT
R: *CTTCCAATCTGAAAATGCACA (TTC)7 CDS 50, 45 195-231
TrbL/VirB6 plasmid conjugal transfer protein [Neisseria wadsworthii]; ZP_08940344.1
GDUL01050680 OeUP-44 F: *TCAGGTTCTGGCAAGGATTC
R:TTCATCCCTTCTGCTGCTCT (GCT)7 CDS 58, 53 149-155
protein MEI2-like 4 isoform X3 [Vitis vinifera]; XP_010657314.1
KU709832 OeUP-45 F: *GGCCAATCAATGAACCAGCA
R: AGGGCTTGATTCTAAGCTCA (AAG)7 CDS 50, 45 145-168
flavonoid-related R2R3 MYB 4a repressor transcription factor [Vitis vinifera]; NP_001268129.1
GDUL01050819 OeUP-46 F: *TCTTCCTGGTATTTGTTTCGGT
R: ACAAGAGTATATATGCCACACA (AAT)7 CDS 58, 53 201-204
hypothetical protein [Methylococcaceae bacterium 73a]; WP_045223293.1
*Primers elongated for the universal M13 (-21) sequence (5'-TGTAAAACGACGGCCAGT-3') at the 5' ends. Table 1 – Continuation.
Results
Characterization of EST-SSRs and primer designing A total of 98,924 ESTs (36.8 Mb) from the olive transcriptome assembly (Rešetič et al., 2013) were exam-ined with the MISA tool for microsatellite identification. Of 98,924 ESTs, 923 sequences contained 984 microsat-ellites. On average, one microsatellite was found in ev-ery 37.4 kb of olive ESTs. Of 923 SSR-containing ESTs, 874 (95 %) ESTs contained only one SSR locus, while 49 (5 %) contained more than one SSR locus. Furthermore, 4 % of SSR loci (34 of all identified SSRs) were present in the compound formation.
The most abundant SSRs in olive were dinucleo-tide repeats (36 %), followed by tri- (33 %), hexa- (21 %) and penta-nucleotide (9 %) repeat units. The most frequent dinucleotide motif was GA/TC (37 %), followed by AG/CT (30 %) and AC/GT (17 %). Among trinucleo-tides, GAA/TTC was the most abundant (16 %). Motifs AGA/TCT and AAG/CTT occurred at 12 % and 11 %, respectively.
Of 984 EST-SSRs, 551 EST-SSRs possessing micro-satellite sequences longer than 20 bp were further re-viewed by the Tablet program. A total of 343 EST-SSRs had flanking regions longer than 30 bases and they were not located in the overlapping site within EST contig. Among these, only 197 EST-SSRs containing di-, tri-, tetra-nucleotides and compound SSRs were selected and blasted against the NCBI nr protein database. A total of 119 successfully annotated EST-SSRs were subjected to primer designing. Finally, 110 EST-SSR primer pairs were designed for further amplification.
Marker validation
Novel markers were tested for genotyping in a set of eight varieties of olive. Of 110 EST-SSR developed primers, only one (1 %) was monomorphic and 46 (42 %) demonstrated polymorphism with two or more alleles that could be detected and reliably scored. Among the others, 63 (57 %) loci fell into the following groups according to Chen et al. (2014): (1) “no peak” (45 %), (2) “weak peak” (11 %) and “multiple peaks” (2 %), based on the peak detection during the genotyping procedure. These 46 newly developed EST-SSRs contained trinucleotides (67 %), dinucleotides (26 %), two tetranucleotide repeats and one compound SSR (Table 1).
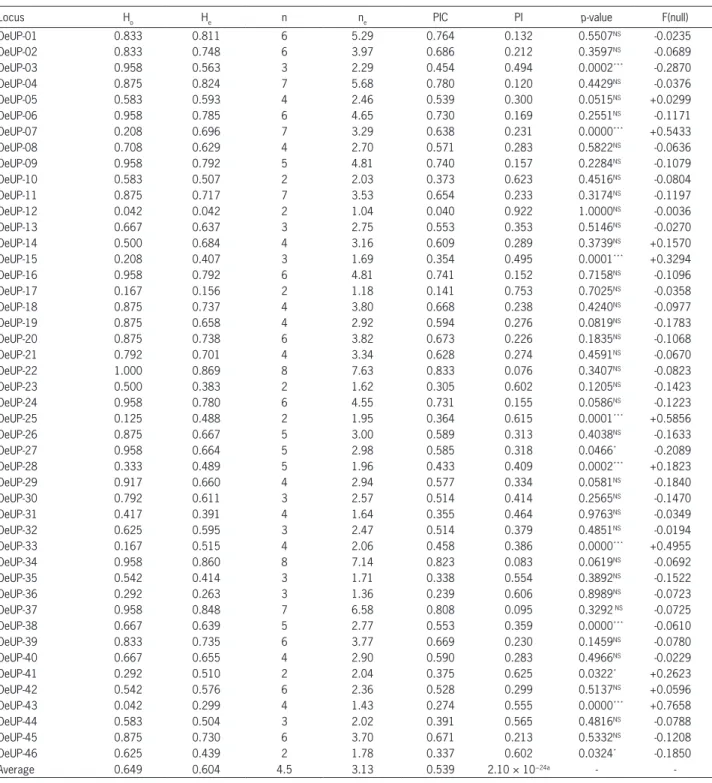
Polymorphism and genetic diversity analysis All 46 developed EST-SSRs were used to assess the polymorphism and genetic diversity of 24 olive varieties. All loci were successfully amplified and 205 different al-leles were detected. The number of amplified alal-leles at each locus varied from two (10, 12, OeUP-17, OeUP-23, OeUP-25, OeUP-41, OeUP-46) to eight (OeUP-22 and OeUP-34). The average number of alleles per locus was 4.5 and the average number of effective al-leles was 3.13. He ranged between 0.042 (OeUP-12) and 0.869 (OeUP-22), with an average of 0.604. The highest
Ho (1.000) was found at locus OeUP-22, and the lowest (0.042) was observed at two loci (12 and OeUP-43). PI value varied among loci in a range from 0.076 (OeUP-22) to 0.922 (OeUP-12), while the common PI value calculated for all loci was 2.10 × 10⁻²⁴. PIC values were in a range from 0.040 12) and 0.833 (OeUP-22), with a mean value 0.539. Based on the calculated PIC, 30 newly developed EST-SSRs were classified as informative markers (PIC > 0.5) and nine as suitable markers for gene mapping (PIC > 0.7) (Table 2).
Of 46 EST-SSR loci, 11 loci showed deviation from the HWE (Table 2). Most deviations can be assigned to the excess of one class and, more rarely, to two classes of homozygotes in the analyzed loci as well as to an ex-cess of one combination of identical alleles observed in a larger set of olive varieties. In nine loci, Ho was lower than He, and in six loci, the estimated frequencies of null alleles were higher than 0.2, indicating the upper boundary under which the microsatellite null alleles are uncommon to rare (Dakin and Avise, 2004).
Among 205 alleles detected, 29 were specific to dif-ferent olive varieties. The allelic polymorphisms allowed discriminating all analyzed varieties. The AMaCAID computer program was used to calculate the minimum number of markers required to distinguish all observed genotypes. All 24 olive genotypes could be differentiated by only two loci (OeUP-04 and OeUP-14).
The number of different microsatellite genotypes observed per locus ranged from two (12, 17, 23, and 46) to 14 (01 and OeUP-22), with 311 different genotypes, revealing 49 % of all possible genotypes (641). Altogether, 114 unique geno-types were observed. The first three loci with the highest number of unique genotypes were 01 (9), OeUP-16 (8) and OeUP-34 (7).
The Jaccard’s similarity coefficient was used to calculate the genetic distances among pairwise combina-tions in a set of 24 olive varieties from the Slovenian ol-ive collection. The highest genetic similarity value (0.72) was observed among the varieties “Leccino” and “Zelen-jak”. The average similarity coefficient was relatively low (0.39). A dendrogram (Figure 1) was constructed from genetic similarity data and clusters were tested for associations. The cophenetic coefficient was relatively high (0.84) and indicated a good fit of the original data to the clustering.
re-Table 2 – Parameters of genetic variability of each expressed sequence tag-derived simple sequence repeat (EST-SSR) obtained among 24 olive varieties. Observed (Ho) and expected (He) heterozygosity, number of alleles (n), effective number of alleles (ne), polymorphic information content (PIC), probability of identity (PI), probability for deviation from Hardy-Weinberg equilibrium (p-value), estimated frequency of null alleles (F(null)).
Locus Ho He n ne PIC PI p-value F(null)
OeUP-01 0.833 0.811 6 5.29 0.764 0.132 0.5507NS -0.0235
OeUP-02 0.833 0.748 6 3.97 0.686 0.212 0.3597NS -0.0689
OeUP-03 0.958 0.563 3 2.29 0.454 0.494 0.0002*** -0.2870
OeUP-04 0.875 0.824 7 5.68 0.780 0.120 0.4429NS -0.0376
OeUP-05 0.583 0.593 4 2.46 0.539 0.300 0.0515NS +0.0299
OeUP-06 0.958 0.785 6 4.65 0.730 0.169 0.2551NS -0.1171
OeUP-07 0.208 0.696 7 3.29 0.638 0.231 0.0000*** +0.5433
OeUP-08 0.708 0.629 4 2.70 0.571 0.283 0.5822NS -0.0636
OeUP-09 0.958 0.792 5 4.81 0.740 0.157 0.2284NS -0.1079
OeUP-10 0.583 0.507 2 2.03 0.373 0.623 0.4516NS -0.0804
OeUP-11 0.875 0.717 7 3.53 0.654 0.233 0.3174NS -0.1197
OeUP-12 0.042 0.042 2 1.04 0.040 0.922 1.0000NS -0.0036
OeUP-13 0.667 0.637 3 2.75 0.553 0.353 0.5146NS -0.0270
OeUP-14 0.500 0.684 4 3.16 0.609 0.289 0.3739NS +0.1570
OeUP-15 0.208 0.407 3 1.69 0.354 0.495 0.0001*** +0.3294
OeUP-16 0.958 0.792 6 4.81 0.741 0.152 0.7158NS -0.1096
OeUP-17 0.167 0.156 2 1.18 0.141 0.753 0.7025NS -0.0358
OeUP-18 0.875 0.737 4 3.80 0.668 0.238 0.4240NS -0.0977
OeUP-19 0.875 0.658 4 2.92 0.594 0.276 0.0819NS -0.1783
OeUP-20 0.875 0.738 6 3.82 0.673 0.226 0.1835NS -0.1068
OeUP-21 0.792 0.701 4 3.34 0.628 0.274 0.4591NS -0.0670
OeUP-22 1.000 0.869 8 7.63 0.833 0.076 0.3407NS -0.0823
OeUP-23 0.500 0.383 2 1.62 0.305 0.602 0.1205NS -0.1423
OeUP-24 0.958 0.780 6 4.55 0.731 0.155 0.0586NS -0.1223
OeUP-25 0.125 0.488 2 1.95 0.364 0.615 0.0001*** +0.5856
OeUP-26 0.875 0.667 5 3.00 0.589 0.313 0.4038NS -0.1633
OeUP-27 0.958 0.664 5 2.98 0.585 0.318 0.0466* -0.2089
OeUP-28 0.333 0.489 5 1.96 0.433 0.409 0.0002*** +0.1823
OeUP-29 0.917 0.660 4 2.94 0.577 0.334 0.0581NS -0.1840
OeUP-30 0.792 0.611 3 2.57 0.514 0.414 0.2565NS -0.1470
OeUP-31 0.417 0.391 4 1.64 0.355 0.464 0.9763NS -0.0349
OeUP-32 0.625 0.595 3 2.47 0.514 0.379 0.4851NS -0.0194
OeUP-33 0.167 0.515 4 2.06 0.458 0.386 0.0000*** +0.4955
OeUP-34 0.958 0.860 8 7.14 0.823 0.083 0.0619NS -0.0692
OeUP-35 0.542 0.414 3 1.71 0.338 0.554 0.3892NS -0.1522
OeUP-36 0.292 0.263 3 1.36 0.239 0.606 0.8989NS -0.0723
OeUP-37 0.958 0.848 7 6.58 0.808 0.095 0.3292 NS -0.0725
OeUP-38 0.667 0.639 5 2.77 0.553 0.359 0.0000*** -0.0610
OeUP-39 0.833 0.735 6 3.77 0.669 0.230 0.1459NS -0.0780
OeUP-40 0.667 0.655 4 2.90 0.590 0.283 0.4966NS -0.0229
OeUP-41 0.292 0.510 2 2.04 0.375 0.625 0.0322* +0.2623
OeUP-42 0.542 0.576 6 2.36 0.528 0.299 0.5137NS +0.0596
OeUP-43 0.042 0.299 4 1.43 0.274 0.555 0.0000*** +0.7658
OeUP-44 0.583 0.504 3 2.02 0.391 0.565 0.4816NS -0.0788
OeUP-45 0.875 0.730 6 3.70 0.671 0.213 0.5332NS -0.1208
OeUP-46 0.625 0.439 2 1.78 0.337 0.602 0.0324* -0.1850
Average 0.649 0.604 4.5 3.13 0.539 2.10 × 10⁻²⁴a -
-aProduct of PI values for 46 EST-SSR loci; NS = not significant p > 0.05; *Statistically significant difference p < 0.05; ***Statistically significant difference p < 0.001. spectively. “Ascolana tenera”, “Grignan”, “Buga”, “Samo”
and “Oblica” were well-defined groups. These variet-ies shared more than 60 % of alleles and two of them (“Samo” and “Buga”) represent the local Slovenian
Figure 1 – Phylogenetic tree of 24 olive varieties based on the Jaccard’s coefficient and unweighted pair-group method with arithmetic averages (UPGMA).
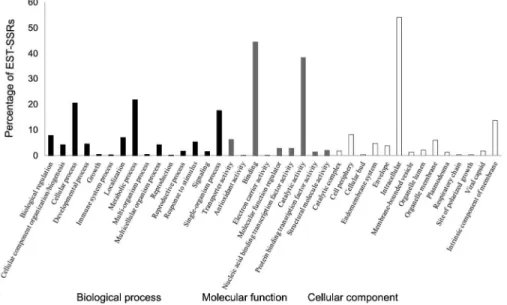
Figure 2 – Functional annotations of 247 expressed sequence tag-derived simple sequence repeats (EST-SSRs) in olives based on the Blast2GO analysis.
Functional annotation of SSR-containing tran-scripts
In order to assign the putative function of all 923 ESTs containing SSRs, a functional annotation was carried out using the Blast2GO software. A total of 247 ESTs (27 %) were detected as having homology with known proteins, 138 (15 %) were homologous to expressed, hypothetical/unknown/unnamed proteins, while 538 (58 %) SSR-containing sequences showed no significant (E < 1e-10) hits in the BLASTX analysis. During the BLASTing step, ESTs (109) were aligned to
Sesamum indicum L., while only six sequences were in correspondence to the Olea europaea L. database.
oxidative stress (OeUP-23 and OeUP-25) and osmotic stress (25), with cell transport (01, OeUP-07, OeUP-30, OeUP-42) and with embryo development (OeUP-09 and OeUP-17).
In addition, KEGG pathway visualization and EC annotations were also done for 247 annotated ESTs. In total, 55 pathways, including numerous cellular meta-bolic and biosynthesis pathways, were fully represented. Since olive is an important oil crop, the research was focused on ESTs with particular relevance in fruit me-tabolism. Most ESTs encoded the following enzymes: transferases (37 %), hydrolases (33 %) and oxidoreduc-tases (19 %). Specifically, ESTs encoded enzymes for bio-synthesis of secondary metabolites and lipids, including fatty acid and steroid biosynthesis, as well as sphingo-lipid metabolism.
Sequences of 46 polymorphic EST-SSRs were classified according to the position of SSRs within genes, that is, in the 3’ untranslated region (3’UTR), 5’ untranslated region (5’UTR), and coding region (CDS). More than half of developed EST-SSRs (65 %) were located in UTRs (35 % in 3’ UTRs, 30 % in 5’ UTRs) while others (35 %) were part of the CDSs (Table 1). Among the repeats identified in UTRs, the predominant were trinucleotides (35 %), followed by di- (24 %) and tetra-nucleotide repeats (4 %). Only one compound microsatellite (2 %) was found in UTRs. The most abundant repeats found in the CDS, where the open reading frame (ORF) was not corrupted by changing the number of the core repeat, were trinucleotides (33 %) and only one dinucleotide (2 %) was identified.
Discussion
The improvement of genetic resources of agricul-tural plants through molecular breeding programs re-quires efficient molecular markers in combination with linkage maps and genomics (Jiang, 2013). Recently, a vast number of EST datasets have been generated for many crop plants, which have offered an opportunity to identify and develop numerous functional molecular markers linked to genes or traits of interest. Although the olive tree is one of the most important oil crops in the Mediterranean, only a few tested EST-SSRs are avail-able (Adawy et al., 2015; De la Rosa et al., 2013; Es-salouh et al., 2014). This fact encouraged the Slovenian team to focus their research on the development of new olive EST-SSRs and provide high quality and informative markers to the research community.
For the development of EST-SSRs, the olive tran-scriptome from developing fruits of variety “Istrska belica” was used. Transcripts were generated from the predominant local variety in Slovenia, which has special organoleptic properties due to high biophenol content and is also known as one of the oiliest varieties in the region. For SSRs identification, 98,924 ESTs were exam-ined. Microsatellites were found in approximately 1 % of olive ESTs. Considerably higher frequencies were
re-ported for other fruit species, including 20 % in citrus fruits (Liu et al., 2013), 18 % in peaches (Vendramin et al., 2007) and 11 % in pomegranates (Jian et al., 2012). These differences in frequency and distribution of EST-SSRs can be attributed to the different criteria used to identify SSRs in the database mining, dataset size and database-mining tools (Varshney et al., 2005). Further-more, variations in the SSR frequency distribution are taxon-specific (Toth et al., 2000) and may reflect dif-ferences in the selection and domestication processes (Zhang et al., 2013).
In this study, dinucleotide SSRs were the most abundant (36 %), which is in accordance with results reported for sesame (Zhang et al., 2012) and some Rosa-ceae species (Jung et al., 2005). However, in most other fruit species and crop plants, trinucleotide repeats have been observed at the highest frequency (Jian et al., 2012; Liu et al., 2013). In olive transcriptome data, the most abundant dinucleotide SSR motif was GA/TC, while the motif GAA/TTC was the most common among trinucleo-tide SSRs, which support findings of Adawy et al. (2015). Furthermore, similar results have also been obtained in studies on citrus fruits (Chen et al., 2006), grapes (Huang et al., 2011), and mangos (Dillon et al., 2014).
After the annotation and assignment of putative functions to olive EST-SSRs, primers were successfully designed for 110 loci. After the optimization of the PCR protocol in a set of eight olive varieties, quality amplicons were obtained for 46 primers developed. The lengths of amplified microsatellites were in the expected range and no deviations were found. All 46 primers were used to test their applicability in a diversity study in a set of 24 olive varieties. All 46 EST-SSRs loci were polymorphic and 205 different alleles were detected, with the average number of 4.5 alleles per locus. Averages for Ho and He were 0.649 and 0.604, respectively. Slightly greater results for observed and expected heterozygosity (Ho = 0.769, He = 0.705) were obtained in a study, where 19 varieties, also used in this study, were tested with genomic SSRs (Bandelj et al., 2004). The comparable ability of genomic and EST-SSRs in the detection of genetic diversity in olives was also confirmed by De la Rosa et al. (2013). Furthermore, EST-SSRs may actually prove to be superior to genomic SSRs for diversity estimation and transferability (Gupta et al., 2003) and should be even more useful to develop linkage maps or tag agronomical important traits (Huang et al., 2011).
A good discrimination power of new genic mark-ers was demonstrated with the selection of the minimum number of markers needed to distinguish all 24 olive varieties. Two loci (OeUP-04 and OeUP-14) were deter-mined to be sufficient for the unambiguous discrimina-tion of all samples. The high discriminadiscrimina-tion power of EST-SSRs was also confirmed by a large number of geno-types observed per locus, including unique genogeno-types, as well as 29 unique alleles detected.
heterozygos-ity observed was lower than expected. Since deviations from the HWE in these loci are prone to bias-likelihood estimates, attention should be paid on account of the analyses of identity and parentage as well as in popula-tion studies (Cipriani et al., 2010).
The average PIC value for these markers in the genotypes examined was 0.539, which is much high-er than those found in citrus genhigh-era (mean = 0.450), pomegranate (mean = 0.381) and carob trees (mean = 0.420) (Jian et al., 2012; La Malfa et al., 2014; Liu et al., 2013). Furthermore, 27 newly developed EST-SSRs were classified as informative markers (01, OeUP-02, OeUP-04, OeUP-05, OeUP-06, OeUP-08, OeUP-09, OeUP-11, OeUP-13, OeUP-14, OeUP-16, OeUP-18, OeUP-19, OeUP-20, OeUP-21, OeUP-22, OeUP-24, OeUP-26, OeUP-29, OeUP-30, OeUP-32, OeUP-34, OeUP-37, OeUP-39, OeUP-40, OeUP-42, OeUP-45), and are strongly recommended due to the low frequency of null alleles and no deviation observed from HWE. These 27 EST-SSRs can be used for olive diversity and popula-tion studies.
Comparing results of the clustering analysis with those obtained by genomic SSRs (Bandelj et al., 2004) re-vealed a similar distribution of olive varieties in related groups. Common genetic background was confirmed for all Tuscan olive varieties for oil use. The clustering analy-sis with new genic markers confirmed that Slovenian varieties “Zelenjak” and “Črnica” are closed related with Tuscan olives, as previously noted (Bandelj et al., 2004). Both genomic and functional EST-SSRs also showed that the predominant local variety “Istrska belica” had very low genetic similarities with other varieties. These results confirmed the equal ability and functionality of the use of genic SSRs for studies on genetic relationships in olives.
Alignment and functional annotation of all 923 ESTs containing microsatellite were performed using the Blast2GO tool. A total of 246 ESTs had homology with known proteins and were further annotated against the GO database. Ten newly developed EST-SSRs were asso-ciated with lipid biosynthetic process, embryo develop-ment, and cellular response to stress, while no GO terms were determined for other markers. However, other sequences (138, 15 %) were homologous to expressed, hypothetical/unknown/unnamed proteins, while 538 (58 %) SSR-containing sequences showed no hits.
A relatively high percentage of EST-SSRs without BLASTX hits could be attributed to the protein database used, while EST-SSRs are frequently positioned in UTR regions. When reviewing the location of 46 EST-SSRs, 65 % EST-SSRs were positioned in UTRs, and only 35 % was located in the coding region. Liu et al. (2013) have also observed higher density of di-, tri- and tetra-nucle-otide SSRs in UTRs. It has been noted that untranslated regions of mRNAs have crucial roles in many aspects of gene regulation (Mignone et al., 2002). In a study on rice and Arabidopsis, Fujimori et al. (2003) concluded that microsatellites are located at high frequency in the 5’-flanking region of plant genes and potentially acts as
factors to regulate gene expression. In contrast, micro-satellite expansion in the 3’ UTRs can cause transcrip-tion slippage and produce expanded mRNA (Li et al., 2004). An elevated percentage of sequences with no pu-tative function may also only be attributed to specifically evolved gene functions and exclusive characteristics to
O. europaea species, as reported by Alagna et al. (2009). The analysis of motifs of microsatellites in olive UTRs showed that tri- and di-nucleotides occurred in 35 % and 24 %, respectively. In CDSs, trinucleotide motifs were predominant (33 %). This result is in accordance with previous studies, which showed that selection against frameshift mutations limits nontriplet SSRs expansion in CDS regions (Metzgar et al., 2002).
In this study, we have demonstrated that a novel set of 46 EST-SSRs has good diversity properties, and we are convinced that it will be helpful in olive breeding programs, in the construction of linkage maps and it will aid in elucidating some biochemical pathways and physiological processes in olives. Furthermore, due to their possible transferability to the related species, EST-SSRs can also be used in the field of comparative ge-nomics. All sequencing data and developed primer pairs for genic markers are available to the olive community and all interested research groups through public NCBI databases.
References
Adawy, S.S.; Mokhtar, M.M.; Alsamman, A.M.; Sakr, M.M. 2015. Development of annotated EST-SSR database in olive (Olea europaea). Internation Journal of Science and Research 4: 1063-1073.
Alagna, F.; D’Agostino, N.; Torchia, L.; Servili, M.; Rao, R.; Pietrella, M.; Giuliano, G.; Chiusana, M.L.; Baldoni, L.; Perrotta, G. 2009. Comparative 454 pyrosequencing of transcripts from two olive genotypes during fruit development. BMC Genomics 10: 399.
Ali Hashmi, M.; Khan, A.; Hanif, M.; Fatooq, U.; Perveen, S. 2015. Traditional uses, phytochemistry, and pharmacology of Olea europaea (Olive). Evidence-Based Complementary and Alternative Medicine 2015: ID 541591.
Bandelj, D.; Jakše, J.; Javornik, B. 2004. Assessment of genetic variability of olive varieties by microsatellite and AFLP markers. Euphytica 136: 93-102.
Caroli, S.; Santoni, S.; Ronfort, J. 2011. AMaCAID: a useful tool for accurate marker choice for accession identification and discrimination. Molecular Ecology Resources 11: 733-738. Chen, C.; Zhou, P.; Choi, Y.A.; Huang, S.; Gmitter, F.G.J. 2006.
Mining and characterizing microsatellites from citrus ESTs. Theoretical and Applied Genetics 112: 1248-1257.
Chen, C.; Bock, C.H.; Beckman, T.G. 2014. Sequence analysis reveals genomic factors affecting EST-SSR primer performance and polymorphism. Molecular Genetics and Genomics 289: 1147-1156.
Cipriani, G.; Spadotto, A.; Jurman, I.; Di Gaspero, G.; Crespan, M.; Meneghetti, S.; Frare, E.; Vignani, R.; Cresti, M.; Morgante, M.; Pezzotti, M.; Pe, E.; Policriti, A.; Testolin, R. 2010. The SSR-based molecular profile of 1005 grapevine (Vitis vinifera L.) accessions uncovers new synonymy and parentages, and reveals a large admixture amongst varieties of different geographic origin. Theoretical and Applied Genetics 121: 1569-1585.
Corrado, G. 2016. Advances in DNA typing in the agro-food supply chain. Trends in Food Science & Technology 52: 80-89. Dakin, E.E.; Avise, J.C. 2004. Microsatellite null alleles in
parentage analysis. Heredity 93: 504-509.
De la Rosa, R.; Belaj, A.; Muñoz-Mérida, A.; Trelles, O.; Ortíz-Martín, I.; González-Plaza, J.J.; Valpuesta, V.; Beuzón, C.R. 2013. Development of EST-derived SSR markers with long-core repeat in olive and their use for paternity testing. Journal of the American Society for Horticultural Science 138: 290-296. Dillon, N.L.; Innes, D.J.; Bally, I.S.E.; Wright, C.L.; Devitt, L.C.;
Dietzgen, A.G. 2014. Expressed sequence tag-simple sequence repeat (EST-SSR) marker resources for diversity analysis of mango (Mangifera indica L.). Diversity 6: 72-87.
Essalouh, L.; El Aabidine, Z.; Contreras, S.; Ben Sadok, I.; Santoni, S.; Khadari, B.; Jakse, J.; Bandelj, D. 2014. Genomic and EST microsatellite loci development and use in olive: molecular tools for genetic mapping and association studies. Acta Horticulturae 1057: 543-550.
Fujimori, S.; Washio, T.; Higo, K.; Ohtomo, Y.; Murakami, K.; Matsubara, K.; Kawai, J.; Carninci, P.; Hayashizaki, Y.; Kikuchi, S.; Tomita, M. 2003. A novel feature of microsatellites in plants: a distribution gradient along the direction of transcription. FEBS Letters 554: 17-22.
Ghanbari, R.; Anwar, F.; Alkharfy, K.M.; Gilani, A.H.; Saari, N. 2012. Valuable nutrients and functional bioactives in different parts of olive (Olea europaea L.): a review. International Journal of Molecular Sciences 13: 3291-3340.
Gupta, P.K.; Rustgi, S.; Sharma, S.; Singh, R.; Kumar, N.; Balyan, S. 2003. Transferable EST-SSR markers for the study of polymorphism and genetic diversity in bread wheat. Molecular Genetics and Genomics 270: 315-323.
Huang, H.; Lu, J.; Ren, Z.; Hunter, W.; Dowd, S.E.; Dang, P. 2011. Mining and validating grape (Vitis L.) ESTs to develop EST-SSR markers for genotyping and mapping. Molecular Breeding 28: 241-254.
Jian, Z.H.; Liu, X.S.; Hu, J.B.; Chen, Y.H.; Feng, J.C. 2012. Mining microsatellite markers from public expressed sequence tag sequences for genetic diversity analysis in pomegranate. Journal of Genetics 9: 353-358.
Jiang, G.L. 2013. Molecular markers and marker-assisted breeding in plants. p. 45-84. In: Andersen, S.N., ed. Plant breeding from laboratories to fields. InTech, Rijeka, Croatia. DOI: http:// dx.doi.org/10.5772/52583.
Jung, S.; Abbott, A.; Jesudurai, C.; Tomkins, J.; Main, D. 2005. Frequency, type, distribution and annotation of simple sequence repeats in Rosaceae ESTs. Functional and Integrative Genomics 5: 136-143.
Kalia, R.K.; Rai, M.K.; Kali, S.; Singh, R.; Dhawan, A.K. 2011. Microsatellite markers: an overview of the recent progress in plants. Euphytica 177: 309-334.
Kanehisa, M.; Goto, S. 2000. KEGG: Kyoto Encyclopedia of Genes and Genomes. Nucleic Acids Research 28: 27-30.
Koressaar, T.; Remm, M. 2007. Enhancements and modifications of primer design program Primer3. Bioinformatics 23: 1289-1291.
Kump, B.; Javornik, B. 1996. Evaluation of genetic variability among common buckwheat (Fagopyrum esculentum Moench.) populations by RAPD markers. Plant Science 114: 149-158. La Malfa, S.; Curró, S.; Douglas, A.B.; Brugaletta, M.; Caruso,
M.; Gentile, A. 2014. Genetic diversity revealed by EST-SSR markers in carob tree (Ceratonia siliqua L.). Biochemical Systematics and Ecology 55: 205-211.
Lavee, S.; Avidan, B.; Ben-Ari, G. 2014. Trends in breeding new olive varieties in Israel for quality and economic management. Agricultural Science 5: 701-709.
Levene, H. 1949. On a matching problem in genetics. The Annals of Mathematical Statistics 20: 91-94.
Li, Y.C.; Korol, A.B.; Fahima, T.; Nevo, E. 2004. Microsatellite within genes: structure, function and evolution. Molecular Biology and Evolution 21: 991-1007.
Liu, S.R.; Li, W.Y.; Long, D.; Hu, C.G.; Zhang, J.Z. 2013. Development and characterization of genomic and expressed SSRs in citrus by genome-wide analysis. PloS One 8: e75149. Mantel, N. 1967. The detection of diseases clustering and a
generalized regression approach. Cancer Research 27: 209-220. Metzgar, D.; Liu, L.; Hansen, C.; Dybvig, K.; Wills, C. 2002.
Domain level differences in microsatellite distribution and content result from different relative rates of insertion and deletion mutations. Genome Research 12: 408-413.
Mignone, F.; Gissi, C.; Liuni, S.; Pesole, G. 2002. Untranslated regions of mRNAs. Genome Biology 3: reviews0004.1-0004.10. Milne, I.; Bayer, M.; Cardle, L.; Shaw, P.; Stephen, G.; Wright, F.;
Marshall, D. 2010. Tablet-next generation sequence assembly visualization. Bioinformatics 26: 401-402.
Muñoz-Mérida, A.; González-Plaza, J.J.; Cañada, A.; Blanco, A.M.; García-López, M.D.; Rodríguez, J.M.; Pedrola, L.; Sicardo, M.D.; Hernández, M.L.; De la Rosa, R.; Belaj, A.; Gil-Borja, M.; Luque, F.; Martínez-Rivas, J.M.; Pisano, D.G.; Trelles, O.; Valpuesta, V.; Beuzón, C.R. 2013. De Novo assembly and functional annotation of the olive (Olea europaea) transcriptome. DNA Research 20: 93-108.
Ozgenturk, N.O.; Oruc, F.; Sezerman, U.; Kucukural, A.; Korkut, S.V.; Toksoz, F.; Cemal, U. 2010. Generation and analysis of expressed sequence tags from Olea europaea L. Comparative and Functional Genomics 2010: ID 757512.
Pasqualone, A.; Montemurro, C.; di Rienzo, V.; Summo, C.; Paradiso, V.M.; Caponio, F. 2016. Evolution and perspectives of cultivar identification and traceability from tree to oil and table olives by means of DNA markers. Journal of the Science of Food and Agriculture 96: 3642-3657.
Rešetič, T.; Štajner, N.; Bandelj, D.; Javornik, B.; Jakše, J. 2013. Validation of candidate reference genes in RT-qPCR studies of developing olive fruit and expression analysis of four genes involved in fatty acids metabolism. Molecular Breeding 32: 211-222.
Schuelke, M. 2000. An economic method for the fluorescent labelling of PCR fragments. Nature Biotechnology 18: 233-234. Toth, G.; Gaspari, Z.; Jurka, J. 2000. Microsatellite in different
eukaryotic genomes: survey and analysis. Genome Research 10: 967-981.
Untergrasser, A.; Cutcutache, I.; Koressaar, T.; Ye, J.; Faircloth, B.C.; Remm, M.; Rozen, S.G. 2012. Primer3: new capabilities and interfaces. Nucleic Acids Research 40: e115.
Varshney, R.K.; Graner, A.; Sorrells, M.E. 2005. Genic microsatellite markers in plants: features and applications. Trends in Biotechnology 23: 48-55.
Vendramin, E.; Dettori, M.T.; Giovinazzi, J.; Micali, S.; Quarta, R.; Verde, I. 2007. A set of EST-SSRs isolated from peach fruit transcriptome and their transportability across Prunus species. Molecular Ecology Resources 7: 307-310.
Zhang, H.; Wei, L.; Miao, H.; Zhang, T.; Wang, C. 2012. Development and validation of genic-SSR markers in sesame by RNA-seq. BMC Genomics 13: 316.
Zhang, M.; Fan, L.; Liu, O.; Song, Y.; Wei, S.; Zhang, S.; Wu, J. 2013. A novel set of EST-derived SSR markers for pear and cross-species transferability in Rosaceae. Plant Molecular Biology Reporter 32: 290-302.