Braz. J. of Develop., Curitiba, v. 5, n. 12, p.32060-32078 dec 2019 . ISSN 2525-8761
Filter Type Bag Performance for Separation of Herbicide Residues
Desempenho de Filtro Tipo Bolsa na Separação de Resíduos de Herbicidas
Filter Type Performance Bag for Separation of Herbicide Residues
Bag Type Filter Performance in Herbicide Waste Separation
DOI:10.34117/bjdv5n12-285
Recebimento dos originais: 10/11/2019 Aceitação para publicação: 19/12/2019
Daniela Teixeira Chaves
M.Sc. Professional Chemical Engineering Uberaba University - UNIUBE, BRAZIL
Endereço: Av. Nenê Sabino, 1801 – Bairro Universitário, Uberaba – MG, Brasil Email: [email protected]
José Roberto Delalibera Finzer
Dr. Food Engineering
Uberaba University - UNIUBE, BRAZIL
Endereço: Av. Nenê Sabino, 1801 – Bairro Universitário, Uberaba – MG, Brasil Email: [email protected]
ABSTRACT
In the agricultural sector, advances in recent years can be related to the evolution of equipment, seeds and agrochemicals. In the production process of liquid agrochemicals, there may be particulates that are not of interest and thus, need to be removed. Removal of solid particles from a liquid medium is by filtration. The bag or bag filter has a simple, low cost and easy access for cleaning. In order to evaluate the efficiency of a filtration system, determination of the medium resistance, determination of the specific strength of the cake and the efficiency and characteristics of the pump used for liquid transfer are important calculations. In a productive process of liquid herbicides, a study was carried out to calculate the efficiency of the filter system (bag type). By calculating the area of the filter element (0.460 m²), the density of the cake (0.99 g.cm−3), the concentration of solids in the suspension (0.00760 kg. m−3),
the cake mass per unit area (0.661 kg. m−2), average cake thickness (0.09 cm), cake porosity (27%), specific cake strength (5.664x10⁷ m. kg−1) and medium strength (94160993 m−¹), the viability of the filtration system in the removal of particulates from herbicides was verified.
Braz. J. of Develop., Curitiba, v. 5, n. 12, p.32060-32078 dec 2019 . ISSN 2525-8761
RESUMO
No setor agrícola, os avanços nos últimos anos podem estar relacionados à evolução de equipamentos, sementes e agroquímicos. No processo de produção de agroquímicos líquidos, pode haver partículas que não são de interesse e, portanto, precisam ser removidas. A remoção de partículas sólidas de um meio líquido é por filtração. O filtro bolsa tem um acesso simples, de baixo custo e fácil limpeza. Para avaliar a eficiência de um sistema de filtragem, são cálculos importantes: a determinação da resistência do meio, a determinação da resistência específica do torta e a eficiência e as características da bomba usada para transferência de líquidos. Em um processo produtivo de herbicidas líquidos, foi realizado um estudo para calcular a eficiência do sistema de filtração (tipo bolsa). Calculando a área do elemento filtrante (0,460 m²), a densidade da torta (0.99 g.cm−3), a concentração de sólidos na
suspensão (0.00760 kg. m−3), a massa da torta por unidade de área (0.661 kg. m−2), a
espessura média da torta (0,09 cm), porosidade da torta (27%), resistência específica da torta (5.664x10⁷ m. kg−1) e resistência média 94160993 m−¹), verificou-se a viabilidade do
sistema de filtração na remoção de particulados dos herbicidas.
Palavras-chave: Filtração industrial, Filtro tipo bolsa, Filtração sólido-líquido.
1 INTRODUCTION
Most large-scale industrial processes involve some solid-liquid separation step. In these separation stages, various forms of technologies and equipment are involved [1]. In the production of liquid agrochemicals, there may be non-reactive particulates from raw materials and the process that need to be removed to ensure the quality of the final product.
The most impurities found in this study are from the synthesis of the active ingredient used for the formulation. The supplier, when carrying out the synthesis, with the limitations of the process he has, does not completely remove the catalyst. In the active ingredient it is not possible to visually notice these catalyst particles, but in carrying out the glyphosate formulation, the catalyst forms a residue visible to the naked eye [2].
The removal of particulates in herbicides must have a high efficiency since the quality of the product obtained is directly linked [3]. The filtration should be effective in order not to allow particles visible to the naked eye and which may interfere visually with the appearance of the finished product reaching the final consumer. The pump used for the transfer is a centrifugal type pump, thus, in the filtration, there is variation of flow and pressure over time. Where there is a need for separation of certain components contained in a homogeneous mixture, the differences in properties of the constituents of the blend are used to achieve their purpose. For this, it is essential to examine the various chemical and physical properties of the
Braz. J. of Develop., Curitiba, v. 5, n. 12, p.32060-32078 dec 2019 . ISSN 2525-8761 constituents of the blend to identify which one offers the greatest difference between the components in order to propose an efficient and economical separation form. Other factors to be analyzed for determining the separation step are the energy requirement, the cost and availability of the materials [4] [5].
The filtration system can be carried out with different types of filters, which can be operated in a variety of ways [6]. The bag or pouch filtration system consists of a simple solid-liquid separatio mechanism. This type of filter has low operating cost, quick access to the filter element and is an excellent option to optimize the filtration step.
The objective of this work was to study the filtration performance for the removal of non-reactive particles in herbicides, as well as the factors influencing the filtration, characteristics of the type of equipment used (bag type), the filtration equations and the feasibility study presentation of the filtration system.
2 DEVELOPMENT
The production process of herbicides is by batch. Different batches of raw materials are used in present study and to obtain reliable results all experiments were done in triplicate. To determine the particle size of the material to be filtered, samples were collected in triplicate of the residue and a study was carried out on the Cilas 1190 particle measuring equipment. The Cilas 1190 particle meter has multiple lasers technology, which operate through diffraction, variety of particle sizes.
To determine the particle size in the Cilas 1190 particle meter equipment (Fig. 1), 200 mL of a sample of the wet residue to be filtered was collected and 2 mL of stirred block copolymer was added .
Braz. J. of Develop., Curitiba, v. 5, n. 12, p.32060-32078 dec 2019 . ISSN 2525-8761
Fig. 1: Particle Meter Operation [2]
The filtration tests were carried out with the help of a filter installed to the study the efficiency of removal of particulates of herbicides (Fig. 2), the selection of the filter element used and the opening of the mesh [2].
Fig. 2: Bag Filter Test
The selected polyester filter element has been manufactured from synthetic fibers of high porosity three-dimensional structure, thus forming micronics pathways which retain large amounts of solid and / or gelatinous particles. This filter element is used at ambient temperatures [7]. To verify the operation of this element, the temperature of the finished product was measured prior to packaging. The tests were performed in triplicate.
Braz. J. of Develop., Curitiba, v. 5, n. 12, p.32060-32078 dec 2019 . ISSN 2525-8761 2.1 FILTER ELEMENT AREA
Bag or bag-type filter elements are cylindrical in shape with one of the cast bases. Thus, the area of the filter element can be calculated (1), (2) and (3).
A base = π*r²
(1) A side = 2π*r*h
(2)
Filter Element Area (A) = A base + A side (3)
2.2 CAKE MOISTURE
With the aid of a beaker, the volume of part of the cake of different batches and the use of an analytical balance was determined by the mass of the samples. With the volume and mass of the samples determined, with the aid of an oven maintained at 105 ° C, the samples were dehydrated until all the water was eliminated and the mass remained constant. The dehydration step lasted about 24 hours.
2.3 CONCENTRATION OF SOLIDS IN SUSPENSION
The concentration of solids in suspension (c) is given by the mass of solids (m) per unit volume of filtrate (V) in kg.
2.4 CAKE MASS PER UNIT AREA
To quantify the cake mass (w) per unit area (A), the concentration of solids in suspension (c) as well as the volume of filtrate (V) (4) must be known.
𝑤𝐴 = 𝑐𝑉
Braz. J. of Develop., Curitiba, v. 5, n. 12, p.32060-32078 dec 2019 . ISSN 2525-8761 2.5 MEAN APPARENT DENSITY
To determine the mean apparent density of the wet cake of the filter media (ρ), the volume (V) was quantified using a beaker and the mass (m) by weighing the analytical balance material. Considering (5), we have the average apparent density of the wet cake.
𝜌 =𝑚
𝑉
(5)
2.6 MEAN APPARENT DENSITY
The average thickness of the cake is related to the volume of cake retained in the filter element (V) and the area of this filter element (A) (6).
Average thickness = 𝑉
𝐴
(6)
To calculate the volume of cake retained in the filter element it is necessary to initially obtain the cake mass retained in this same element. According to the data collected, the cake mass present in the filter element was identified as the mass of the cake per unit of filtration area (w) multiplied by the bag area (A), (7).
Cake retained in the filter element = wA (7)
After the determination of the cake mass in the filter element and through the density value of the cake (ρ), the cake volume was obtained in the filter element (V) (5). Thus, the average thickness of the wet cake was determined through (6).
2.7 SATURATION CURVE
The filter element has by its saturation determination the increase of the inlet pressure of 1.5 kg. cm−2 to 2 kg.cm−2, therefore, this contributed as a technical factor of operation. In
different batches, data of the input pressure with respect to time were quantified in triplicate [8].
Braz. J. of Develop., Curitiba, v. 5, n. 12, p.32060-32078 dec 2019 . ISSN 2525-8761 The pump used to transfer the finished product to the filtration system is a centrifugal pump with a radially divided spiral body. This model operates with a rotation of 3500 rpm, with a nominal rotor diameter of 160 mm and a rotor width of 5 mm.
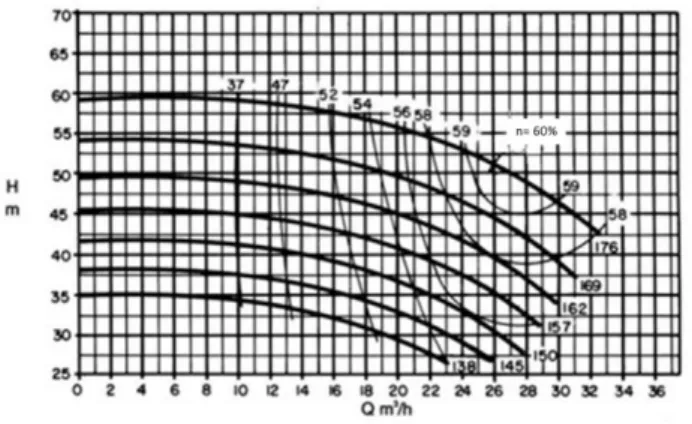
According to the characteristic curve of the pump used for the transfer (Fig. 3), with nominal rotor diameter 157 mm and the pressure differential being equal to the manometric pressure quantified in the filter plus the pressure drop, the manometric height of the for each time-quantized pressure.
Fig. 3: Pump Efficiency Characteristic Curve (KSB, 2018)
2.8 CAKE POROSITY
The cake porosity (ε) can be calculated by measuring the volume of voids by the volume of the cake. In turn, the void volume can be quantified by evaporating the water present in a sample of the cake.
To obtain the porosity of the cake from this study, the cake density was used. Through the density of the cake, the volume of voids in the sample was calculated (8), where (ρ) is the mean density of the filter medium cake, (m) the mass of solids in the suspension and (V1) the volume of voids.
𝜌 = 𝑚 𝑉1
(8)
Whit the volume of voids in the sample, the cake porosity was determined (9).
𝜀 = Voids volume/Cake volume
Braz. J. of Develop., Curitiba, v. 5, n. 12, p.32060-32078 dec 2019 . ISSN 2525-8761 2.9 CAKE SPECIFIC STRENGTH AND RESISTANCE OF THE FILTER MEDIA
The filter of bag type used in this study has as one of its characteristics the variation of the pressure with the time, indicating when saturation of the filter element occurs. The flow characteristics can be determined by the pump curve used in the transfer process.
In this study, a centrifugal type pump was used. This pump model can be considered, in filtration systems, responsible for the flow variation. As the filter element receives the particulate from the suspension to be filtered and the cake is formed, there is a slight increase in system pressure, thus there is a difficulty for the fluid to follow the flow and a slight decrease in flow occurs.
As the flow rate variation in this study is small, one can calculate the specific cake resistance and the specific resistance of the medium through the basic design equations for variable pressure and constant flow using a mean of filtration flow.
For this, it is necessary to calculate the velocity of the filtrate (v) through the data of average flow (Q) and the area of the filter element (A) (10).
𝑣 =𝑄
𝐴
(10)
Using the simplification of the general equation of filtration (11) and through (12) and (13) we get (14). Through the graph that relates the pressure differential and the filtration time, through the trend line and the equation of the line, we find bv.
𝑄 = 𝐴∆𝑃 𝜇(𝑅+𝑅𝑐) (11) 𝑏 = 𝜇𝑅 (12) 𝑄 = ∆𝑝(𝑡)𝐴 𝛼𝜇𝑐(𝑉(𝑡)𝐴 )+𝜇𝑅 (13) 𝑣 =𝑄 𝐴 (14)
Using the viscosity of the suspension (μ), the specific resistance of the medium (R) can be found through (12). Using the line equation of the graph relating the pressure differential
Braz. J. of Develop., Curitiba, v. 5, n. 12, p.32060-32078 dec 2019 . ISSN 2525-8761 and the filtration time it is possible to obtain 𝑎𝑣2and thus find a. Using the viscosity of the
filtrate (μ) and the solids concentration in suspension (c), it is possible to obtain the specific cake resistance (α) (15).
𝑎 = 𝛼𝜇𝑐 (15)
3 RESULTS AND DISCUSSION
According to the characteristics of this herbicide, the residue tends to remain with its agglomerated particles, so when carrying out the measurement, the block copolymer is used to perform the measurement with the real size of each particle a be retained.
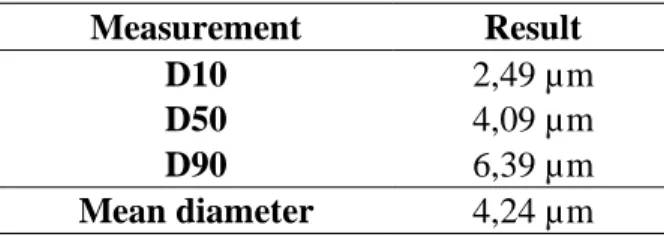
For this model of equipment, the measurement is done according to the percentage of particle diameter described in (Table 1). The 10% or 10% diameter indicates the maximum diameter presented by 10% of the particles. Already the D50 or diameter at 50% corresponds to the maximum diameter presented by 50% of the particles. The 90% or 90% diameter corresponds to the maximum diameter presented by 90% of the particles.
Table 1 - Grain size distribution of the residue Measurement Result
D10 2,49 µm
D50 4,09 µm
D90 6,39 µm
Mean diameter 4,24 µm
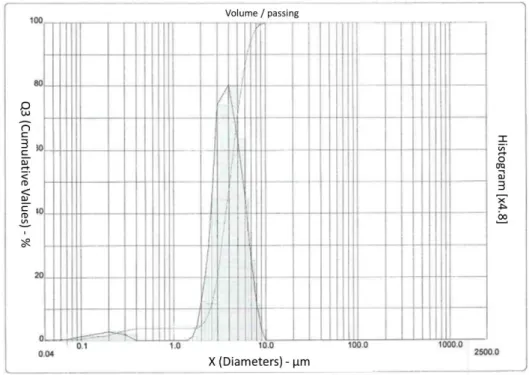
According to the particle size distribution (Fig. 4), it was observed that of all particles analyzed, the maximum diameter found was 10 μm, which refers to 0.68% of the particles.
Braz. J. of Develop., Curitiba, v. 5, n. 12, p.32060-32078 dec 2019 . ISSN 2525-8761
Fig. 4: Particle size distribution
As the residue to be withdrawn has no chemically harmful interaction with the herbicides, the main role of the filter element in this system is to act in the retention of the undesired particles present in the suspension which are visible to the naked eye.
According to the measurements carried out, Fig. 5 is elaborated, with the data of the maximum diameter presented by 10% of the particles of (2.49 μm), the one presented by 50% of the particles (4,09 μm) and the one presented by 90 % of the particles (6.39 μm).
In most studies for particle size determination D90 is used. In this study, which has the initial objective of removing all particles from the suspension, the maximum diameter of 10% of particles, D10, corresponding to 2.49 μm is considered.
According to the maximum diameter of 10% of the particles (D10), the filter element to be used should remove particles of 2.49 μm in diameter, that is, it must have apertures smaller than this value. The bags available in the market with this opening are made of polyester. These bags have the requirement that the fluid to be filtered is at a temperature close to the ambient temperature.
The mean temperature was determined by measuring in triplicate at 31°C. The requirement for use of the polyester filter, according to the manufacturer, is that the fluid is at room temperature. Thus, the viability of the filter element in polyester was confirmed.
Braz. J. of Develop., Curitiba, v. 5, n. 12, p.32060-32078 dec 2019 . ISSN 2525-8761 When conducting the filtration test with the 1 μm polyester filter element, it was found that the filter pressure at the initial time of filtration was 6 kg.𝑐m−2, causing vibrations in the
pipelines used to transport the fluid. For reasons of process safety, it was identified that the filter with the 1 μm aperture could not be used.
Through the process restrictions for using a 1 μm filter element, since the particles to be withdrawn from the production process are not chemically harmful thereto, it has been found desirable to remove only the particles visible to the naked eye.
In the formulation of the herbicide, it was found that the particles to be withdrawn from the production process agglomerated. Thereby it was found that the 25 μm aperture polyester filter element was suitable for removing the naked eye visible particles from the suspension as discussed above.
3.1 FILTER ELEMENT AREA
According to the specifications provided by the manufacturer (length and width) and by measuring the diameter of the filter element, the base area is 0,460 m².
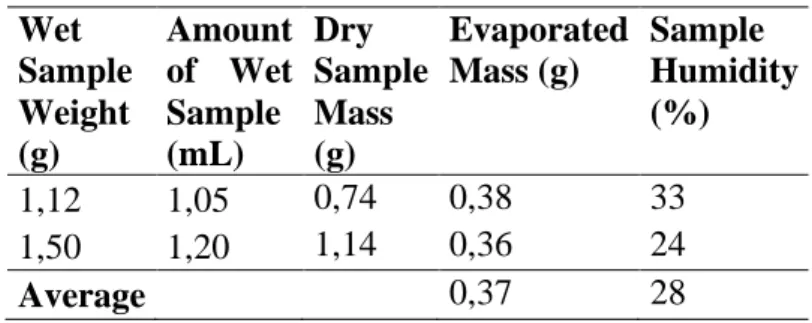
3.2 CAKE MOISTURE
The moisture of the cake was determined by dehydrating the samples in an oven at 105 ° C until the mass remained constant, Table 2.
Table 2 – Cake moisture Wet Sample Weight (g) Amount of Wet Sample (mL) Dry Sample Mass (g) Evaporated Mass (g) Sample Humidity (%) 1,12 1,05 0,74 0,38 33 1,50 1,20 1,14 0,36 24 Average 0,37 28
3.3 CONCENTRATION OF SOLIDS IN SUSPENSION
Based on the data in Table 3 and in equations, the cake mass per unit area in 0.661 kg.m−2.
Braz. J. of Develop., Curitiba, v. 5, n. 12, p.32060-32078 dec 2019 . ISSN 2525-8761
Table 3 - Concentration of Solids in Suspension Filtered Volume (m³) Mass Pre-Battered Filter (kg) Mass Post-Filter (kg) Mass of Wet Solids in Suspension (kg) Concentration Dry Solids in Suspension (kg.𝐦−𝟑) 40 1,02 1,35 0,33 0,00593 40 1,02 1,45 0,43 0,00773 40 1,02 1,53 0,51 0,00915 Average 0,00760
3.4 WET CAKE DENSITY
Considering the presented equation, we have the density of the wet cake in the table 4.
Table 4 – Wet Cake Density
Sample Mass (g) Sample Volume (mL) Density (g.𝐜𝐦−𝟑) 2,73 2,9 0,94 4,52 4,2 1,07 4,05 4,1 0,98 Average 0,99
3.5 CAKE DOUGH IN THE FILTER ELEMENT
According to the data collected, the cake mass present in the filter element was identified as the mass of the cake per unit area (w) multiplied by the bag area (A), 432.2 g.
3.6 AVERAGE THICKNESS OF THE CAKE
After determining the wet cake mass in the filter element with the cake density (ρ), the volume of wet cake in the filter element (V) was calculated through in 427,5 cm³ and the average thickness of the cake in 0.09 cm.
Braz. J. of Develop., Curitiba, v. 5, n. 12, p.32060-32078 dec 2019 . ISSN 2525-8761 3.7 SATURATION CURVE
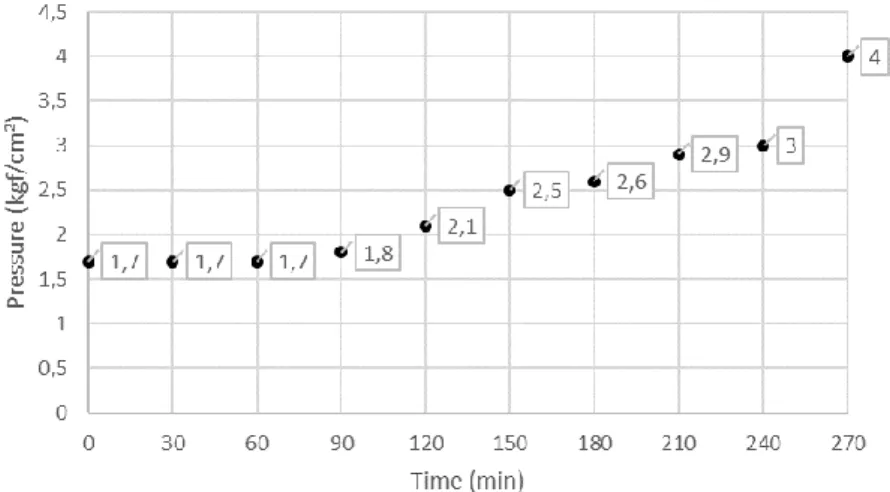
The filtrate is discharged at atmospheric pressure. Therefore, the measured gauge pressure value competes with the filtration pressure difference. The pressure data were quantified at two points: at the transfer pump and the filter, and the pump pressure data being very close to the filter (about 0.5 kg.𝑐m−2 of pressure drop) (Table 5).
Table 5 – Filter pressure with time Time
(min) Filter Pressure (kg. 𝐜𝐦 −𝟐) 1 2 3 Average 0 1,8 1,7 1,5 1,7 30 1,9 1,8 1,5 1,7 60 1,9 1,8 1,5 1,7 90 2 2 1,5 1,8 120 2 2,2 2 2,1 150 2,2 2,3 3 2,5 180 2,2 2,5 3 2,6 210 2,4 3 3,2 2,9 240 2,4 3 3,5 3 270 4 4 4 4
With this data, the pressure saturation curve was constructed (Fig 5), which identifies the average time for changing the filter element according to the pressure differential indicated by the filter manufacturer (about 2 kg.cm−2). According to the curve data, it would be necessary
to change the filter element every 270 minutes of constant operation.
Braz. J. of Develop., Curitiba, v. 5, n. 12, p.32060-32078 dec 2019 . ISSN 2525-8761 At the end of the transfer of a batch, the filter showed a sudden increase of pressure. This rapid increase is related to the residual particles which, for the most part, have a lower density than the herbicide in question and thus supernatants are found in the tank used for pre-transfer storage.
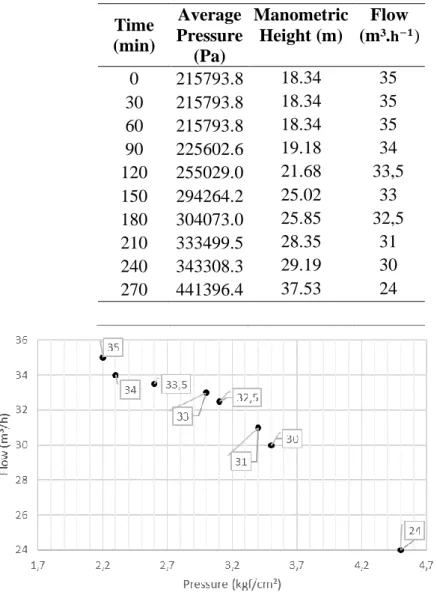
Considering the density of the herbicide (1.20 g. cm−3), pressure loss of about 0.5
kg. cm−2 and the Fig. 6, there is the Table 6.
Table 6 – Flow according to pressure Time (min) Average Pressure (Pa) Manometric Height (m) Flow (m³.𝐡−𝟏) 0 215793.8 18.34 35 30 215793.8 18.34 35 60 215793.8 18.34 35 90 225602.6 19.18 34 120 255029.0 21.68 33,5 150 294264.2 25.02 33 180 304073.0 25.85 32,5 210 333499.5 28.35 31 240 343308.3 29.19 30 270 441396.4 37.53 24
Fig. 6: Flow in relation to pressure
According to the reading of the pump efficiency chart (Fig. 3), and the supplier's recommendation that, according to the rotor width (5 mm), the efficiency of the pump is reduced by 3 points, the maximum efficiency achieved for this model is 53%.
Braz. J. of Develop., Curitiba, v. 5, n. 12, p.32060-32078 dec 2019 . ISSN 2525-8761 3.8 CAKE POROSITY
For the cake porosity of this study, we considered the data in Table 3, and also that the void volume is equal to the evaporated herbicide volume. Through the herbicide density (1.20 g. cm−3), we found the volume of empty spaces in the sample (8), 0,308 cm³. Finding the void
volume in the sample, the porosity of the cake was determined considering the volume of the wet cake in Table 3 (9), 27 %.
3.9 CAKE SPECIFIC STRENGTH AND RESISTANCE OF THE FILTER MEDIA
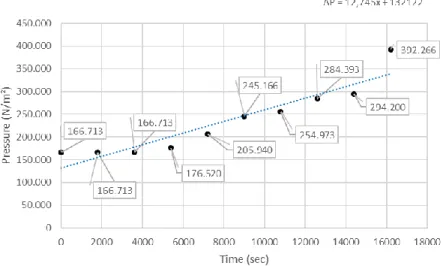
In order to determine the specific resistance of the cake and the specific resistance of the medium it is necessary to understand if the filtration occurs at constant or variable pressure and if the inlet flow of the suspension varies. For this, it is necessary to calculate the filtrate velocity (v) through the average flow data (Q) and the filter element area (A) (10), 0.0211 m. s−¹.
Using the simplification of the general filtration equation (11), we have (12), (13) and (14). Through the graph that relates the pressure differential and the filtration time, it is possible, through the trend line and the line equation, to obtain bv (Fig. 7).
Fig. 7: Pressure over time
Using the viscosity of the suspension μ = 0.0665 Pa.s, we have the specific resistance of the medium (R) (14), 94160993 m−¹. where (b), 6261706 N. m−3. s, is a constant and (µ)
Braz. J. of Develop., Curitiba, v. 5, n. 12, p.32060-32078 dec 2019 . ISSN 2525-8761 Using a.v², we have (a) (28626 Pa. s. m−2) is a constant, (v) the surface velocity,
according to the equation of the line, 12.745 s.
Using the viscosity of the suspension μ = 0.0665 Pa.s and the concentration of solids in the suspension (c) 0.00760 kg. m−3, we have the specific resistance of the cake (α),
5.664x10⁷ m. kg−1, (15).
Since the density of the residues (cake) is calculated as 0.99 g.cm−3and the density of
herbicides being on average 1.20 g.cm−3, the residue to be removed by the filtration system,
remains supernatant in the suspension (Fig. 8). With the installation of the bag filter, it was noted that the particulate, previously found supernatant, was actually retained in the filtration system (Fig. 9), thus visually proving the efficiency of this system.
Fig. 8: Supernatant Residue in Storage Tank (Chaves, 2018)
Fig. 9: Residues Free Storage Tank (Chaves,2018)
Calculations also determined the concentration of solids in the suspension, 0.00760 kg. m−3. Considering that in a 40 m³ batch, there is an average of 0.304 kg of residues to be
Braz. J. of Develop., Curitiba, v. 5, n. 12, p.32060-32078 dec 2019 . ISSN 2525-8761 / volume by the cake density (0.99) is calculated. g.cm−3, these represent on average
0.000007% of the volume of a batch.
4 CONCLUSION
It was quantified when determining the saturation curve of the filter element in relation to the pressure, that it was necessary to change the filter element in an average of 270 minutes of operation. Thus, it was necessary to install a parallel filtration system to reduce the process downtimes. With only one filter, when it reaches saturation, transfer of the suspension would be interrupted for filter element exchange, thus impacting the filling of the finished product. Already with the system in parallel would be available two filters, that is, the fluid would pass only one filter at a time, but when reaching the saturation of this filter, the second would be available for flow reversal without impacting the transfer of the finished product.
When reading the efficiency chart of the pump used to transfer herbicides to the filtration system, an efficiency of 53% of the equipment was verified. The maximum efficiency of this pump model according to the supplier is 60%, so the actual efficiency is within an appropriate operating range.
In relation to the calculations of cake mass per unit area of the filter element, a result of 0.661 kg. m−2, was obtained, which characterizes a cake of thin thickness (0.09 cm). These
calculations were performed according to the dimensions provided by the filter element manufacturer and the calculation of its area.
For the porosity data, which relates the volume of voids in the cake volume, the evaporation of all the water contained in the sample was maintained for about 24 hours in a greenhouse at 105ºC. Cake density was used to obtain the evaporated water volume of the sample and thus a 27% porosity was quantified.
For the filtrate velocity, which is given according to the flow rate by the area of the filter element, a value of 0.0211 m. s−¹ was found. In this calculation, since the variation of
the operating flow according to Table 5 is small, we considered the average flow rate for the calculations.
According to the collected data and observed process characteristics, the calculations of this filtration system were given at constant flow and variable pressure. The main calculations to determine the efficiency of the filtration system were performed using data on the filter element area, system flow, suspension solids concentration and cake density. The
Braz. J. of Develop., Curitiba, v. 5, n. 12, p.32060-32078 dec 2019 . ISSN 2525-8761 resistance of the medium (R) was determined at 94160993 m−¹. The specific cake resistance
(α) was calculated at 5.664x10⁷ m. kg−1.
The data found in this study are unique, ie, making the comparison with other filtration systems becomes infeasible because each system has singular characteristics. Nevertheless, through visual filtrate observations and efficiency calculations, this system is considered as efficient.
AGRADECIMENTOS
Os autores agradecem à Fundação de Amparo à Pesquisa de Minas Gerais - FAPEMIG e à Universidade de Uberaba - UNIUBE, pelo suporte disponível para elaboração deste trabalho.
REFERENCES
RUSHTON, Albert; WARD, Anthony S.; HOLDICH, Richard G. Solid-Liquid Filtration and Separation Technology. 2. ed. Federal Republic of Germany: Wiley-Vch, 2000.
CHAVES, Daniela T. Residues separations by filtration in herbicide manufacture. Masters dissertation. UNIUBE. 2018. 59 p.
DAS, Amal Chandra; DEBNATH, Anjan; MUKHERJEE, Debatosh. Effect of the herbicides oxadiazon and oxyfluorfen on phosphates solubilizing microorganisms and their persistence in rice fields. Chemosphere, v. 53, n. 5, p. 217-221. 2003.
SVAROVSKY, Ladislav. et.al. Solid-Liquid Separation. 4. ed. United States of America: Butterworth Heinemann, 2000.
FOUST, Alan. S., WENZEL, Leonard A., CLUMP, Curtis W., MAUS, Louis., ANDERSEN, Bryce L. Princípios das Operações Unitárias. 2. ed. Rio de Janeiro: Ed LTC, 1982.
Braz. J. of Develop., Curitiba, v. 5, n. 12, p.32060-32078 dec 2019 . ISSN 2525-8761 RUSHTON, Albert; WARD, Anthony S.; HOLDICH, Richard G. Solid-Liquid Filtration and Separation Technology. 2. ed. Federal Republic of Germany: Wiley-Vch, 2000.
TECHNICAL FILTER. Bag Filtration. Products and Solutions. Available at: <http://technicalfilter.com.br/produtos/filtracao-por-bolsa/>. Accessed on: jan. 2018.
MICRONLINE FILTERS. Industrial filters. Micronline Filters. Available at: <https://www.micronlinefiltros.com/linhasprodutos>. Accessed on: jan. 2018.
![Fig. 1: Particle Meter Operation [2]](https://thumb-eu.123doks.com/thumbv2/123dok_br/18002636.857364/4.892.235.670.105.450/fig-particle-meter-operation.webp)