8th World Conference on Experimental Heat Transfer, Fluid Mechanics, and Thermodynamics June 16-20, 2013, Lisbon, Portugal
EXPERIMENTAL STUDY AND NUMERICAL MODELING OF THE
THERMAL PERFORMANCE OF COLD ROOMS FOR STORAGE OF MEAT
PRODUCTS
Rodrigo Campos*, Emanuel Bastos*, Pedro Dinis Gaspar* and Pedro Dinho da Silva*
* University of Beira Interior, Covilhã 6200-101, Portugal E-mail : [email protected]
ABSTRACT
This paper contributes to the energy efficiency and thermal performance improvement in cold rooms used for conservation and storage of meat products, commonly used in the agro industrial sector. An experimental analysis of the thermal performance of a cold room in the Covilhã region (Portugal) is developed, verifying its external conditions and construction parameters. A steady state 3D CFD model of the cold room is developed, allowing the detailed evaluation of the airflow and heat transfer. The CFD model setup required the definition of a physical-mathematical model based on the equations of continuity, momentum and energy.
The comparison of numerical and experimental results allowed the validation of the CFD model. Thus, a parametric study is developed, which consists in changing the boundary condition values at the discharge grilles of evaporators. The parametric predictions show that the cold system, for product loading defined on the experimental analysis, is oversized, thus enabling the modification of the discharge air temperature and velocity. In this modification, the energy consumption is reduced maintaining similar thermal performance and ensuring the food safety. Thus, it is predicted an improvement of the energy efficiency and a consequent savings of environmental resources, energy and financial resources.
Keywords : Energy efficiency, Thermal performance, Cold rooms, CFD, Experimental study 1. INTRODUCTION
This paper has the main objective of contributing to the study of improving energy efficiency and thermal performance in cold rooms used for conservation and storage of meat products, commonly used in the agro industrial sector. Within this framework are addressed several issues related to energy efficiency, including the guidelines implemented in Europe in order to reach the goal of improving energy efficiency. The “20-20-20” policy defines that 20% of energy consumption should be from renewable sources, the energy efficiency must be improved in 20% and the emission of greenhouse gases must be reduced in 20%.
The importance of refrigeration in the agro industrial sector is huge. Without it, the products wouldn’t conserve time enough to arrive customer’s home in proper safety conditions. Also, the cold prevents the bacterial development in products, ensuring public health.
There are several experimental and numerical studies focusing the analysis of thermal performance and energy efficiency of cold rooms and stores. Hoang et al. [1] investigated the airflow inside a cold store using Computational Fluid Dynamics (CFD). The airflow model is based on the steady state incompressible, Reynolds-averaged Navier-Stokes equations. The turbulence is taken into account using a k- model. The standard as well as the Renormalisation-Group (RNG) version of the k- model is investigated.
The forced-circulation air cooler unit is modelled with an appropriate body force and resistance, corresponding to the characteristics of the fan and the tube-bank evaporator. The validation of the model has been performed by a comparison of
the calculated time-averaged velocity magnitudes with the mean velocities measured by means of a hot-film type omni-directional velocity sensor. A relative error on the calculated air velocities of 26% was observed.
So, it was shown a qualitative insight into the airflow pattern for different product stacks, different fan rotation speeds and different room designs, without the need for additional experimental determination of boundary conditions for the velocity. The main deficiencies of the airflow pattern, which cause quality losses in a ventilated space, can be investigated.
Chen et al. [2] developed an empirical model based on Tamm’s equation to predict the rate of air infiltration through doors into refrigerated buildings. The model sums the contributions of air-tightness, air infiltration due to door openings and the additional air exchange caused by forklift traffic through the doors. The model was validated against measured air infiltration rates through rapid-roll and sliding doors into 7 commercial coldstores with sizes ranging from 740 to 12,000 m3operating at temperatures ranging from 3.3 ªC to
–21.8 ºC.
Foster et al. [3] developed a CFD model of air movement through a doorway that was verified against conventional and laser Doppler anemometry (LDA) measurements. The CFD model has been shown to be generally accurate, however, there are areas where the accuracy is less than perfect. For example the CFD model predicted the shape of the vertical profile accurately, although it under-predicted the maximum velocity by 0.1 m/s and it predicted the height at which the airflow changed direction to be 40 mm lower than was measured by the LDA. These authors performed further research studies (Foster et al. [4]) for the measurements of infiltration through different size
entrances of a cold store at two different cold store temperatures. The experimental results were compared against established analytical models and CFD models. The analytical and CFD models generally tended to over predict the infiltration. The analytical model developed by Gosney and Olama [5] provided the closest comparison with the various experiments. The CFD models were more accurate than the fundamental analytical models but less accurate than those based on a semi-empirical approach. For the experimental configurations examined, CFD offer no real advantage over these empirical analytical models. If the conditions were such that the infiltration rate changed with time or if door protection devices (e.g. air curtains) were used, CFD would become much more advantageous in predicting infiltration.
Following the same research line, Foster et al. [6] evaluated the effectiveness of a 1.0 m wide air curtain fitted over a 1.36 m wide entrance to a cold store. The results show that careful setting up of the air curtain (adjusting the jet velocity and angle) was needed, to achieve an effectiveness of 0.77 compared to the initial value of only 0.31 as set by the installer. An analytical model to predict the optimum jet velocity was compared to measured data. A 2D CFD model predicted a maximum effectiveness of 0.84 and showed how the effectiveness of the curtain was related to the shape of the jet and how this varied with jet velocity and door open duration. Additionally, a study was developed to compare the measured effectiveness of an air curtain device at different jet velocities against a three-dimensional CFD model (Foster et al. [7]). The doorway where the air curtain device was installed was not as wide as the entrance and had a geometry that encouraged 3-D flow. Through experimental testing, the air curtain was setup to achieve an effectiveness up to 0.71, when the initial value of 0.31 was by the air curtain device installer. The 3-D CFD model predicted the infiltration through the entrance with no air curtain to an accuracy of within 20–32%. The predicted effectiveness of the air curtain at different jet velocities was 0.10 to 0.15 lower than measured. The shape of the effectiveness curve against jet velocity was well predicted. CFD modelling shown that the flow from this air curtain cannot be considered as 2-D. The central part of the jet is deflected away from the cold store by the Coanda effect caused by the air curtain device’s fan body. The edges of the jet are deflected into the cold store by the stack pressures and turn into the void caused by the deflected central jet.
Nahor et al. [8] developed a transient three-dimensional CFD model to calculate the velocity, temperature and moisture distribution in an existing empty and loaded cool store. The dynamic behaviour of the fan and cooler was modelled. The model accounted for turbulence by means of the standard k-3 model with standard wall profiles. The model was validated by means of velocity, air and product temperature. An average accuracy of 22% on the velocity magnitudes inside the empty cold store was achieved and the predicted temperature distribution was more uniform than predicted. In the loaded cold store, an average accuracy of 20% on the velocity magnitudes was observed. The model was capable of predicting both the air and product temperature with reasonable accuracy.
Xie et al. [9] developed a two-dimensional mathematical model for the inside a minitype constructional cold store and a related computer program with SIMPLE algorithm and crisscross girding technique. The simulation results reflected the characteristics of airflow and temperature distribution. After that, several design parameters (corner baffle, the stack mode of foodstuffs, etc.) which would affect the flow field in the cold store were analyzed. The results of calculation indicated that all these design parameters especially the stack mode of foodstuffs influenced the flow and temperature fields inside the cold store greatly. It was demonstrated that CFD was a powerful tool for designing and optimizing the flow field in cold store.
Ho et al. [10] developed a 3D CFD study of the air velocity and temperature distribution in a refrigerated warehouse. The refrigerated space under study has a set of ceiling-type cooling units installed in front of the arrays of stacks of palletized product packages. Numerical solutions of the steady state airflow and heat transfer were done using a complete three-dimensional model and an equivalent two-dimensional model. The results obtained from both models were found to be in good agreement with each other. A parametric analysis was performed using the equivalent model with various values of blowing air velocity and locations of the cooling units. It was found that a better cooling effectiveness and uniformity of temperature in the refrigerated space could be achieved by using higher blowing air velocity and/or locating the cooling units lower and closer toward the arrays of product packages.
Gonçalves et al. [11] developed an experimental study in a laboratory scale model in order to characterize airflow generated by an air curtain device (ACD) on the aerodynamic sealing of refrigerated spaces. The laboratory scale model consists of two similar adjacent rooms connected by a door over which the ACD was installed. The tracer gas technique was used to calculate the sealing effect achieved with the air curtain at different jet velocities. A three-dimensional numerical model was also developed to simulate the heat and mass transfer phenomena, as well as the aerodynamic sealing performance of an ACD. The numerical carried out using a commercial CFD code (ANSYS-CFX®) and the turbulence effects were approached by
two different turbulence models (k–ε and k–ω SST). The experimental and numerical results show a good agreement for validation purposes. No significant differences were found in the results obtained with the two turbulence models, although the
k–ω SST model seems to be more appropriate for the simulations.
The existence of an optimum discharge air jet velocity was confirmed. The results also indicate tha t the air curtain is more efficient in reducing the mass transfer than the energy flow rate across the doorway.
Santos et al. [12-13] developed a computational tool for analyzing the behaviour of a set of relevant parameters in agro-industry companies that contain cold rooms, which reflect their performance against the Portuguese national average. The computational tool was developed in MATLAB, using the GUIDE (Graphical User Interface Design Environment) in order to provide a simple and quick reference graphical user interface. In order to demonstrate its applicability, case studies of a particular slaughterhouse, sausages and ham industry are shown.
Conclusions can be drawn from the graphical analysis of prediction results. These results allow positioning the company performance in relation to the experimental correlations obtained by Nunes et al. [14] that reflect the Portuguese national average. The current state of computational tool allows the user to enter data of annual energy consumption; raw material processed annually; cold rooms’ volume and compressors nominal power. With these performance predictions, the user can decide how to improve the energy performance of its business. The practical application of this tool demonstrates its usefulness in helping decision-making in the implementation of energy efficiency measures. In the future, this tool will include other agro-industry sectors such as: fish, dairy, fruit and vegetables, vineyard and wine, distribution, among others. Additionally, it provides the analysis of parameters as the Specific Energy Consumption (SEC) and generates some automated suggestions for energy performance improvement.
Thus, the state of the art confirms that both experimental and numerical studies have been developed to study topics related to heat transfer and airflow, as well as energy efficiency. These studies carried out parametric analyses in order to promote the thermal performance and energy efficiency of cold stores.
This paper intends to contribute to the research on this topic, since it considers an experimental analysis of the thermal performance of a cold room with airways for meat products in the Covilhã region (Portugal), verifying its external conditions and construction parameters. The cooling system is analyzed, including its conservation status and operation mode. Experimental tests are developed inside the cold room taking into account the layout, i.e., the organization of products storage to the evaporators location and position, the procedure of handling the products, and it is performed the measurement of the discharge air velocity and temperature, air temperature in refrigerated environment, and temperature of the various surfaces. Also, it is developed a three-dimensional model of the cold room, simulated by CFD, in steady state, allowing the detailed evaluation of the airflow and heat transfer. The setup of the CFD model required the definition of a physical-mathematical model based on the equations of continuity, momentum and energy. The turbulence was considered by standard k-ε turbulence model.
From the comparison of numerical and experimental results, although there is a slight shift between results, the model was validated. Thus, a parametric study is developed, which consists in changing the boundary conditions value at the discharge grilles of evaporators. The air temperature value is increased while the air velocity value is reduced. From the analysis of the numerical results provided by the parametric study, it is predicted that the cold system, for product loading defined on the experimental analysis, is oversized, thus enabling the modification of the discharge air temperature and velocity. In this modification, the energy consumption is reduced maintaining similar thermal performance and consequently ensuring the food safety. Thus, it is predicted an improvement of the energy efficiency and a consequent savings of environmental resources, energy and financial resources.
2. EXPERIMENT
The experimental analysis carried out aims to characterize the cold room for the preservation of meat products, taking into account two parameters, air temperature and velocity. This characterization allows defining the boundary conditions of the numerical model as well, comparing the results obtained by numerical simulation with the actual parameters of the cold room in order to determine the numerical predictions error.
The experimental analysis becomes even more important, taking into account that the cooling component studied in this work is aimed to the conservation of meat products during that phase before its commercialization. In this period it is essential to keep the food products in good sanitary state, with good appearance, odor, flavor and nutritional content, since all these factors can affect the commercial product value and can jeopardy public health.
2.1 Experimental facility
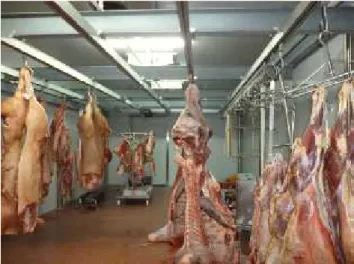
The company where the experimental study was carried out is engaged in the trade and retail of meat products. The raw material that enters the company corresponds to about 3 tons per week of various meat products, such as pork, goat, sheep, poultry and cattle. The latter represents more than half of the raw material. All products arrive to the company in refrigerated trucks with a temperature limit of 4 ºC. A small percentage of carcasses, about 20%, that enter the cold rooms are cut off. The resulting products are cold stored (refrigerated) at a 24 hours limit before being distributed to customers. The frozen products are packed in vacuum or bags. Most carcasses entering the premises of the company are just chilled up until following again to expedition, working the company as a warehouse, as shown in Figure 1. The resulting products have a weight loss of 2% in relation to the raw material.
Figure 1 Carcasses layout in cold room.
The company consumes annually about 38,136 kWh of electricity, with an installed capacity of about 42 kW. At the
company there are three refrigerated cold rooms, a freezing room, two loading/unloading piers, a cutting room, office, reception, toilets and a machine room, which houses the electrical panels and compressors of the refrigeration system.
The walls of the three cold rooms are formed by 100 mm polyurethane sandwich panel. The concrete floor has no thermal insulation. The freezing room, in turns, consists of 120 mm polyurethane sandwich panel. Floor is thermally insulated with 300 mm of cork. Both loading/unloading piers, as well as the cutting room are air-conditioned, being set a maximum temperature level of 14 ºC for those areas.
The evaporators have different locations depending on the cold room. In the case of cold room n. º 2, cold room n. º 3 and freezing room, the evaporators are located in the upper zone above the door. In pier areas, cutting room and cold room n. º 1, evaporators are located in the ceiling, as shown in Figure 2. All evaporators are defrosted by electric heaters.
Cold room n.º 1 was chosen for development of the experimental and numerical studies since an airway is used for transporting and storing the carcasses inside the room.
Analyzing the state of the art of numerical modeling of cold rooms, all available scientific studies only use standard pallets. Thus, the results of this study can be useful for the design of cold rooms where an airway is used for transport and storage within the cold rooms.
Figure 2 Evaporators location inside cold room n. º 1.
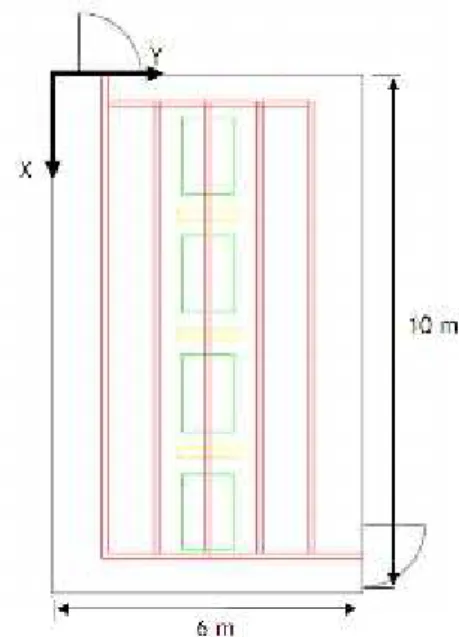
Figure 3 shows the plant of cold room n. º 1, which has two walls exposed to outside, one of which facing south (left wall in Fig. 3). In Figure 3, red lines represent the airway; green squares represent the evaporators, while the yellow rectangles represent illumination. This cold room has an area of 6x10 m2and a height
of 3.2 m. The sliding doors are manually locked, featuring 1.2x2.2 m2. Each airway runner is separated by 1.0 m. The
structure of the airway is spaced 1.0 m from the ceiling of the room. Each evaporator has two 73 W fans. Each lighting has two 36 W fluorescent lamps.
Figure 3 Plant of cold room n. º 1.
2.2 Experimental testing
To perform the measurements of air velocity in the discharge and return grilles of the evaporators, a turbine anemometer was used, Testo 416 (accuracy: ±0.2 m/s). This device also displays the volumetric flow rate. For the measurement of air and superficial (walls, floor and ceiling) temperatures, a thermometer acquisition data system was used, Fluke 54II (accuracy: ± 0.05% + 0.3 ºC), which uses a type K thermocouple.
The testing procedure consisted in consecutive measurements at the measuring points, until thermal equilibrium is reached. The measurement of superficial temperatures consisted in 3 measuring points per wall, and 6 measuring points per ground and per ceiling. The air temperature and velocity were measured inside the cold room. The air temperature was measured in a 5x9 grid that considers measuring point locations in the center of the evaporators, in the center of illumination, at several points along the airway, and at the mid-length point in front of the doors. This horizontal plane (measuring grid) was moved three times vertically. The measurements closer to the ground were made at a distance of 0.1 m. This measure was considered taking into account the ISO standard 7730 [15], since there are no standards for such measurements in cold room. The other two measurements were taken at the height of the airway (2.2 m from the ground), and in mid-height plane at approximately 1.1 m from the floor. For the air velocity of the outflowing fans, was used the method presented by Xie et al. [9], as shown in Figure 4, being measured at 7 location in each discharge grille of the fan (the measurements were made in 8 air discharge grilles - two evaporators with four outputs each).
The air temperature was also measured in each discharge grille of the evaporators. That air temperature has an average value of -1 ºC along the 4 evaporators. A 120 m3/h flow rate in
those locations was measured with the turbine anemometer.
3. NUMERICAL MODELLING
The turbulent air flow and non-isothermal heat transfer process are modelled by a 3D steady state mathematical model. The basic equations governing transport phenomena in the cold room are continuity, momentum and energy [16]. In the computational domain, meat products aren’t modelled, being considered as solids. The air is considered as an ideal gas. The energy equation is developed as function of temperature in steady state with constant specific heat. Further simplifications are accomplished neglecting viscous dissipation due to flow characteristics. The turbulence is modelled by the standard k- model [17], since it is a robust, economic and a reliable turbulence model. The set of model equations is suitable for fully turbulent flow. To account for viscous effects and high gradients in proximity of walls, the turbulence model equations are used in conjunction with empirical wall functions. The complete description and implementation details of wall functions in turbulence models can be found in Rodi [18] and Launder and Spalding [19]. The air relative humidity modeling wasn’t considered.
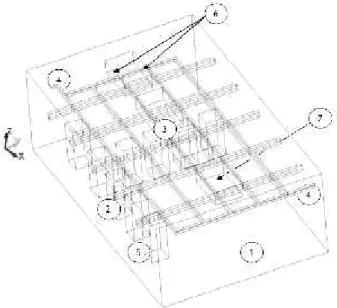
The three-dimensional geometry of the computational model is shown in Figure 5, where (1) East wall; (2) South wall; (3) Ceiling; (4) Transport airway (doors are in the area below the items number 4); (5) Carcasses, 9 parallelepiped with 0.60x0.60x1.50 m3; (6) Air discharge grilles of the evaporators;
(7) Air return grilles of the evaporators.
Figure 5 3D geometry of cold room n.º 1.
A discretization process was used for the numerical solution of continuity, momentum and energy equations, using the finite
volume method. The computational domain was divided into a grid consisting of 56,364 elements and 11,724 nodes. The integration of the governing equations in each control volume provides the algebraic equations for the discrete dependent variables (velocity, pressure and temperature). Finally the discretized equations are linearized, and the resulting system of linear equations is solved to update the values of velocity, pressure and temperature. A segregated formulation was used, which involves the iterative calculation to obtain the solution that satisfies the convergence criteria. Thus, the mathematical model is a set of coupled non-linear partial differential equations, describing mass, momentum and energy conservation which can be simultaneously and interactively solved. The equations set was solved using the pressure based, non-structured grid, finite volume method CFD code FLUENT. The computational procedure is based on a numerical iterative process using the PRESTO! -PREssure Staggering Option algorithm [20]. The turbulence equations were discretized in the control volume form using the Upwind differencing scheme while the Second Order Upwind differencing scheme was used to discretize the momentum and energy equations.
3.1 Boundary conditions
All boundary conditions (BC) consider setting the values obtained or calculated from experimental measurements. These BCs are defined as follows:
1. Fixed heat flux, this BC is defined for all wall and floor; 2. Fixed heat flux, this BC is defined in the ceiling, and differs
from the previous one by having the addition of the heat flux from the illumination;
3. Fixed air velocity, this BC is imposed at the discharge grilles of the evaporators;
4. Fixed outlet pressure, this BC is defined at the return grilles of the evaporators.
Table 1 shows the thermal heat loads used in BC for heat flux.
Table 1 Thermal charges imposed.
Surface Symbol Unit Value
Ceiling Floor East wall West wall South wall North wall qceiling qfloor qwE qwW qwS qwN W/m2 W/m2 W/m2 W/m2 W/m2 W/m2 16.88 15.34 6.60 2.88 6.95 2.90
The temperature imposed for the carcass surface was 5ºC. The turbulence parameters chosen to calculate the computational domain were the turbulence intensity and the hydraulic diameter. The direction of the flow indicates the turbulence intensity. The hydraulic diameter was calculated by the Eq. (1).
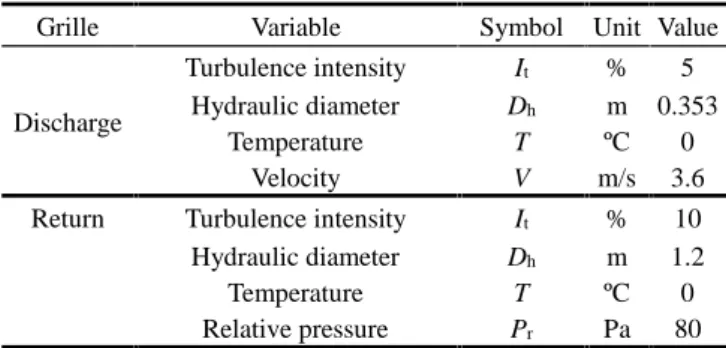
= (1) Table 2 specifies the parameters fixed at the return and discharge grilles.
Table 2 Imposed parameters at BCs Velocity-inlet and Pressure-outlet.
Grille Variable Symbol Unit Value
Discharge Turbulence intensity It % 5 Hydraulic diameter Temperature Velocity Dh T V m ºC m/s 0.353 0 3.6
Return Turbulence intensity It % 10
Hydraulic diameter Temperature Relative pressure Dh T Pr m ºC Pa 1.2 0 80
4. RESULTS AND DISCUSSION
4.1 Experimental results
The air temperature in the cold room was measured in a total of 135 points, over three distinct planes. An average air temperature of 1.4 ºC, 1.2 ºC and 1.1 °C was obtained, respectively on higher, mid and lower planes, resulting in an average air temperature in the cold room of 1.3 º C. These values are in agreement with expectations, since the cold air has higher density. The highest values of air temperature are measured near the walls and near to some of the carcasses. The highest air temperature value is next to the wall in the upper plane, with an absolute value of 2.9 °C. This value can be justified from the high number of carcasses located in that area and from the beam supporting the airway reducing the cold air passage.
The air velocity at the evaporator outlet, has a constant behaviour, i.e. in the eight discharge grilles, the value of air velocity variation has negligible, as shown in Figure 6.
Figure 6 Velocity value in each discharge grille.
The numerical simulation was performed in order to anticipate and analyze the distribution of air temperature and velocities fields in the cold room. After numerical predictions validation, these results provide a basis for defining the CFD parametric studies. The air velocity field corresponding to a y-z plane located at x = 6.15 m is shown in Figure 7.
In this prediction is observable the high air velocity value, 3.6 m/s, near the discharge grilles of the evaporator (side zones). In the return grille zone, the air velocity value is identical to discharge, since this value was imposed on the respective BC. The flow is driven from the evaporator near the ceiling, until finding the sidewalls (South and North walls). On the right side (North wall) of the velocity field, the flow descends along the side wall and continues along the ground predicting a reduction of the air velocity value, by the momentum reduction as the distance to the discharge grilles increases. However on the opposite side, the air flow is interrupted by the location of a carcass, being expected even lower air velocity values.
Figure 7 Air velocity field [m/s] (Plane y-z, x=6.15 m).
A curious fact shown in Figure 8 reveals a slower air zone, due to the carcasses geometry. Although the carcasses are 0.10 m above the floor, the air velocity in this zone is very slow (1.55 m/s). Even there, are some vortices between the return and discharge zone. This air is recirculated and does not contribute to the heat transfer between the carcasses and the surroundings.
Figure 9 shows the air temperature field near South and East walls, as well as near the ceiling of the cold room. According to numerical predictions, the highest temperature values are found in locations near the ceiling, reaching an air temperature value of about 3 °C. This temperature value is obtained due to conduction along walls and at the sides of the evaporators where there is no air-blowing, so the air velocity is lower. Additionally these results arise from the experimentation data where it was measured and calculated a higher heat flux on the ceiling.
Figure 9 Temperature field [K] (ceiling, East and North walls).
4.2 Validation of numerical model
The validation of the numerical model requires the comparison with the experimental values. Some factors may influence the precision of numerical predictions, such as the computational mesh, discretization criteria, physical-mathematical models, numerical methods, geometrical approximation and model simplifications.
Table 3 resumes the main values gathered in both experimental and numerical models. The relative error of the previsions are high (e=20%), however they are acceptable according to [10] for this particular case.
Table 3 Models comparison with the associated relative error.
Model Average temperature Maximum temperature Ceiling average temperature Experimental 1.3 2.9 2.1 Numerical Relative error 0.95 26.9% 2.1 27.6% 1.9 9.5%
The temperature predictions obtained by the numerical model are lower than the experimental values. Some heat loads weren’t considered, like pull down temperature of carcasses, motors fan and thermal entrainment due to doors opening, so this may justify this difference.
5. PARAMETRIC STUDY
The objective of the parametric study is to identify a solution in which the company can save energy while maintaining the same thermal performance in the cold room, i.e. ensuring the food safety of stored meat products. With the validated numerical simulation, some changes were applied to boundary conditions. The main changes considered increasing the air temperature from 0ºC to 2ºC and reducing the air velocity from 3.6 m/s to 3 m/s.
In Figure 10 is shown the temperature air field, revealing the possibility to reduce the refrigeration power system or the discharge velocity, ensuring better energy efficiency while maintaining the food products safety.
Figure 10 Temperature air field [K] (plane y-z in x=6.15 m)
The distribution of air velocity and temperature fields remained within the parameters that ensure food safety, that is, with values below 5 ºC [21], as shown in Table 4.
Table 4 Models results obtained in the study.
Model Average temperature Maximum temperature Ceiling average temperature Experimental 1.3 2.9 2.1 Numerical Parametric 0.95 2.2 2.1 4.6 1.9 4.6 6. CONCLUSIONS
In this paper are developed experimental and 3D numerical analyses to a cold room of meat products stored in an airway. These analyze lead to a CFD parametric study, which indicates that the conditions identified are oversized, considering a stock of nine carcasses. In the parametric study, the air velocity was reduced while the air temperature was increased in the discharge
grilles of the evaporator, predicting that for the same stock, the air temperature inside the cold room remains within the limits that ensure food safety. Additionally, the numerical predictions provide valuable information about how the airway path should be defined in order to ensure lower temperature of the carcasses.
ACKNOWLEDGMENT
This study is framed in the anchorproject "InovEnergy -Energy Efficiency in Agro-Industrial Sector" activities encompassed within Action Programme of InovCluster: Association of Agro-Industrial Cluster of Center region. The study was funded by the National Strategic Reference Framework (QREN 2007-2013) - COMPETE/POFC (Operational Programme for Competitiveness Factors), SIAC -Support System for Collective Actions: 01/SIAC/2011, Ref: 18642).
REFERENCES
1. M.L. Hoang, P. Verboven, J. De Baerdemaeker and B.M. Nicolai, Analysis of the air flow in a cold store by means of computational fluid dynamics, International Journal of
Refrigeration, vol. 23, pp. 127-140, 2000.
2. P. Chen, D.J. Cleland, S.J. Lovatt and M.R. Bassett, An empirical model for predicting air infiltration into refrigerated stores through doors, International Journal of
Refrigeration, vol. 25, pp. 799-812, 2002.
3. A.M. Foster, R. Barrett, S.J. James and M.J. Swain, Measurement and prediction of air movement through doorways in refrigerated rooms, International Journal of
Refrigeration, vol. 25, pp. 1102–1109, 2002.
4. A.M. Foster, M.J. Swain, R. Barrett and S.J. James, Experimental verification of analytical and CFD predictions of infiltration through cold store entrances, International
Journal of Refrigeration, vol. 26, pp. 918–925, 2003.
5. W.B. Gosney and H.A.L. Olama. Heat and enthalpy gains through cold room doorways. Proceedings of Institute of Refrigeration, vol. 72, pp. 31–41, 1975.
6. A.M. Foster, M.J. Swain, R. Barrett, P. D’Agaro and S.J. James, Effectiveness and optimum jet velocity for a plane jet air curtain used to restrict cold room infiltration, Int.
Journal of Refrigeration, vol. 29, pp. 692–699, 2006.
7. A.M. Foster, M.J. Swain, R. Barrett, P. D’Agaro, L.P. Ketteringham and S.J. James, Three-dimensional effects of an air curtain used to restrict cold room infiltration, Applied
Mathematical Modelling, vol. 31, pp. 1109–1123, 2007.
8. H.B. Nahor, M.L. Hoang, P. Verboven, M. Baelmans and B.M. Nicolai, CFD model of the airflow, heat and mass transfer in cool stores, International Journal of Refrigeration, vol. 28, pp. 368–380, 2005.
9. J. Xie, X.-H. Qu, J.-Y. Shi and D.-W. Sun, Effects of design parameters on flow and temperature fields of a cold store by CFD simulation, Journal of Food Engineering, vol. 77,
pp. 355-363, 2006.
10. S.H. Ho, L. Rosario and M.M. Rahman, Numerical simulation of temperature and velocity in a refrigerated warehouse, Int. J. of Ref., vol. 33, pp. 1015-1025, 2010. 11. J.C. Gonçalves, J.J. Costa, A.R. Figueiredo and A.M.G.
Lopes, Study of the aerodynamic sealing of a cold store – Experimental and numerical approaches, Energy and
Buildings, vol. 55, pp. 779–789, 2012.
12. R. Santos, J. Nunes, P.D. Silva, P.D. Gaspar and L.P. Andrade, Ferramenta computacional de análise e simulação do desempenho de unidades de conservação de carne através de frio industrial, Proc. VI Congreso Ibérico y IV
Congreso Iberoamericano de Ciencias y Técnicas del Frío
(CYTEF-2012), Madrid, Spain, February, 2012 (in portuguese).
13. R. Santos, J. Nunes, P.D. Silva, P.D. Gaspar and L.P. Andrade, Computational tool for the analysis and simulation of cold room performance in perishable products industry, Proc. 2nd IIR International Conference on
Sustainability and the Cold Chain, International Institute of
Refrigeration (IIR), Paris, France, April 2-4, 2013.
14. J. Nunes, P.D. Silva and L.P. Andrade, L.P., Energetic efficiency evaluation in refrigeration systems of meat industries, Proc. 23rd International Congress of Refrigeration - ICR 2011, Prague, Czech Republic August
21 – 26, 2011.
15. ISO 7730, Ergonomics of the thermal environment --Analytical determination and interpretation of thermal comfort using calculation of the PMV and PPD indices and local thermal comfort criteria, International Organization for Standardization, Geneve, 2005.
16. J.H. Ferziger and M. Perić, Computational methods for
fluid dynamics. Germany: Springer-Verlag, 2002.
17. B.E. Launder and D.B. Spalding, Lectures in mathematical
models of turbulence. Academic Press, Londres, UK, 1972.
18. W. Rodi, Turbulence models and their application in
hydraulics. A state of the art review. International
Association for Hydraulics Research, 1980.
19. B.E. Launder and D.B. Spalding, The numerical computation of turbulent flows, Comp. Methods in Applied
Mechanics and Engineering, 3(2), pp. 269-289, 1974.
20. S.V. Patankar, Numerical heat transfer and fluid flow, Hemisphere Publishing Corp., Washington, U.S.A., 1980. 21. ASHRAE, ASHRAE Handbook: Refrigeration, American
Society of Heating, Refrigerating and Air Conditioning Engineers (ASHRAE), 2006.