ISSN 0104-530X (Print) ISSN 1806-9649 (Online)
Resumo: O presente artigo propõe um modelo multidimensional para medir a qualidade de websites comerciais com uso da Teoria da Resposta ao Item (TRI). A qualidade de um website engloba características técnicas (usabilidade/navegabilidade, apresentação da informação e interatividade) e não técnicas (design, estética, apelo visual, confiabilidade, hedonismo, imagem), configurando-se, teoricamente, como contexto multidimensional. As suposições iniciais das dimensões e elaboração dos itens foram baseadas em análise bibliográfica sobre o tema qualidade em websites de e-commerce. Um conjunto de 75 itens foi elaborado e uma amostra de 441 websites de e-commerce dos mais variados setores foi a ele submetido. O tratamento e análise dos dados foram feitos utilizando-se a TRI. Nessa etapa, foram discutidas questões referentes à dimensionalidade e à escolha do modelo mais adequado. Por fim, um modelo multidimensional com quatro dimensões foi ajustado contemplando as dimensões navegabilidade ou condução/orientação do usuário, acessibilidade e confiabilidade do sistema, interatividade e apresentação da informação.
Palavras-chave: Qualidade em websites; E-commerce; Modelagem; Teoria da Resposta ao Item Multidimensional. Abstract: The goal of this article is to propose a multidimensional modeling to measure the quality of commercial websites with the use of Item Response Theory (IRT). The quality of a website encompasses technical characteristics (usability-navigability, presentation of information and interactivity) and non-technical characteristics (design, aesthetics, visual appeal, reliability, hedonism, image), theoretically configuring a multidimensional context. The initial hypothesis of the dimensions and the elaboration of the items were based on a bibliographic analysis about the theme of e-commerce website quality. A set of 75 items was prepared and submitted to a sample of 441 e-commerce websites from a wide variety of sectors. The treatment and analysis of data was conducted using IRT. In this step, questions related to dimensionality and the choice of the most suitable model was discussed. Finally, a multidimensional model with four dimensions was adjusted.
Keywords: Quality in websites; E-commerce; Modeling; Multidimensional Item Response Theory.
Multidimensional model to measure quality in
e-commerce websites using item response theory
Modelo multidimensional para mensurar qualidade em website de e-commerce utilizando a teoria da resposta ao item
Rafael Tezza1 Antonio Cezar Bornia2 Dalton Francisco de Andrade3
Pedro Alberto Barbetta3
1Departamento de Administração Empresarial, Universidade do Estado de Santa Catarina – UDESC, Av. Madre Benvenuta, 2037,
Itacorubí, CEP 88035-001, Florianópolis, SC, Brasil, e-mail: [email protected]
2 Departamento de Engenharia de Produção, Universidade Federal de Santa Catarina – UFSC, Campus Universitário, Trindade, CP 476,
CEP 88040-900, Florianópolis, SC, Brasil, e-mail: [email protected]
3 Departamento de Informática e Estatística, Universidade Federal de Santa Catarina – UFSC, Campus Universitário, Trindade, CP 476,
CEP 88040-900, Florianópolis, SC, Brasil, e-mail: [email protected], [email protected] Received June 7, 2016 - Accepted May 17, 2017
Financial support: This research was partially supported by CNPq.
1 Introduction
The e-commerce market has been growing exponentially since the beginning of the last decade around the world, increasing its power of diffusion and competitiveness (Kim et al., 2012). With this, companies increasingly recognize the competitive need to have a web presence and engage in this market (Deng & Poole, 2012). This has spurred massive growth of commercial sites and intensified competition for
Commercial websites are becoming increasingly complex. The number of features offered to consumers is constantly increasing in order to improve both the information gathering process and the online shopping experience (Éthier et al., 2008). With these new developments, website managers and developers are overwhelmed with approaches with recommendations on how to create and maintain a attractive and quality website.
Researchers from a variety of fields have developed and tested tools to measure website quality (eg, Aladwani & Palvia 2002; Loiacono et al., 2002; van der Merwe & Bekker, 2003). In these studies, a large number of items were generated to measure the quality of websites and these were tested on a variety of commercial or non-commercial websites through the evaluation of experienced users, novices, students, developers, and others. indicated that the quality in websites represents a multidimensional construct (Kim & Stoel, 2004; Hasan, 2016).
In this sense, according to Aladwani & Palvia (2002), the construction of quality measures in the context of websites is a challenging task, since it is a complex and multidimensional concept. Most studies involve technical characteristics such as download speed (Palmer, 2002; Galletta, et al., 2004, Gata & Gilang, 2017), security (Flavián & Guinalíu, 2006; Braz et al., 2007), usability (Bangor et al., 2008; Fang & Holsapple, 2007; Singh et al., 2016), the quality of the content (Agarwal & Venkatesh, 2002; Goldberg & Allen, 2008; Stoyanov et al, 2015) and non-technical features such as aesthetics (Pandir & Knight, 2006; Lindgaard et al., 2006; Stoyanov et al, 2015), reliability (Seffah, et al., 2006; Flavián et al., 2006) and visual appeal (Kulviwat et al., 2007; Lindgaard, 2007). However, few studies have explored the hierarchy of dimensions of these elements, so little is known about the relationships between the various scales or the overall construction of a scale for measuring website quality. An alternative to solve this problem is the development of a systematic or multidimensional model considering, in a more comprehensive way, the factors that directly influence the quality of a website. The elaboration of a model in the form of a multidimensional measure is the central proposal of this article. In this sense, the Multidimensional Item Response Theory (MIRT) emerges as an alternative to the development of this process, since it is associated to a robust mathematical and methodological structure, capable of creating a multidimensional scale where it is possible to position in the same scale item and respondent.
This article is organized as follows: after this introduction a brief definition of quality on the web and creation of scales is performed, following the proposed measurement process is presented, followed by results and discussions, conclusions and references.
2 Quality on the web
Reflections from studies on the interaction of people with technology imply that customer assessment of new technologies is a different process from the traditional (Parasuraman et al., 2005) because it involves a different way of doing business commonly called e-service . Rust (2001) defines e-service as the provision of service using electronic networks.
Following this same idea, Gefen (2002), Zeithaml et al. (2000), DeLone & McLean (2003) Silva et al. (2015), and others have focused on developing and adapting models for online service evaluation. However, according to Serkan et al. (2010), compared to the abundant research in the traditional context of service quality, research on the quality of online service is still in the beginning.
From the technical point of view, the evaluations in online services were also influenced by studies aimed at evaluating information systems. These studies focused on the conceptualization of specific topics in this context, such as quality of data management (Kaplan et al., 1998; Wang et al., 1995), quality of information (King & Epstein, 1983; Haga & Zviran, 1994), quality of software (ISO, 1992; Schneidewind, 1992; Kitchenham & Pfleege, 1996), overall quality of the system (Kettinger & Lee, 1994; Nelson, 1996), among others. These studies were much more focused on the evaluation of the system, its performance and its relationship with specific users.
Since the mid-1990s, with the development and popularization of the Internet, practitioners and researchers have been struggling to define quality in the context of the Internet (eg, Barnes & Vidgen, 2000; Day, 1997; Lindroos, 1997; Xie et al., 1998; Loiacono et al., 2002). Lindroos (1997) discusses the differences between web-based information systems and conventional information systems from a software quality perspective. Barnes & Vidgen (2000), Loiacono et al. (2002), Parasuraman et al. (2005) and Ding et al. (2011) develop models focused on commercial sites. These and several other studies break down the quality of websites into various attributes. The creation of such models is based primarily on long-standing experiences in the development and maintenance of information systems and web. The validation of these models is done mainly by empirical studies, such as the analysis of data collected in user tests, satisfaction questionnaires and interviews.
system. As non-technical characteristics is meant design, aesthetics, visual/commercial appeal, reliability, hedonism, empathy.
3 Creation of scales: item response
theory and quality on the web
The construction of measurement scales facilitates the understanding of complex concepts. Three reasons explain this. First, looking at various aspects of a variable provides the creation of knowledge about it. Second, several perspectives emphasize the range of variation, which allows more precise distinctions, especially if it involves ordinal measures. Third, the construction of measures allows an efficient reduction of data by means of which a numerical score can represent the ordinal position where a certain characteristic of the item or elements of the population in evaluation are in the scale, which allows comparability (Babbie, 2005).In order to construct a scale based on a set of items, the variables must be linked theoretically or conceptually with what the research aims to measure (Baker, 2009). Thus, the greatest implication of the scales is the possibility of comparing scores and appropriate statistics that summarize these scores. On a measure scale, the role of numbers is to represent an object, or a person, so that the relationship between numbers represents the empirical relationship between objects or between people. This representativity provides the object with important properties such as the power of distinction between objects, order, addition and reason (Embretson & Reise, 2000).
The Item Response Theory (IRT) is composed of a set of probabilistic models, which relates a latent trait of a respondent (Ө), which can not be measured directly, with the probability that it responds to an item within a given category (Lord, 1980).
In IRT, the choice of the mathematical model depends basically on the type of item and represents the probability of response to an item according to the parameters of the item and the respondent’s proficiency (Tavares et al., 2004; Reise et al., 1993). The most widely used model for items with dichotomous response is the one-dimensional logistic model (ML2P) developed by Birnbaum (1968), based on Lord (1952). If Uij = 1 the probability of the individual j to answer affirmatively to item i, 2PLM is represented by Equation (1).
( )
1 ( 1 / )
1 i j i
ij j a b
P U
e θ
θ − −
= =
+ (1)
Where, θ is the latent trace to be measured, supposedly on a scale with mean zero and standard deviation one; θj is the latent trace value for individual j; bi is the value of the latent trace in which the probability of item i is answered affirmatively is equal to 0.5; ai is the work of Loiacono et al. (2002), this dimension
refers to the loading time of the sites. Through a review of the literature in the period 2000 to 2016, using the databases Scopus, ScienceDirect, EBSCO and Emerald, using the keywords “e-commerce” or “web site” or “website” or “online” shopping “or” internet shopping “and” quality “in the title or in the abstract, the multidimensional nature of the studies can be evidenced. Among these, practical approaches with at least 3 and at most 15 dimensions were found. Most of them work with user tests and perceptions, using exploratory and/or confirmatory factor analysis as a technique of analysis, demonstrating that the development and / or application of new techniques may represent a technical-methodological advance in this field. The most common dimensions in these studies were information presentation, security, usability and interactivity.
In addition, the vast majority of studies found are actually adapting or applying existing models and, according to Fassnacht & Koese (2006), the structure and meaning of the elaborated dimensions have generally been determined a posteriori by the results of analysis of data.
A relevant question from the methodological point of view, of the studies in this area is the big difference in the size of the sample. For example, while Jun et al. (2004) use 137 users (students and professionals), Yang et al. (2005) use 1992 users. As the great majority of the researched approaches uses as a procedure for data analysis the factorial analysis, one can compare the reliability of the proposed scales. In the case of the scale proposed by Jun et al. (2004), reliability (Cronbach’s alpha) was between 0.59 and 0.92, whereas in the study by Yang et al. (2005), reliability ranged from 0.66 to 0.89. Generally, values above 0.70 are assumed to be acceptable, but according to Kline (2000), in cases with great diversity of constructs such as psychological tests, values below 0.70 are acceptable. Most of the studies studied presented a Cronbach’s alpha greater than 0.70 except for the study of Ibrahim et al. (2006), which presents a range of 0.33 to 0.84.
The present study fits the classification of Cristobal et al. (2007) as a study of website quality and design. Within this scope, websites quality is assumed such as the quality of an information system which, according to Loiacono et al. (2002) focuses on the storage, processing, presentation and transfer of information.
application of the Rasch model (Rasch, 1960) for the usability inspection process, Tezza et al. (2011) applied the one-dimensional two-parameter logistic model to measure usability in commercial websites and Tezza et al. (2016) compare hierarchical and non-hierarchical models in IRTin the context of commercial websites. However, it was not found in the literature the presentation of an interpretable IRT multidimensional model to evaluate the quality of commercial websites.
4 Method
The construction of the items started from a survey of the literature as described in section two. We sought to consolidate the various studies present in the specific literature and to develop a comprehensive and consistent instrument. More specifically, the construction of the items occurred through the association of concepts resulting from the analysis of 213 articles and books researched. Some items were elaborated from the most recurrent concepts in the literature. Others have been extracted in full from previous studies, such as Tezza et al. (2011) and W3C (2008).
The data collection planning followed the proposal of Stepchenkova et al. (2010) and Tezza et al. (2011), in which the items are constructed to evaluate the system and not with the objective of capturing the perception of customers or users, having, thus the objective characteristic of a checklist. With this, we worked on the elaboration of objective items, capable of verifying the existence or not of a certain characteristic associated to the quality of the commercial website. Thus, all items were formulated objectively and with dichotomous responses.
75 items were elaborated. After the elaboration of the items they were submitted to the evaluation of 3 specialists, with the purpose of verifying the adequacy of the items to the construct - quality in commercial websites.
The data used in the present analysis were formed by a sample of the population of e-commerce sites of Brazilian origin. The collection of this sample was done with the aid of search engines such as Google.com, Bing.com and Yahoo.com in the period of January and February 2012. We analyzed 441 e-commerce sites, covering several genres, chosen at random. During the sampling process, care was taken to ensure that it was as diversified as possible. For this, in addition to sites with the most varied types of products marketed, we observed the variety of design styles, ranging from simple to very elaborate sites, which does not necessarily imply higher quality, but contributes to the diversity, necessary for application of the IRT (Tezza et al., 2011).
Of the 75 items generated, 56 of them had their answers obtained through manual collection, in the discrimination parameter of item i, proportional
to the slope of the Item Characteristic Curve (CCI) at point bi. The CCI represents the relationship between the expected response to the item and the latent trait of the individual (Reckase, 1997).
One of the assumptions used in this model is the assumption of unidimensionality, which defines that all test items are measuring the same latent trait or the same composition of multiple skills. However, there are many situations in which the items that make up the measuring instrument may be measuring different dimensions of the latent trace, or different compositions of multiple abilities (Ackerman, 1994), such as the quality of commercial websites.
Reckase (1985) describes the multidimensional compensatory model of two parameters as a multidimensional extension of the 2PLM presented in Equation 1 of the form presented in Equation 2.
(
)
(( 1 ))1
' '
1| , , 1
m ikik i k
m ikik i k
a d
ij jk i ik
a d
e
P U d a
e θ θ θ = = + + ∑ = = ∑ +
, (2)
Where: Uij = response of person j to item i (0 or 1); aik = discrimination parameter of item i in dimension k; θjk = latent trait of person j in dimension k;
di = difficulty parameter of item i.
The exponent of e in the model (2) can be written according to Equation 3.
1 1 2 2 1
m
ik ik i i j i j im jm i
k
a θ d aθ a θ a θ d =
+ = + +…+ +
∑
(3)Equation 3 shows that the exponent is a linear function of elements of θ, with the parameter d as the ordinate at the origin and the elements of vector a as the slope or discrimination parameters. One of the properties of this model is that the expression represented in the exponent defines a line in a space of k dimensions that can generate lines of equiprobabilidad, that is, this multidimensional form allows that there are infinite linear combinations that result in the same exponent, generating the same probability of hit This property gives the model the compensatory characteristic. For more details see Reckase (2009).
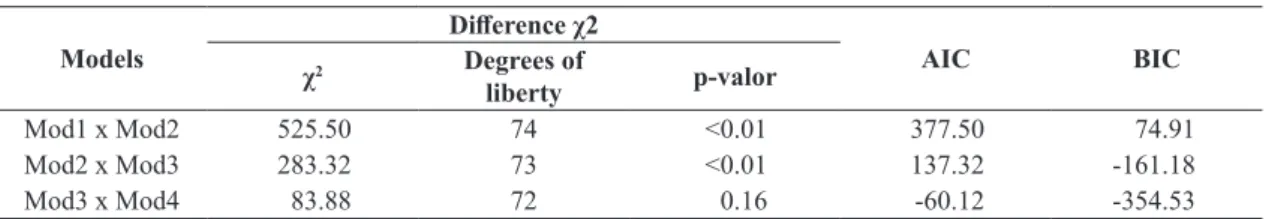
analysis method. As a result we have the chi-square statistic (χ2) associated with the likelihood ratio test, as well as the difference in AIC (Akaike Information Criterion - AIC) and BIC (Bayesian Information Criterion - BIC)), which are statistics comparing modeling (the lower the better). A comparison was made of four models, the first assuming one dimension (Mod1), the second, two (Mod2), the third, three (Mod3) and the fourth, four (Mod4).
Table 1 shows that the difference between model 1 and model 2 is statistically significant for α = 0.05, (alternative hypothesis accepted), indicating that the model that assumes two dimensions has more information than the model of one dimension, this can also be visualized in the AIC and BIC information criteria, in which there are positive differences from model 1 to model 2. The same occurs in the comparison of model 2 and model 3, however, in this case, it is verified in the AIC that there is positive difference between the models 2 and 3 but in the BIC the same does not occur.
Using analysis factorial of full information, it was verified that most of the items presented factorial loads higher than 0.3, in some dimension, which is considered by some authors (Johnson & Wichern 2007; Hair et al., 2009) to be a minimum value so that the item can be considered in the interpretation of the dimension. Items with a factor load of less than 0.3 in all dimensions were assumed as little informative items for the construct and were thus eliminated. This action resulted in the withdrawal of 18 items. The new analysis of the set, after this first withdrawal, showed two items with factorial load, in module, less than 0.3 in all of the dimensions, items 01 and 42, which were also eliminated. Five new analyzes were carried out until extracting all the remaining items with factorial load less than 0.3, in this way, a total of 31 items were eliminated, remaining 44 items in this stage.
5.2 Assessment of dimensions
After verification of the quality of the initial set of 75 items by means of the analysis of the factorial loads, we proceeded to evaluate the dimensionality of the remaining 44 items. To evaluate the dimensionality of the construct we used the principal components which the researcher, after browsing the website
under analysis, responds whether or not he has the characteristics in question. This manual method of data collection on websites was based on Pinterits et al. (2006), Al-Khalifa (2010), Stepchenkova et al. (2010) and Tezza et al. (2011). Manual collection was performed by the first author. This manual collection took two months - March to May 2012. A total of 441 websites were evaluated. The remaining 19 items were analyzed semiautomatically using the free tool AChecker (2012). This tool checks accessibility guidelines to establish the level of accessibility of websites by detecting errors according to the Web Content Accessibility (WCAG) 2.0 guidelines.
The environment for data collection consisted of a computer with a 15 “screen. The browser used was Internet Explorer version 7. The screen resolution used was 1024 by 768 pixels.
In the data analysis stage, an exploratory factor analysis was performed to verify the quality of the items and later dimensionality analyzes, also through an exploratory analysis to identify the number of dimensions and the suitability of each item to the dimensions. Finally, it was verified the adequacy of the multidimensional compensatory model of the item response theory and scale interpretation.
5 Results and discussions
5.1 Evaluation of the quality of the initial pool of items
Initially, an evaluation of the quality of the initial set of data was made, with 75 items using the exploratory factor analysis of full information. The analysis was carried out based on the verification of the factorial loads of each item, which reflects the relation of the item to the underlying factors (latent features) present in the data set.
To verify the factorial loads, the structure of 3 dimensions was used after analyzing structures with 1, 2, 3 and 4 dimensions. The use of 3 dimensions was based on the criterion suggested by Chalmers (2012), which affirms that the number of dimensions that generates a better fit to the data can be verified through a comparison of models using a generic Analysis of variance (ANOVA) implemented in R software based on the full information factorial
Table 1. Comparison of the models of one, two, three and four dimensions.
Models
Difference χ2
AIC BIC
χ2 Degrees of
liberty p-valor
Mod1 x Mod2 525.50 74 <0.01 377.50 74.91
Mod2 x Mod3 283.32 73 <0.01 137.32 -161.18
Mod3 x Mod4 83.88 72 0.16 -60.12 -354.53
system, that is, verification of possible obstacles in the system that can prevent, confuse or hinder access of users, particularly users that have some physical or cognitive limitation. Note that most of the items in this dimension belong to the WCAG 2.0 accessibility recommendations set (W3C, 2008). The second dimension brings items directly related to the presentation of information, practically all the items with greater factorial load in this dimension refer to some concept of organization or presentation of the information. The third dimension, as well as the second, presents all the items with the greatest load in this dimension in the same sense, that is, all positive, except for item 73. Analyzing the concepts involved in each characteristic item of this dimension, the majority have a concept adjacent to the user’s control or interaction with the system. In the fourth dimension, items 5 and 8 presented a load contrary to the majority. This peculiarity can be justified by the very characteristic of the items in this context. That is, considering that all items in this dimension are directly related to the concept of user orientation during navigation. Chart 1 shows a summary of the dimensions and the respective items of greater loading in these second the factorial analysis.
5.3 Application of the IRT compensatory multidimensional model
Given the conclusions and verifications discussed in the previous section it was assumed that the construct containing 44 items is composed of four dimensions. Thus, a four-dimensional multidimensional modeling was used using the item response theory. The MIRT (multidimensional item response theory) has some similarities with the factorial analysis, however, MIRT has considerable advantages over the purely factorial approach, mainly because it treats the items in an individual way and not only in terms of factorial grouping. In this line, it is possible to analysis method and the full information factorial
analysis method. In the first method, the number of dimensions was verified based on the tetrachoric correlation matrix and the parallel analysis, for which we used the psych package (Revelle, 2012) implemented in R software (R Core Team, 2012). Principal component analysis, performed using the tetrachoric correlation matrix, suggested the existence of 5 dimensions, assuming the criterion of at least 50% of the common variance for the set of factors. Table 2 shows the first 10 eigenvalues considering the 44 items.
Some authors, such as McDonald (1981) and Spector et al. (1997) argue that classical factorial analysis tends to overestimate the number of dimensions, creating spurious factors when there is no uniformity in the difficulty of the items. In this way, it is not very convenient to consider a very large number of dimensions in view of the limited sample number as well.
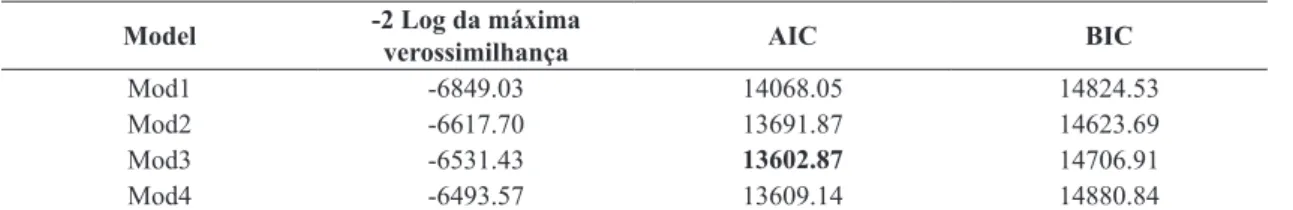
The factorial analysis of full information showed that the first dimension explains only 10.41% of the total variation of the set of 44 items, which suggests a non-unidimensional construct. Comparison of one, two, three and four dimensional MIRT model fittings suggests three dimensions, by the AIC criterion, as can be seen in Table 3.
In addition, we used the empirical criterion recommended by different authors, such as Ford et al. (1986), Fleck & Bourdel (1998), Podsakoff et al. (1997). This method proposes to consider the dimensions that can be well interpreted. In this context, a better interpretation was verified for the four-dimensional MIRT model.
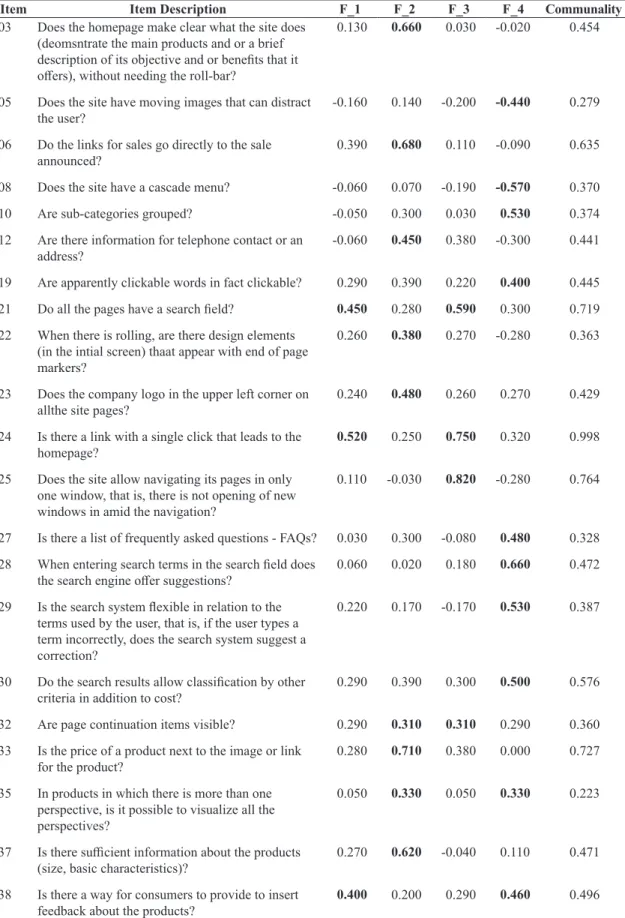
Table 4 shows the description of the 44 items and the distribution of the factorial loads of each item in the four dimensions, using orthogonal varimax rotation. The first dimension groups items with content aimed at accessibility and use of the
Table 2. Values specific to the tetrachoric correlation matrix.
Dimension 1 2 3 4 5 6 7 8 9 10
Eigenvalue 8.95 4.44 3.89 3.15 2.55 2.12 1.79 1.61 1.60 1.47
Accumulated proportion
of explained variation 20.34 30.42 39.26 46.41 52.22 57.03 61.09 64.74 68.38 71.72
Table 3. Selection of the best model based on AIC and BIC information criteria.
Model -2 Log da máxima verossimilhança AIC BIC
Mod1 -6849.03 14068.05 14824.53
Mod2 -6617.70 13691.87 14623.69
Mod3 -6531.43 13602.87 14706.91
Mod4 -6493.57 13609.14 14880.84
Table 4. Factorial analysis using the full information method, varimax orthogonal rotation at 44 items in four dimensions.
Item Item Description F_1 F_2 F_3 F_4 Communality
03 Does the homepage make clear what the site does (deomsntrate the main products and or a brief description of its objective and or benefits that it offers), without needing the roll-bar?
0.130 0.660 0.030 -0.020 0.454
05 Does the site have moving images that can distract
the user? -0.160 0.140 -0.200 -0.440 0.279
06 Do the links for sales go directly to the sale
announced? 0.390 0.680 0.110 -0.090 0.635
08 Does the site have a cascade menu? -0.060 0.070 -0.190 -0.570 0.370
10 Are sub-categories grouped? -0.050 0.300 0.030 0.530 0.374
12 Are there information for telephone contact or an
address? -0.060 0.450 0.380 -0.300 0.441
19 Are apparently clickable words in fact clickable? 0.290 0.390 0.220 0.400 0.445
21 Do all the pages have a search field? 0.450 0.280 0.590 0.300 0.719
22 When there is rolling, are there design elements (in the intial screen) thaat appear with end of page markers?
0.260 0.380 0.270 -0.280 0.363
23 Does the company logo in the upper left corner on
allthe site pages? 0.240 0.480 0.260 0.270 0.429
24 Is there a link with a single click that leads to the
homepage? 0.520 0.250 0.750 0.320 0.998
25 Does the site allow navigating its pages in only one window, that is, there is not opening of new windows in amid the navigation?
0.110 -0.030 0.820 -0.280 0.764
27 Is there a list of frequently asked questions - FAQs? 0.030 0.300 -0.080 0.480 0.328 28 When entering search terms in the search field does
the search engine offer suggestions? 0.060 0.020 0.180 0.660 0.472
29 Is the search system flexible in relation to the terms used by the user, that is, if the user types a term incorrectly, does the search system suggest a correction?
0.220 0.170 -0.170 0.530 0.387
30 Do the search results allow classification by other
criteria in addition to cost? 0.290 0.390 0.300 0.500 0.576
32 Are page continuation items visible? 0.290 0.310 0.310 0.290 0.360
33 Is the price of a product next to the image or link
for the product? 0.280 0.710 0.380 0.000 0.727
35 In products in which there is more than one perspective, is it possible to visualize all the perspectives?
0.050 0.330 0.050 0.330 0.223
37 Is there sufficient information about the products
(size, basic characteristics)? 0.270 0.620 -0.040 0.110 0.471
38 Is there a way for consumers to provide to insert
feedback about the products? 0.400 0.200 0.290 0.460 0.496
Item Item Description F_1 F_2 F_3 F_4 Communality 40 Does the site present related products at the end of
the page? 0.070 0.450 0.030 0.240 0.266
43 Does the site have multimedia for product
presentation? 0.000 0.520 -0.090 0.080 0.285
45 Is there an indication that the site is safe at the time of making the purchase
0.130 0.520 0.020 0.330 0.397
46 When filling in the forms, can the user visualize the
next steps in the interface? 0.210 0.200 0.530 0.410 0.533
47 Does the site have other payment forms in addition
to a credit card? 0.240 0.430 0.470 -0.240 0.521
48 Is it possible to know the total cost before registering
(including shipping costs)? 0.330 0.600 0.290 0.250 0.616
52 Are required data differentiated from optional data
in a visually clear manner? 0.280 0.220 0.440 0.220 0.369
55 Are the error messages free of abbreviations and or
codes generated by the operating system? 0.210 0.100 0.540 -0.200 0.386
56 Can any user action be taken back with the UNDO
or BACK option? 0.580 0.550 0.280 0.100 0.727
57 Does all the non-textual content that is presented to the user have an alternative in text form that serves an equivalent purpose?
-0.710 -0.050 0.400 -0.010 0.667
58 Can the information, structure and relations broadcast through the presentation be determined in a programmatic form or are they available in the text?
-0.960 0.160 0.130 0.190 1.000
59 Is there another visual form of presenting information, beside color, to indicate an action, request a response or distinguish a visual element?
0.150 -0.460 0.520 0.270 0.577
60 Does the visual presentation of text and images have
a relation of contrast of at least 4.5:1? -0.720 -0.120 0.010 0.510 0.793
61 Except for captions and text images, can the text be resized up to 200 percent without support technology, and without losing content or functionality?
-0.340 -0.180 0.430 0.280 0.411
64 For each time limit defined by the content, is there
control by the user? 0.220 -0.600 0.550 0.100 0.721
65 For information in movement, in an intermittent mode, in shifting or automatic updating, is there an option for user control?
0.060 -0.590 0.670 0.230 0.854
66 Is a mechanism available to ignore blockages of
content that are repeated on various Web pages? 0.440 -0.060 0.320 0.400 0.460
69 Do the headers and the tags describe the topic or the
finality? -0.430 0.160 -0.230 -0.200 0.303
70 Can the pre-defined human language for each Web
page be determined in a programmatic manner? -0.180 -0.050 0.420 0.220 0.260
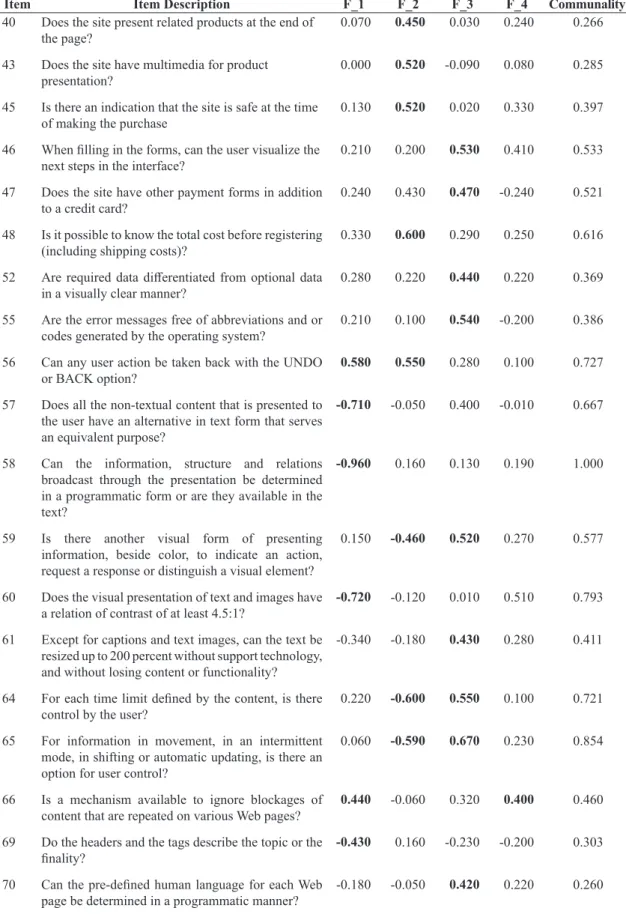
F_1 – Dimension System accessibility and reliability; F_2 – Dimension Information presentation; F_3 – Interactivity; F_4 – Navigability/ user guidance.
The discrimination parameter, as well as the factor load, can be arbitrary in each dimension, considering that there may be some type of rotation, these loads can be compared by identifying similar items in the same dimension, in the same way as the factorial analysis (Reckase, 1997). Thus, it is expected that the discrimination parameter of a given item will be larger in the dimension in which it has greater discrimination power, that is, in the dimension in which it has more information.
The structure presented in Table 5 resembles that presented in the factorial analysis of Table 4, which considers four dimensions. However, the multidimensional configuration of Table 5 presents some peculiarities that unlike it. Firstly, four items were removed because of problems in the parameter estimates. Second, despite having a common statistical base, full information factorial analysis and multidimensional item response theory, the latter works with estimation of more parameters, which justifies some particularities in the estimation process, which can generate problems of convergence such as those that occurred in items 05, 24, 58 and 73. Finally, the consequence of reestimations of the parameters is the possibility of reorganizing the items in the dimensions and changing the basic analyze, besides the quality of the item, its degree
of difficulty and, with this, to estimate scores to the respondents. According to Bartolucci et al. (2012), no other statistical approach allows to study the dimensionality and power of item discrimination in a simpler way than MIRT.
The estimation of the multidimensional parameters of the 44 items presented some specific problems with 4 items (items 05, 24, 58, 73), such items presented overestimated parameters and/or with high standard error and therefore were eliminated.
Table 5 shows the estimation of the parameters of the 40 items using the two-parameter compensatory multidimensional model (equation 2) using flexMIRTTM software (Cai, 2012). Table 5 also shows
the discrimination parameters of each item in each dimension (a1, a2, a3, a4) and the multidimensional discrimination parameter (MDISC). The higher the multidimensional discrimination parameter (MDISC), the greater the multidimensional discrimination power of the item, ie the more the item differentiates the quality level for the website. In addition, Table 5 shows the value of the location parameter d relative to each item that, according to Reckase (1997), is related to the difficulty of the item.
Item Item Description F_1 F_2 F_3 F_4 Communality
71 Does changing the definition of a component of the user interface automatically provoke a change of context, at least when the user has been warned about this situation before using the component?
-0.490 0.220 0.220 0.120 0.351
73 If an input error is automatically detected, is the item that has the error identified and is the error described to the user in text?
0.180 -0.740 0.520 -0.050 0.853
74 Are labels or instructions provided when the content
requires inputting data by the part of the user? -0.880 0.120 0.260 0.130 0.873
75 In the content implemented using languages for marking, do the elements have complete marks at the beginning and end, are the elements fit according to the respective specifications, do the elements have duplicated attributes, and are all the IDs exclusive?
-0.410 0.150 0.170 -0.120 0.234
F_1 – Dimension System accessibility and reliability; F_2 – Dimension Information presentation; F_3 – Interactivity; F_4 – Navigability/ user guidance.
Table 4. Continued...
Chart 1. Classification of the items according to the dimension, according to the factorial analysis.
Dimension Items
System accessibility and reliability 56*, 57, 58, 60, 66*, 69, 71, 74, 75
Information presentation 03, 06, 12, 22, 23, 32, 33, 35, 37, 40, 43, 45, 48, 56, 64*, 73* Interactivity 21, 24, 25, 32, 46, 47, 52, 55, 59, 61, 64, 65, 70
Navigability/ user guidance 05*, 08*, 10, 19, 27, 28, 29, 30, 35, 38, 66
925
925/934
e...
Item a 1 s.e. a 2 s.e. a 3 s.e. a 4 s.e. MDISC d s.e. MDIFF
3 1.43 0.78 0.65 0.76 -0.34 0.64 0.66 0.74 1.74 4.23 0.82 -2.43
6 2.29 1.18 0.98 0.89 -0.03 0.70 0.39 0.93 2.52 4.88 1.39 -1.94
8 -0.02 0.35 0.29 0.40 -0.99 0.33 -0.70 0.39 1.25 0.79 0.19 -0.63
10 0.51 0.42 -0.15 0.43 0.39 0.42 1.20 0.46 1.37 2.09 0.36 -1.53
12 0.66 0.55 1.47 0.58 -0.06 0.57 -0.02 0.50 1.61 2.53 0.44 -1.57
19 1.20 0.39 0.14 0.45 0.75 0.38 0.92 0.40 1.69 1.50 0.25 -0.89
21 1.73 1.03 1.26 1.00 2.35 1.24 0.74 0.99 3.26 5.57 1.46 -1.71
22 1.11 0.79 0.94 0.71 0.33 0.63 -0.48 0.67 1.57 4.02 0.90 -2.57
23 1.22 0.50 0.42 0.62 0.44 0.59 0.91 0.63 1.64 3.61 0.52 -2.20
25 0.27 0.93 2.39 1.30 1.54 0.91 -0.61 0.99 2.92 5.34 1.50 -1.83
27 0.61 0.38 -0.39 0.41 0.24 0.40 1.13 0.40 1.36 -0.62 0.21 0.45
28 0.24 0.43 -0.31 0.43 1.17 0.40 1.01 0.45 1.59 -1.33 0.26 0.83
29 0.70 0.43 -0.71 0.46 0.39 0.47 0.92 0.43 1.41 -2.07 0.32 1.47
30 1.40 0.50 0.30 0.50 1.31 0.47 0.90 0.48 2.14 1.38 0.27 -0.65
32 0.96 0.36 0.38 0.41 0.86 0.40 0.47 0.39 1.42 1.62 0.24 -1.14
33 2.50 1.33 1.91 1.21 0.49 0.92 1.00 0.91 3.34 6.07 1.78 -1.82
35 1.60 0.47 0.20 0.47 -0.13 0.42 0.61 0.49 1.73 2.43 0.37 -1.41
37 0.62 0.30 0.05 0.31 0.22 0.28 0.77 0.28 1.01 -0.36 0.17 0.36
38 1.16 0.44 0.04 0.49 1.60 0.47 0.39 0.48 2.01 0.73 0.24 -0.36
40 0.82 0.29 0.11 0.34 0.06 0.28 0.68 0.29 1.07 -0.15 0.18 0.14
43 0.84 0.53 0.42 0.69 -0.35 0.78 0.75 0.84 1.25 -4.36 0.91 3.48
45 0.68 0.75 1.11 0.76 0.60 0.70 -0.21 0.74 1.45 4.44 0.72 -3.06
46 0.70 0.40 0.59 0.46 1.40 0.45 0.83 0.41 1.87 1.23 0.25 -0.66
47 1.37 1.28 1.51 1.01 0.21 0.86 0.14 1.09 2.05 5.40 1.38 -2.63
48 1.89 0.58 0.73 0.59 0.81 0.54 0.72 0.62 2.30 3.12 0.50 -1.36
52 0.82 0.38 0.63 0.44 1.14 0.43 0.24 0.39 1.56 1.82 0.27 -1.17
55 1.09 0.41 0.14 0.42 0.14 0.38 0.99 0.40 1.49 1.52 0.27 -1.02
56 2.57 1.28 1.03 1.35 0.66 1.14 0.84 1.16 2.97 6.78 2.46 -2.28
57 -1.98 0.97 2.04 1.07 -0.26 0.81 1.63 0.98 3.29 -3.05 0.91 0.93
59 -0.55 0.59 0.27 0.73 2.00 0.91 -0.18 0.65 2.10 3.94 0.99 -1.88
60 -1.30 1.00 0.20 1.19 0.22 1.00 2.03 1.53 2.43 5.74 2.17 -2.36
61 -0.86 0.41 0.62 0.49 0.79 0.42 0.90 0.43 1.60 0.40 0.20 -0.25
64 -0.51 0.82 0.47 1.10 2.08 1.01 -0.34 1.29 2.22 5.59 1.34 -2.52
65 -1.00 1.05 0.86 1.46 2.58 1.92 0.19 1.28 2.90 6.71 2.89 -2.31
66 0.73 0.79 0.06 1.13 1.56 1.05 0.31 0.72 1.75 5.02 1.28 -2.87
69 -0.25 0.34 0.19 0.40 -0.97 0.31 0.30 0.34 1.06 1.10 0.24 -1.04
70 -0.29 0.30 0.48 0.35 0.63 0.31 0.51 0.32 0.99 -0.57 0.20 0.58
71 -0.31 0.45 0.79 0.47 -0.15 0.44 1.01 0.45 1.33 2.28 0.32 -1.72
74 -1.14 0.56 1.18 0.65 -0.36 0.54 1.29 0.65 2.12 -1.77 0.36 0.84
75 -0.35 0.31 0.79 0.35 -0.33 0.31 0.43 0.35 1.02 0.53 0.17 -0.52
a 1 - Discrimination parameter of dimension 1; a 2 - Discrimination parameter of dimension 2; a 3 - Discrimination parameter of dimension 3; a 4 - Discrimination parameter of dimension 4; s.e. - standard
(Nielsen & Tahir, 2002). Item 25 (the site allows navigation in its pages in only one window, that is, there is no opening of new windows in the middle of navigation) is an item linked to reliability and interaction. Nielsen & Loranger (2006) argue that most users do not understand how to manipulate multiple windows and focus on what is ahead on the screen. If they can not come back, they will be stuck and confused. In items 45 and 47, the security-related issue becomes more evident, since the first item checks to see if there is an indication of a secure environment at the time of purchase, and the second one checks to see if the site has other forms of payment in addition to the security card. credit. Items 57 and 75 as discussed in the factorial analysis in section 4.3 are directly linked to system accessibility.
Dimension three presents characteristic elements of interactivity. For example, items 21 and 28 are linked directly to the website’s search engine, which is a very common tool to allow the user to interact with the system by searching for products and / or information. Items 64, 65 and 70 reflect the user’s control and power of interaction with the system, allowing the user to pause or stop some interactive or automatic update content.
The fourth dimension, as discussed above, correlates with the first dimension. However, there are characteristic items that characterize it as being information presentation, such as items 27, 37, 60 and 74.
In the great majority of the applications of the theory of the response to the item, be it unidimensional or multidimensional, the parameters of discrimination of the model are positive. This is mainly due to issues related to the construct itself, that is, it is assumed that a positive value of the discrimination parameter results in increasing monotonicity, that is, with increasing the individual’s proficiency increases the probability of a positive response to the item. This behavior is quite common in the educational and psychological areas, in which IRT is more widespread. However, it is possible to have negative discrimination parameter values (parameter a), this situation maintains the monotonicity, but decreasing, assumption.
Figure 1 shows the structure created by the multidimensional compensatory model of item response theory. For the construction of this diagram, the load was assumed in each dimension based on the direction of the discrimination load and its intensity, assuming here as loads greater than 0.70. According to Hair et al. (2009), in a factorial analysis, factorial loads in the range of + 0.30 to + 0.40 are considered to have the minimum level for structure interpretation. Loads of + 0.50 or greater are considered to be practically significant and greater than + 0.70 are meaning of some dimensions, which in fact occurred
in particular with the dimension characterized in the factorial analysis as accessibility and use of the system and now in the reestimation of the MIRT, as accessibility and reliability of the system, represented by dimension 2.
The values in bold in Table 5 highlight the dimension in which the item has the highest discrimination parameter, indicating in which dimension the item has more information. However, since this is a multidimensional compensatory modeling, an item is not always exclusive of a single dimension, and can contribute to the estimation of the latent trait of the respondent (website) in several dimensions.
In general, the first dimension groups items with characteristics directed to the user’s guidance on the website, also classified by some authors, such as navigability and usability (González & Palacios, 2004; Nusair & Kandampully, 2008; Singh et al., 2016). This dimension contains items with secondary loading mainly in dimension four, which is characterized by items related to information display. This is due to the fact that, although orthogonal rotation is used to present the results, there is some kind of relationship between the dimensions, and this is most evident in dimensions one and four, particularly because these characteristics are treated in some studies (Tezza et al., 2011; Yang et al., 2004) as well as highly correlated characteristics. Jun et al. (2004) classify information organization as ease of use, which in this context can be understood as usability. Dimension three groups items associated with interactivity.
In the present study, the correlation between dimension one and dimension four was approximately 0.4. The behavior of these two dimensions reflects in the loading of items 03, 19, 23, 35, 37 and 43.
This compensatory structure allows the increase in quality in one dimension to compensate for the reduction in another. In item 19, described as “seemingly clickable words are indeed clickable” is clear the concept of user navigation and guidance. However, this item has reflexes in other concepts such as, for example, the presentation of information, that is, the presentation of a word or phrase transmits information of functionality that guides and informs the user in the interface.
Full lines represent the interaction with the highest discriminatory load and the dotted lines represent the secondary interactions with discriminatory load in the same direction of the main and with intensity greater than 0.70. For example, item 47 (The site considered indicative of a well defined structure.
Therefore, it was decided to consider as relevant loads greater than 0.70.
Figure 1 demonstrates part of the complexity involved in compensatory multidimensional modeling.
As for the discrimination category, in Table 5, it can be seen that the five most discriminating items were items 33, 57, 21, 56 and 25.
Table 6 shows the estimation of the ability of the first 4 websites analyzed, in the normal scale N (0; 1), that is, mean zero and variance one, thus characterizing, statistically, a standardized scale. It is verified that the first website has a greater domain of the items related to the presentation of the information, thus needing, to better develop its quality mainly in the control by the user / interactivity, which presented below average domain. In website number 002 it is observed that there is a good domain of accessibility / reliability of the system, however, there is a need for improvement regarding user control / interactivity and information presentation requirements.
However, in a multidimensional model, the punctual analysis of respondents’ proficiency estimates, in this case the degree of quality of a website may refer to a simplistic evaluation of the model, since the multidimensional structure adds more information and complexity than a one-dimensional model. Therefore, each dimension can be evaluated in particular considering each item associated with the estimated quality of each website, as can be seen in Table 7. This table shows the likelihood of success (positive response) of each item, based on the estimates of the first four websites, according to Table 6.
From a practical point of view, the analysis presented in Table 7 shows, based on the degree of quality of the website estimated by the multidimensional compensatory model of four dimensions, the items that are theoretically dominated by the website. Considering the concept of anchor items defined by Beaton & Allen (1992) and Andrade et al. (2000) in which one of the criteria to characterize an item in a has other forms of payment in addition to the credit
card) has greater discrimination in the dimension accessibility and reliability with a = 1.57 and secondary interaction in the dimension navigation and orientation with a = 1.37. From a practical point of view, it means that the characteristic of having other forms of payment besides credit card contributes from the point of view of quality in a website in terms of reliability, that is, the website allows and allows the user to choose the form of payment that seems to be more convenient and secure, and is therefore a common feature of the two dimensions, like so many other features presented in Figure 1.
Chart 2 shows the distribution of the items for the characterized dimensions, considering the higher loads.
5.4 Interpretation of the generated scale
Based on the estimation of the parameters of multidimensional discrimination, it is possible to classify each item according to its discriminating power or its informative power in the construct, as well as, based on the difficulty parameter, to classify each item according to its difficulty.
Table 5 shows that items 43, 29, 57, 74 and 28 are the items that require more than one website, that is, the five most difficult items in the construct. From the practical point of view, this makes sense. For example, item 43 relates to multimedia for product presentation. This is an uncommon feature on most websites, found only on more mature websites from the point of view of quality of information presentation. The same happens with items 28 and 29 which deal with the perfection of the search tool.
Table 6. Estimation of the multidimensional quality of the first 4 websites of the sample based on the multidimensional model
of two compensatory parameters.
Website Navigability/ user
guidance System accessibility and reliability Interactivity presentationInformation
001 0.105 0.130 -0.864 0.677
002 0.367 0.524 -0.753 0.040
003 -0.887 -0.328 -0.557 0.525
004 0.782 0.324 -0.879 0.314
Chart 2. Classification of items according to dimension, according to the multidimensional model of item response theory.
Dimension Items
Navigability/ user guidance 03, 06, 19, 22, 23, 30, 32, 33, 35, 40, 43, 48, 55, 56 System accessibility and reliability 12, 25, 45, 47, 57, 75
Interactivity 08*, 21, 28, 38, 46, 52, 59, 64, 65, 66, 69*, 70
Information presentation 10, 27, 29, 37, 60, 61, 71, 74
From the point of view of theoretical implications to the field of quality in websites, the present work developed a model to evaluate quality requirements, discussed issues related to dimensionality, and suggested a multidimensional model capable of individually evaluating each item and each website in its respective dimensions.
From a practical point of view, the work opened up other possibilities of quality measurement in commercial websites in order to identify possible improvements to the interface and possibly the development of automated tools for useful diagnostics to improve website designs.
References
AChecker. (2012). Web accessibility checker. Recuperado em 25 de maio de 2012, de https://achecker.ca/ checker/index.php
Ackerman, T. A. (1992). A didactic explanation of item bias, item impact, and item validity from a multidimensional perspective. Journal of Educational Measurement, 29(1), 67-91. http:// dx.doi.org/10.1111/j.1745-3984.1992.tb00368.x.
Ackerman, T. A. (1994). Using multidimensional item response theory to understand what items and tests are measuring. Applied Measurement in Education, 7(4), 255-278. http://dx.doi.org/10.1207/ s15324818ame0704_1.
Adams, R. J., Wilson, M., & Wang, W. C. (1997). The multidimensional random coefficients multinomial logit model. Applied Psychological Measurement, 21(1), 1-23. http://dx.doi.org/10.1177/0146621697211001.
Agarwal, R., & Venkatesh, V. (2002). Assessing a firm’s web presence: a heuristic evaluation procedure for the measurement of usability. Information Systems Research, 13(2), 168-186. http://dx.doi.org/10.1287/ isre.13.2.168.84.
Aladwani, A. M., & Palvia, P. C. (2002). Developing and validating an instrument for measuring user-perceived web quality. Information & Management, 39(6), 467-476. http://dx.doi.org/10.1016/S0378-7206(01)00113-6.
certain degree of the scale is the probability greater than 0.650 at that point in the scale, it is verified that the website 001 dominates most of the items, except items 27, 28, 29, 37, 38, 40, 43, 57, 61, 70 and 74, which present a positive response probability of less than 0.650. It is observed that, although website 001 presents a higher degree of quality in dimension 4, it has, like the other 3 websites shown in Table 7, probability below 0.650 (p = 0.511) to respond positively to item 37 which is, according to the model, a characteristic associated with the presentation of the information. This is particularly true because it is an item with a parameter of above-average difficulty (0.360). This analysis can be followed to the other items.
The analysis of each website associated with the probability of positive response to each item extends the practical analysis of multidimensional modeling, as it particularizes each item and demonstrates where it needs to be improved on time. The general analysis of the degree of quality presented in Table 6 gives an indication of the dimension or concept in which the website needs to improve or explore more.
6 Conclusions
The work developed a multidimensional model using the theory of the response to the item to measure quality in commercial websites. For the creation of the model, the logistic model of two multidimensional parameters with four dimensions and a set of 40 items was used as the basis. The four dimensions were associated to navigability concepts or user guidance; system accessibility and reliability; interactivity and information presentation. These dimensions found in the present work refer to the dimensions most cited in the literature and directly related to the definition of quality in websites, which is a set of technical and non-technical characteristics of a web system, that allow the user to achieve their goals in a website in an accessible, efficient and pleasant way. As technical characteristics, it is understood usability/navigability, presentation of the information, accessibility and interactivity of the system. As non-technical features, it means design, aesthetics, visual/commercial appeal, reliability, hedonism, empathy.
Table 7. Estimation of the multidimensional quality of the first four sites of the sample based on the multidimensional model
of two compensatory parameters.
Website Navigability/ user
guidance System accessibility and reliability Interactivity Information presentation
001 0.105 0.130 -0.864 0.677
002 0.367 0.524 -0.753 0.040
003 -0.887 -0.328 -0.557 0.525
Chalmers, R. P. (2012). Mirt: a multidimensional item response theory package for the R environment. Journal of Statistical Software, 48(6), 1-29. http:// dx.doi.org/10.18637/jss.v048.i06.
Cristobal, E., Flavian, C., & Guinaliu, M. (2007). Perceived e-service quality (PeSQ): measurement validation and effects on consumer satisfaction and web site loyalty. Managing Service Quality, 17(3), 317-340. http://dx.doi.org/10.1108/09604520710744326.
Day, A. (1997). A model for monitoring Web site effectiveness. Internet Research: Electronic Networking Applications and Policy, 7(2), 1-9. http://dx.doi. org/10.1108/10662249710165244.
DeLone, W. H., & McLean, E. R. (2003). The DeLone and McLean model of information systems success: a ten-year update. Journal of Management Information Systems, 19(4), 9-30. http://dx.doi.org/10.1080/07 421222.2003.11045748.
Deng, L., & Poole, M. S. (2012). Aesthetic design of e-commerce web pages – webpage complexity, order and preference. Electronic Commerce Research and Applications, 11(4), 420-440. http://dx.doi. org/10.1016/j.elerap.2012.06.004.
Ding, D. X., Hu, P. J. H., & Sheng, O. R. L. (2011). e-SELFQUAL: a scale for measuring online self-service quality. Journal of Business Research, 64(1), 508-515. http://dx.doi.org/10.1016/j.jbusres.2010.04.007.
Embretson, S. E. (1991). A multidimensional latent trait model for measuring learning and change. Psychometrika, 56(3), 495-515. http://dx.doi. org/10.1007/BF02294487.
Embretson, S., & Reise, S. P. (2000). Item response theory for psychologists. New Jersey: Lawrence Erlbaum Associates, Inc. Publishers.
Éthier, J., Hadaya, P., Talbot, J., & Cadieux, J. (2008). Interface design and emotions experienced on B2C Web sites: empirical testing of a research model. Computers in Human Behavior, 24(2), 2771-2791. http://dx.doi.org/10.1016/j.chb.2008.04.004.
Fang, X., & Holsapple, C. W. (2007). An empirical study of web site navigation structures’ impacts on web site usability. Decision Support Systems, 43(2), 476-491. http://dx.doi.org/10.1016/j.dss.2006.11.004.
Fassnacht, M., & Koese, I. (2006). Quality of electronic services: conceptualizing and testing a hierarchical model. Journal of Service Research, 9(1), 19-37. http://dx.doi.org/10.1177/1094670506289531.
Flavián, C., & Guinalíu, M. (2006). Consumer trust, perceived security and privacy policy: three basic elements of loyalty to a web site. Industrial Al-Khalifa, H. S. (2010). The accessibility of Saudi
Arabia government Web sites: an exploratory study. Universal Access in the Information Society, 10(4). http://dx.doi.org/10.1007/s10209-016-0495-7.
Andrade, D. F., Tavares, H. R., & Valle, R. C. (2000). Teoria de resposta ao item: conceitos e aplicações. São Paulo: ABE.
Babbie, E. (2005). The basics of social research. Belmont: Wadsworth Publishing.
Baker, D. L. (2009). Advancing E-Government performance in the United States through enhanced usability benchmarks. Government Information Quarterly, 26(1), 82-88. http://dx.doi.org/10.1016/j. giq.2008.01.004.
Bangor, A., Kortum, P. T., & Miller, J. T. (2008). An empirical evaluation of the system usability scale. International Journal of Human-Computer Interaction, 24(6), 574-594. http://dx.doi. org/10.1080/10447310802205776.
Barnes, S. J., & Vidgen, R. T. (2000). WebQual: an exploration of web site quality. In Proceedings of the 8th European Conference on Information Systems (Vol. 1, pp. 298-305). Vienna: Wirtschaftsunivsitat Wien.
Bartolucci, F., Montanari, G. E., & Pandolfi, S. (2012). Dimensionality of the latent structure and item selection via latent class multidimensional IRT models. Psychometrika, 77(4), 782-802. http:// dx.doi.org/10.1007/s11336-012-9278-0.
Beaton, A. E., & Allen, N. L. (1992). Interpreting scales through scale anchoring. Journal of Educational Statistics, 17(2), 191-204.
Birnbaum, A. (1968). Some latent trait models and their use in infering an examiniee’s Ability. In F. M. Lord, & M. R. Novick. Statistical theories of mental test scores (Vol. 38, pp. 123-140). Boston: Addison-Wesley.
Braz, C., Seffah, A., & M’Raihi, D. (2007). Designing a trade-off between usability and security: a metrics based-model. Lecture Notes in Computer Science, 4663, 114-126. http://dx.doi.org/10.1007/978-3-540-74800-7_9.
Cai, L. (2012). FlexMIRTTM version 1.86: a numerical engine for multilevel item factor analysis and test scoring. Seattle: Vector Psychometric Group.
Hair, J. F., Black, W. C., Babin, B. J., Anderson, R. E., & Tatham, R. L. (2009). Análise multivariada de dados (6. ed.). Porto Alegre: Bookman.
Hartig, J., & Höhler, J. (2008). Representation of competencies in multidimensional IRT models with within-item and between-item multidimensionality. The Journal of Psychology, 216(2), 88-100.
Hasan, B. (2016). Perceived irritation in online shopping: the impact of website design characteristics. Computers in Human Behavior, 54, 224-230. http:// dx.doi.org/10.1016/j.chb.2015.07.056.
Ibrahim, E. E., Joseph, M., & Ibeh, K. I. N. (2006). Customers’ perception of electronic service delivery in the UK retail banking sector. International Journal of Bank Marketing, 24(7), 475-493. http://dx.doi. org/10.1108/02652320610712094.
International Organisation for Standardization – ISO. (1992). ISO9126: Information Technology — Software Product Evaluation — Quality Characteristics and Guidelines for Their Use. Geneva: ISO.
Johnson, R., & Wichern, D. (2007). Applied multivariate analysis (6th. ed.). New Jersey: Prentice Hall.
Jun, M., Yang, Z., & Kim, D. S. (2004). Customers’ perceptions of online retailing service quality and their satisfaction. International Journal of Quality & Reliability Management, 21(8), 817-840. http:// dx.doi.org/10.1108/02656710410551728.
Kaplan, D., Krishnan, R., Padman, R., & Peters, J. (1998). KRISHNAN, R. PADMAN, R. PETERS, J. Assessing data quality in accounting information systems. Communications of the ACM, 41(2), 72-78. http://dx.doi.org/10.1145/269012.269024.
Kettinger, W. J., & Lee, C. C. (1994). Perceived service quality and user satisfaction with the information services function. Decision Sciences, 25(5-6), 737-766. http://dx.doi.org/10.1111/j.1540-5915.1994. tb01868.x.
Kim, C., Galliers, R. D., Shin, N., Ryoo, J., & Kim, J. (2012). Factors influencing Internet shopping value and customer repurchase intention. Electronic Commerce Research and Applications, 11(4), 374-387. http://dx.doi.org/10.1016/j.elerap.2012.04.002.
Kim, S., & Stoel, L. (2004). Dimensional hierarchy of retail website quality. Information & Management, 41(5), 619-633. http://dx.doi.org/10.1016/j. im.2003.07.002.
King, W. R., & Epstein, B. J. (1983). Assessing information system value: an experimental study. Decision Sciences, 14(1), 34-45. http://dx.doi. org/10.1111/j.1540-5915.1983.tb00167.x. Management & Data Systems, 106(5), 601-620.
http://dx.doi.org/10.1108/02635570610666403.
Flavián, C., Guinalíu, M., & Gurrea, R. (2006). The influence of familiarity and usability on loyalty to online journalistic services: the role of user experience. Journal of Retailing and Consumer Services, 13(5), 363-375. http://dx.doi.org/10.1016/j. jretconser.2005.11.003.
Fleck, M. P. A., & Bourdel, M. C. (1998). Método de simulação e escolha de fatores na análise dos principais componentes. Revista de Saude Publica, 32(3), 267-272. http://dx.doi.org/10.1590/S0034-89101998000300010. PMid:9778862.
Ford, J. K., Maccallum, R. C., & Tait, M. (1986). The application of exploratory factor analysis in applied psychology: a critical review and analysis. Personnel Psychology, 39(2), 292-314. http://dx.doi. org/10.1111/j.1744-6570.1986.tb00583.x.
Galletta, D. F., Henry, R., McCoy, S., & Polak, P. (2004). Web site delays: how tolerant are users? Journal of the Association for Information Systems, 5(1), 1-28.
Gata, W., & Gilang, O. (2017). Analysis of information system quality of service on bsi academy’s environment using webqual methods, importance performance analysis and fishbone. Journal of Theoretical and Applied Information Technology, 95(2), 229.
Gefen, D. (2002). Consumer loyalty in e-commerce. Journal of the Association for Information Systems, 3(1), 27-51. http://dx.doi.org/10.17705/1jais.00022.
Glas, C. A. W. (1992). A rasch model with a multivariate distribution of ability. In M. Wilson (Ed.), Objective measurement: theory into practice (pp. 236-258). Norwood: Ablex.
Goldberg, C. B., & Allen, D. G. (2008). Black and white and read all over: Race differences in reactions to recruitment Web sites. Human Resource Management, 47(2), 217-236. http://dx.doi.org/10.1002/hrm.20209.
González, F. J. M., & Palacios, T. M. B. (2004). Quantitative evaluation of commercial websites: an empirical study of Spanish firms. International Journal of Information Management, 24(4), 313-328. https://doi.org/10.1016/j.ijinfomgt.2004.04.009.
Gummerus, J., Liljander, V., Pura, M., & van Riel, A. (2004). Customer loyalty to content-based web sites: the case of an online health-care service. Journal of Services Marketing, 18(3), 175-186. http://dx.doi. org/10.1108/08876040410536486.
Oshima, T. C., & Miller, M. D. (1992). Multidimensionality and item bias in item response theory. Applied Psychological Measurement, 16(3), 237-248. http:// dx.doi.org/10.1177/014662169201600304.
Palmer, J. W. (2002). Web site usability, design, and performance metrics. Information Systems Research, 13(2), 151-167. http://dx.doi.org/10.1287/ isre.13.2.151.88.
Pandir, M., & Knight, J. (2006). Homepage aesthetics: the search for preference factors and the challenges of subjectivity. Interacting with Computers, 18(6), 1351-1370. http://dx.doi.org/10.1016/j.intcom.2006.03.007.
Parasuraman, A., Zeithaml, V. A., & Malhotra, A. (2005). E-S-Qual: a multiple-item scale for assessing electronic service quality. Journal of Service Research, 7(3), 213-233. http://dx.doi. org/10.1177/1094670504271156.
Pinterits, A., Treiblmaier, H., & Pollach, I. (2006). Environmental websites: an empirical investigation of functionality and accessibility. International Journal of Technology Policy and Management, 6(1), 103-119. http://dx.doi.org/10.1504/IJTPM.2006.010075.
Podsakoff, P. M., Ahearne, M., & Mackenzie, S. B. (1997). Organizational citizenship behaviors and the quantity and quality of work group performance. The Journal of Applied Psychology, 82(2), 262-270. http://dx.doi.org/10.1037/0021-9010.82.2.262. PMid:9109284.
R Core Team. (2012). R: a language and environment for statistical computing.Vienna: R Foundation for Statistical Computing. Recuperado em 25 de maio de 2012, de http://www.R-project.org/
Rasch, G. (1960). Probabilistic models for some intelligence and attainment tests. Copenhagen: Danish Institute for Educational Research.
Rauch, D., & Hartig, J. (2010). Multiple‐choice versus open‐ended response formats of reading test items: a two‐dimensional IRT analysis. Psychological Test and Assessment Modeling, 52(4), 354-379.
Reckase, M. D. (1985). The difficulty of test items that measure more than one ability. Applied Psychological Measurement, 9(4), 401-412. http:// dx.doi.org/10.1177/014662168500900409.
Reckase, M. D. (1997). A linear logistic multidimensional model for dichotomous items response data. In W. J. van der Linden & W. J. Hambleton (Ed.), Handbook of modern item response theory (pp. 271-286). New York: Springer.
Reckase, M. D. (2009). Multidimensional item response theory. New York: Springer. http://dx.doi. org/10.1007/978-0-387-89976-3.
Kitchenham, B., & Pfleege, S. L. (1996). Software quality: the elusive target. IEEE Software, 13(1), 12-21. http://dx.doi.org/10.1109/52.476281.
Kline, P. (2000). The handbook of psychological testing. London: Routledge.
Kulviwat, S., Bruner, G. C., 2nd., Kumar, A., Nasco, S. A., & Clark, T. (2007). Toward a unified theory of consumer acceptance of technology. Psychology and Marketing, 24(12), 1067-1092. http://dx.doi. org/10.1002/mar.20196.
Lindgaard, G. (2007). Aesthetics, visual appeal, usability, and user satisfaction: What do the user’s eyes tell the user’s brain? Australian Journal of Emerging Technologies and Society, 5(1), 1-14.
Lindgaard, G., Gary, J. F., Cathy, D., & Brown, J. (2006). Attention Web Designers: You Have 50 Milliseconds to Make a Good First Impression! Behaviour & Information Technology, 25(2), 115-126. http://dx.doi.org/10.1080/01449290500330448.
Lindroos, K. (1997). Use quality and the World Wide Web. Information and Software Technology, 39(12), 827-836. http://dx.doi.org/10.1016/S0950-5849(97)00041-4.
Loiacono, E., Watson, R., & Goodhue, D. (2002). WEBQUAL: a measure of web site quality. In K. Evans, & L. Scheer (Eds.), Marketing Educators’ Conference: Marketing Theory and Applications (Vol. 13, pp. 432-437). Amsterdam: Elsevier Science B.V.
Lord, F. M. (1952). A theory of test scores (Psychometric Monograph, No. 7). Madison: Psychometric Society.
Lord, F. M. (1980). Applications of item response theory to practical testing problems. Hillsdale: Erlbaum.
McDonald, R. P. (1981). The dimensionality of test and items. The British Journal of Mathematical and Statistical Psychology, 33(1), 161-183.
Nelson, K. G. (1996). Global information systems quality: key issues and challenges. Journal of Global Information Management, 4(4), 4-14. http://dx.doi. org/10.4018/jgim.1996100101.
Nielsen, J., & Loranger, H. (2006). Prioritizing web usability. California: New Riders.
Nielsen, J., & Tahir, M. 2002. Homepage usability: 50 sites deconstructed. Indianapolis: New Riders Publishing.