1
The genetic background of the clustering of metabolic traits in children and adolescents: a study of Portuguese twins
Karri Silventoinen, PhD1, Élvio Gouveia, PhD,2,3, Aline Jelenkovic, PhD1,4, José Maia, Professor5, António M Antunes, PhD2, Miguel A A Pinheiro de Carvalho, PhD6, António M Brehm,
Professor7, Martine Thomis, Professor8, Johan Lefevre, Professor8, Jaakko Kaprio, Professor9,10, Duarte Freitas, PhD2,11
1Population Research Unit, Department of Social Research, University of Helsinki, Helsinki,
Finland
2Department of Physical Education and Sport, University of Madeira, Funchal, Portugal
3Center for the Interdisciplinary Study of Gerontology and Vulnerability, University of Geneva,
Geneva, Switzerland
4Department of Genetics, Physical Anthropology and Animal Physiology, University of the Basque
Country UPV/EHU, Leioa, Spain
5Centre of Research, Education, Innovation and Intervention in Sport, Faculty of Sport, University
of Porto, Porto, Portugal
6ISOPlexis Genebank, University of Madeira, Funchal, Portugal 7Human Genetics Laboratory, University of Madeira, Funchal, Portugal
8Physical Activity, Sports & Health Research Group, Department of Kinesiology, Faculty of
Kinesiology and Rehabilitation Sciences, KU Leuven, Leuven, Belgium
9Institute for Molecular Medicine Finland (FIMM), University of Helsinki, Helsinki, Finland 10Department of Public Health, University of Helsinki, Helsinki, Finland
11Department of Mathematical Sciences, University of Essex, Colchester, United Kingdom
Running title: Genetics of the clustering of metabolic traits Funding
The project “Genetic and environmental influences on physical activity, fitness and health: the Madeira family study” was supported by the Fundação para a Ciência e a Tecnologia (FCT), reference POCI/DES/56834/2004. This study was additionally supported by the Academy of Finland (#266592 for KS and #263278 for JK).
2 Corresponding:
Karri Silventoinen
University of Helsinki, Population Research Unit, Department of Social Research P.O. Box 18, FIN-00014 University of Helsinki, Finland
GSM: +358400-620726
3 Abstract
Background: It is well known that the metabolic risk factors of cardiovascular diseases are correlated, but the background of this clustering in children is more poorly known than in adults. Thus, we studied the contribution of genetic and environmental factors to the clustering of metabolic traits in childhood and adolescence.
Methods: Nine metabolic traits were measured in 214 complete twin pairs aged 3 to 18 years in the Autonomous Region of Madeira, Portugal, in 2007 and 2008. The variation of and covariations between the traits were decomposed into genetic and environmental components by using classical genetic twin modeling.
Results: A model including additive genetic and environmental factors unique for each twin individual explained the variation of the metabolic factors well. Under this model, the heritability estimates varied from 0.47 (systolic blood pressure in children under 12 years of age) to 0.91 (HDL cholesterol in adolescents 12 years of age or older). The most systematic correlations were found between adiposity (body mass index and waist circumference) and blood lipids (HDL cholesterol, LDL cholesterol and triglycerides), as well as blood pressure. These correlations were mainly explained by common genetic factors.
Conclusions: Our results suggest that obesity, in particular, is behind the clustering of metabolic factors in children and adolescents. Both general and abdominal obesity partly share the same genetic background as blood lipids and blood pressure. Obesity prevention already in childhood is important in reducing the risk of metabolic diseases in adulthood.
4
5
Cardiovascular diseases (CVD) are the leading causes of death in developing countries (1). The clustering of metabolic factors, sometimes called metabolic syndrome, importantly increases the risk for CVD (2). The metabolic abnormalities included in metabolic syndrome vary between clinical definitions. However, obesity, especially abdominal obesity measured as waist
circumference (WC), blood pressure, fasting glucose and blood lipids are commonly included (3). Since these metabolic factors importantly mediate the effect of health behavior on CVD risk, understanding the role of the genes and environment behind the variation and clustering of them is important for further health interventions.
The concept of metabolic syndrome is under critical debate, but the correlations between these metabolic factors are well demonstrated. The classical theory suggests a set of genes which have been beneficial when conserving energy at the time of scanty nutrition but lead to metabolic abnormalities in this time of abundancy; however, other evolutionary hypotheses have also been proposed (4). Even when the claimed evolutionary background of this genetic component is difficult to be proven, recent studies have given evidence that genetic factors are behind these correlations. Studies on Belgian (5) and Danish adult twins (6) have shown that genetic factors explain a major part of the correlations between these traits. This is not surprising because these and several other twin studies on obesity (7), blood pressure (8), lipids (6), and glucose (9) have shown that genetic factors explain an important part of the variation of these metabolic traits in adulthood. Genome-wide association studies have also identified multiple genes associated with these traits as well as genetic correlations of various strengths between them (10,11). However, less is known about the role of genetic and environmental factors behind the correlations of these metabolic factors in children. In a study of Chinese children and adolescents, environmental factors shared by co-twins also affected the metabolic traits, in addition to genetic factors, but the correlations
6
metabolism can differ between children, adolescents and adults, as found previously for body mass index (BMI) (13).
A limitation of these previous studies is that they have mainly focused on adulthood and have disproportionally represented the Northern and Western parts of Europe, areas characterized by high mortality from coronary heart disease (CHD) (1). Childhood is, however, an important phase of life, which shapes the future risk of metabolic diseases, as seen, for example, in the strong stability of being overweight from childhood and adolescence into adulthood (14). CHD risk is lower in Southern Europe, which may in part be due to differences in nutrition between European countries. For example, the consumption of fresh vegetables and fish is higher is Southern Europe compared to Northern Europe (15). This can also have an effect on the role of genetic and
environmental factors in the metabolic traits, but, so far, only a few twin studies have been conducted in Southern European countries. Thus, we decided to study the role of genetic and environmental factors behind the variation of metabolic traits and their mutual correlations using Portuguese data on twin children and adolescents.
Data and methods
The data were derived from the Madeira Twin-Family Study conducted in 2007 and 2008 in the Autonomous Region of Madeira, Portugal, with a population of 289,000 inhabitants (16). The executive boards of all public and private schools in Madeira (n = 236) were contacted and asked if they had twin students. Based on this information, an invitation letter was sent to 434 twin families, and 214 families agreed to participate in the study. Together, we had data on 87 monozygotic (MZ), 71 same-sex dizygotic (SSDZ) and 56 opposite-sex dizygotic (OSDZ) pairs. The age of the children varied from 3 to 18 years old, and 51% of them were girls. The study protocol was approved by the
7
Scientific Board of the University of Madeira, and the participants and/or their parents or legal guardians provided written informed consent.
During the physical examination in Funchal, the capital city of Madeira, registered nurses took fasting blood samples used for the measures of glucose, HDL cholesterol, LDL cholesterol, total cholesterol and triglycerides (Cobas Integra 800, Roche). Systolic (SBP) and diastolic blood pressure (DBP) were measured twice in a seated position on the non-dominant arm after 5-10 minutes rest. A digital device (Omron M6, HEM-7001-E) with cuff sizes appropriate for the child’s age and weight was used. The mean of the two measures was used if the difference between the readings was not more than 5 mmHg. In the case of a larger difference, the blood pressure measures were repeated. WC was measured at midway between the lower costal margin and the iliac crest in a standing position and rounded to the nearest 0.1 centimeter. Height was measured by a portable stadiometer (Siber-Hegner, GPM) the participant standing without shoes in an upright position and rounded to the nearest millimeter. Weight was measured in swimsuit and rounded to the nearest 100 grams. BMI was calculated by dividing weight in kilograms by the square of height in meters (kg/m2). Zygosity for the same-sex pairs was determined by at least 16 genetic markers (single
nucleotide polymorphisms or microsatellites). We conducted all analyses separately in children less than 12 years, who are mainly pre-pubertal, and children and adolescents 12 years of age or more (i.e., mainly during and after puberty). The effects of age and age squared were adjusted for separately in the two age groups and for boys and girls since they showed a statistically significant effect on some of the traits. Additionally for BMI, the z-scores were calculated over ages by using the UK-WHO growth reference data with the Egen procedure for the Stata software, version 13.1 for Windows (17). We checked the distribution of BMI z-scores and found no outliers, indicating that none of the participants were severely overweight.
8
Classical genetic twin modeling is based on the fact that MZ twins share virtually the same DNA sequence, whereas DZ twins share, on average, 50% of their genes identical-by-descent. Thus, if MZ twins are more similar than DZ twins, it indicates the presence of genetic influence. Using linear structural equation modeling, the variation of the metabolic traits was decomposed into an additive genetic component (A), which is the sum of the effects of all alleles affecting the trait, a shared environmental component (C) including all environmental factors shared by co-twins, and a unique environmental component (E) reflecting the effects of all environmental factors that make co-twins dissimilar, including measurement error (18). By definition, the additive genetic
correlation is 1 between MZ co-twins and 0.5 between DZ co-twins, whereas the correlation between the shared environmental factors is 1 and that between the unique environmental factors between both MZ and DZ co-twins is 0. Thus, the twin modeling simultaneously estimates the total genetic and environmental variation based on the similarity of MZ and DZ twins without the need to measure single genes or environmental exposures directly. Furthermore, we tested the presence of sex-specific genetic factors by studying whether the additive genetic correlation for OSDZ pairs is less than 0.5 which is expected for SSDZ pairs. The genetic models were fitted by the OpenMx package, version 2.0.1, which is part of the R statistical platform (19). All parameter estimates and corresponding 95% confidence intervals (95% CI) were estimated by the raw-data maximum likelihood method.
We used the additive genetic/ common environment/ specific environment (ACE) model as the starting point of the analyses based on the correlations by zygosity (Supplemental Table 1). The ACE model fitted the data well, suggesting that the assumptions of twin modeling (i.e., similar means and variances for MZ and DZ twins as well as first and second twin within a pair) were not violated. When comparing to the saturated models (i.e., models which estimate all possible mean and variance parameters freely), the difference of χ2 values was only statistically significant for
9
triglycerides (p=0.014), total cholesterol (p=0.018) and LDL cholesterol (p=0.036) in children 12 years of age or older. This indicates that genetic and environmental factors affect the variation of these metabolic traits in a similar way for both MZ and DZ twins. Using the same parameter estimates for boys and girls only worsened the model fit statistically significantly for glucose (p=0.022) and triglycerides (p=0.043) in children less than 12 years of age, and eliminating the sex specific genetic effect did not affect the model fit statistically significantly. When correcting the p-values for multiple testing by Bonferroni correction (18 tests, leading to a confidence level of p=0.003), none of the p-values were statistically significant. Thus, we used a genetic model with the same parameter estimates for boys and girls, without the sex-specific genetic component.
Furthermore, the common environmental component was not statistically significant except for triglycerides in the older age group (p=0.0114). However, because our data is not very large, we fitted both the ACE and a more parsimonious additive genetic/ specific environment (AE) model to obtain estimates for the level of common environmental influences.
We first calculated the proportions of variation explained by genetic factors (i.e., heritability) and environmental factors by using univariate models. After that, we studied the correlations between the metabolic traits by Cholesky decomposition, which decomposes all variation of and co-variation between the traits into uncorrelated factors (18). By this method, we calculated additive genetic and unique environmental correlations between the traits, as well as the proportions of trait correlations explained by these factors. In these models, we excluded total cholesterol because it is a
combination of HDL and LDL cholesterol.
10
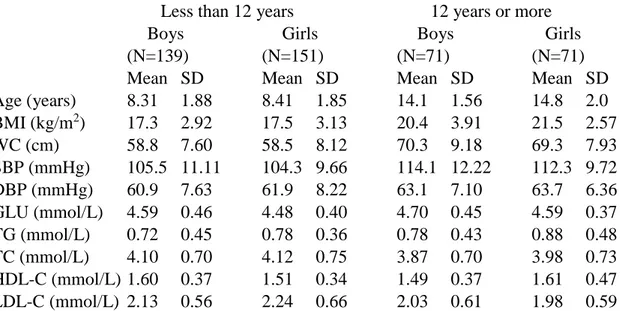
Table 1 presents the basic characteristics of the study cohort. Except for the cholesterol levels, mean values were higher in the older than in the younger age group. However, no systematic differences were seen in the variances. Boys had lower levels of triglycerides than girls, but otherwise the differences between boys and girls were small.
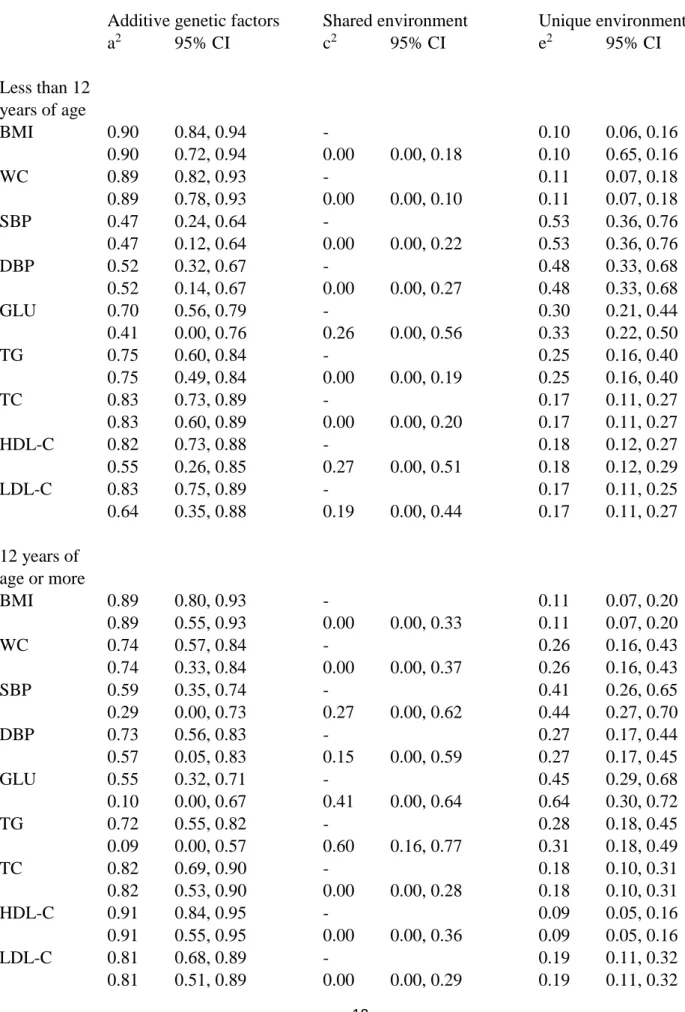
The relative proportions of variation explained by additive genetic, shared environmental and unique environmental factors are presented in Table 2. The shared environmental effects were generally small and not statistically significant. The strongest shared environmental effects were found for glucose (c2=0.41) and triglycerides (c2=0.60) in the older age group, but otherwise they were 0.27 or less, and for most of the traits the value was zero. If the more parsimonious AE model was used, the additive genetic effects absorbed the shared environmental effects. Under the AE model, the heritability estimates were generally high, but for SBP and DBP they were somewhat lower than for other traits, especially in the younger age groups. The heritability estimates varied from 0.47 for SBP in the younger age group to 0.91 for HDL cholesterol in the older age group.
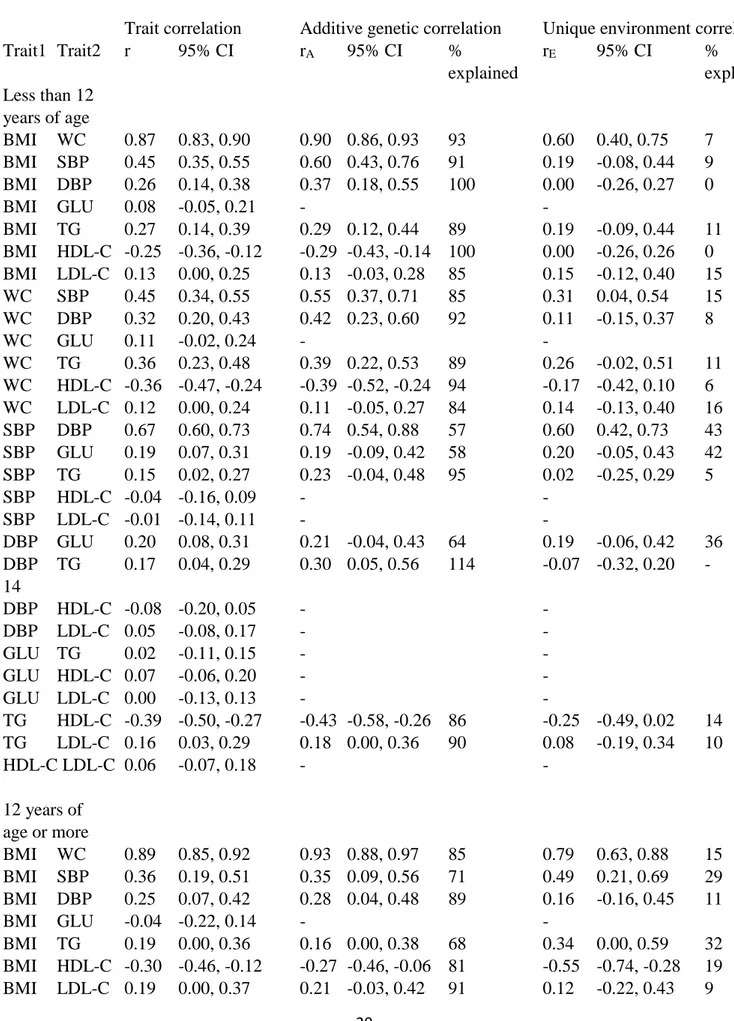
We then conducted Cholesky decomposition to analyze the correlations between the metabolic traits (Table 3). Since the shared environmental effect was zero for most of the traits and cannot,
therefore, explain covariation between these and other traits, we used only the AE model. The genetic and environmental correlations were presented only if the trait correlation was statistically significant. Adiposity measures (i.e., BMI and WC) showed the most systematic correlations with other metabolic measures, but these other measures were also moderately correlated. However, there were two notable exceptions for this general pattern. First, glucose levels showed no correlation with adiposity measures, and only weak or non-existent correlations with cholesterol measures. Second, SBP and DBP only showed robust correlations with the adiposity measures, whereas the correlations with cholesterol measures, glucose and triglycerides were weaker and most
11
of them statistically non-significant. As expected, the highest correlations were found between the two adiposity measures (r=0.87 in the younger and 0.89 in the older age group) followed by the two blood pressure measures (r=0.67 and 0.59, respectively). Otherwise, the correlations were 0.45, found between SBP and both BMI and WC in the younger age group or less.
When we decomposed these correlations into additive genetic and unique environmental
correlations, the additive genetic correlations were generally higher than the trait correlations. Most of the unique environmental correlations were not statistically significant, but they were generally in the same direction as the trait correlations. The major part of the covariation between the metabolic traits was explained by additive genetic factors. No systematic differences between the age groups were seen in the magnitude of the correlations.
Discussion
Based on our results, the genetic architecture of the mutual associations between the metabolic traits is largely similar in Portuguese children and adolescents to that previously found in Belgian (5) and Danish adults (6). The major part of the correlations between these metabolic traits was caused by common genetic factors. The strongest correlations were, as expected, found between SBP and DBP, as well as BMI and WC, but otherwise, adiposity indicators showed the most systematic correlations with other metabolic factors. This result is consistent with the two previous European twin studies (5,6). A common genetic component between baseline BMI and metabolic factors measured, on average, three years later were also found in a prospective study of South Korean adult twins (20). Thus, these results suggest that genetic factors are important drivers behind the clustering of these metabolic traits. However, the variation in the magnitude of these metabolic correlations does not support the hypothesis that there is only one common genetic component
12
behind these different metabolic traits (4). Rather, these twin study results seem to suggest that obesity, in particular, is behind the clustering, which corresponds well with the hypothesis of the central role of obesity in metabolic syndrome (3). We did not find evidence that the abdominal obesity indicator (WC) is more strongly associated with other metabolic traits than the general obesity indicator (BMI), as previously suggested (3). However, the correlation between these two indicators is so high that much larger data than available in this study would be needed to reliably decompose these effects.
The effect of the genetic and environmental factors on the variation for the obesity measures was at the same level as found in previous twin studies on adults (7), but somewhat higher heritability estimates for blood pressure (8) and blood glucose and lipids (6,9) were found, compared with previous adult twin studies. We did not find evidence for a role of shared environmental factors on the adiposity measures, even though they have been found to have a moderate effect on BMI in early and mid-childhood in a large international twin study (13). Also, for the other metabolic factors, we found only limited evidence of the role of shared environment. In this respect, our results differ from the results based on a Chinese twin study showing substantial shared
environmental components in the metabolic factors in both 8-12 year old children and 13-17 year old adolescents (12). This difference is interesting since a shared environmental component was found for BMI in another Chinese cohort of children (21), which was much larger than generally found in twin studies of children (13). This suggests that the role of shared environmental factors in childhood metabolism may vary between populations. In addition to the studies using twin data, there are studies estimating heritability using nuclear families, including also children. In
population-based Portuguese (22) and Spanish family studies (23) and in a study including Hispanic US families enriched for childhood obesity (24), much lower heritability estimates were found for the metabolic traits than found in our study. This is, however, a common finding in non-twin family
13
studies and is probably because of the fact that somewhat different sets of genes affect the
metabolic factors at different ages, as well demonstrated for BMI from childhood to adulthood (14). Thus, heritability estimates are likely to be underestimated, especially when studying children, if the study participants are not exactly at the same age at the time of measurement.
Our study has strengths, but also limitations. This is one of only a few studies using genetically informative data to analyze metabolic factors in children and adolescents, especially in a Southern European population. Using twins is especially important for children since different sets of genes probably affect metabolism as we age, and it is difficult to measure non-twin siblings or other relatives exactly at the same age. Our main limitation is that our dataset is too small to allow the estimation of both additive genetic and shared environmental effects simultaneously with adequate power, which is a common problem in twin studies if the sample size is not very large (25).
However, for most of the traits, the estimate of the shared environment was zero and, with two exceptions, the estimates were modest for other traits. We had not collected data on sexual maturation, and thus needed to classify twins according to age rather than using, for example, the Tanner classification of puberty. However, the previous studies on this topic did not use pubertal measures either, and thus the categorization by age allows for comparisons with the previous studies. Furthermore, our study cannot answer the question regarding which specific factors are behind the genetic and environmental variation. Both the genetic and environmental factors have been found to affect, for example, nutrition (26) and physical activity (27) in childhood and
adolescence, which can thus explain part of both genetic and environmental variation. Finally, twin pregnancies differ from singleton pregnancies, and thus, at birth, twins differ from singletons. However, this difference largely disappears during the first two years of life (28), and twins are likely to be comparable to singletons in our study population where the youngest children are three years of age. Also, the risk of metabolic diseases has been found to be similar in twins and
14
singletons (29,30), which further supports that our results could be generalized to the general population.
In conclusion, genetic factors explain the major part of correlations between metabolic factors in children and adolescents, and obesity measures, in particular, have an important role in this clustering. Our results suggest that co-morbidity found between metabolic diseases and obesity in adults already has roots in childhood and adolescence.
Author disclosure statement
No competing financial interests exist.
References
(1) Lozano R, Naghavi M, Foreman K, Lim S, Shibuya K, Aboyans V, et al. Global and regional mortality from 235 causes of death for 20 age groups in 1990 and 2010: a systematic analysis for the Global Burden of Disease Study 2010 Lancet 2012;380:2095-2128.
(2) Bonora E. The metabolic syndrome and cardiovascular disease. Ann Med 2006;38:64-68. (3) Grundy SM. Metabolic syndrome update. Trends Cardiovasc Med 2016;26:364-367.
(4) Sellayah D, Cagampang FR, Cox RD. On the evolutionary origins of obesity: a new hypothesis. Endocrinology 2014;155:1573-1588.
(5) Peeters MW, Thomis MA, Loos RJ, Derom CA, Fagard R, Vlietinck RF, et al. Clustering of metabolic risk factors in young adults: genes and environment. Atherosclerosis 2008;200:168-176. (6) Benyamin B, Sørensen TIA, Schousboe K, Fenger M, Visscher PM, Kyvik KO. Are there common genetic and environmental factors behind the endophenotypes associated with the metabolic syndrome? Diabetologia 2007;50:1880-1888.
(7) Schousboe K, Willemsen G, Kyvik KO, Mortensen J, Boomsma DI, Cornes BK, et al. Sex differences in heritability of BMI: a comparative study of results from twin studies in eight countries. Twin Res 2003;6:409-421.
(8) Evans A, Van Baal GC, McCarron P, DeLange M, Sørensen TIA, De Geus EJ, et al. The genetics of coronary heart disease: the contribution of twin studies. Twin Res 2003;6:432-441.
15
(9) van Dongen J, Willemsen G, Chen WM, de Geus EJ, Boomsma DI. Heritability of metabolic syndrome traits in a large population-based sample. J Lipid Res 2013;54:2914-2923.
(10) Rankinen T, Sarzynski MA, Ghosh S, Bouchard C. Are there genetic paths common to obesity, cardiovascular disease outcomes, and cardiovascular risk factors? Circ Res 2015(116):909-922. (11) Bulik-Sullivan B, Finucane HK, Anttila V, Gusev A, Day FR, Loh PR, et al. An atlas of genetic correlations across human diseases and traits. Nat Genet 2015;47:1236-1241.
(12) Ji F, Ning F, Duan H, Kaprio J, Zhang D, Zhang D, et al. Genetic and environmental
influences on cardiovascular disease risk factors: a study of Chinese twin children and adolescents. Twin Res Hum Genet 2014;17:72-79.
(13) Silventoinen K, Jelenkovic A, Sund R, Hur Y, Yokoyama Y, Honda C, et al. Genetic and environmental effects on body mass index from infancy to the onset of adulthood: an individual-based pooled analysis of 45 twin cohorts participating in the COllaborative project of Development of Anthropometrical measures in Twins (CODATwins) study. Am J Clin Nutr 2016;104:371-379. (14) Silventoinen K, Kaprio J. Genetics of tracking of body mass index from birth to late middle age: evidence from twin and family studies. Obesity Facts 2009;2:196-202.
(15) Elmadfa I, Weichselbaum R. On the nutrition and health situation in the European Union. J Public Health 2005;13:62-68.
(16) Maia JA, Santos D, de Freitas DL, Thomis M. Physical activity, physical fitness, gross motor coordination, and metabolic syndrome: focus of twin research in Portugal. Twin Research and Human Genetics 2013;16:296-301.
(17) Vidmar SI, Cole TJ, Pan H. Standardizing anthropometric measures in children and adolescents with functions for egen: update. Stata Journal 2013;13:366-378.
(18) Kaprio J, Silventoinen K. Advanced methods in twin studies. Methods Mol Biol 2011;713:143-152.
(19) Neale MC, Hunter MD, Pritikin JN, Zahery M, Brick TR, Kirkpatrick RM, et al. OpenMx 2.0: Extended structural equation and statistical modeling. Psychometrika 2016;81:535-549.
(20) Song YM, Sung J, Lee K. Genetic and environmental relationships of metabolic and weight phenotypes to metabolic syndrome and diabetes: The Healthy Twin Study. Metab Syndr Relat Disord 2015;13:36-44.
(21) Liu Q, Yu C, Gao W, Cao W, Lyu J, Wang S, et al. Genetic and Environmental Effects on Weight, Height, and BMI Under 18 Years in a Chinese Population-Based Twin Sample. Twin Res Human Genet 2015;18:571-580.
(22) Santos DM, Katzmarzyk PT, Trégouet DA, Gomes TN, Santos FK, Maia JA. Familial aggregation of metabolic syndrome indicators in Portuguese families. Biomed Res Int 2013;314823:doi: 10.1155/2013/314823.
16
(23) Jelenkovic A, Poveda A, Rebato E. A statistical investigation into the sharing of common genetic factors between blood pressure and obesity phenotypes in nuclear families from the Greater Bilbao (Spain). J Hypertens 2010;28:723-731.
(24) Butte NF, Comuzzie AG, Cole SA, Mehta NR, Cai G, Tejero M, et al. Quantitative genetic analysis of the metabolic syndrome in Hispanic children. Pediatr Res 2005;58:1243-1248.
(25) Visscher PM, Gordon S, Neale MC. Power of the classical twin design revisited: II detection of common environmental variance. Twin Res Hum Genet 2008;11:48-54.
(26) Breen FM, Plomin R, Wardle J. Heritability of food preferences in young children. Physiol Behav 2006;88:443-447.
(27) Aaltonen S, Ortega-Alonso A, Kujala UM, Kaprio J. Genetic and environmental influences on longitudinal changes in leisure-time physical activity from adolescence to young adulthood. Twin Res Hum Genet 2013;16:535-543.
(28) Silventoinen K, Yokoyama Y, Rasmussen F. Twins studies on anthropometrics: exploring the role of genetic and environmental factors. In: Preedy VR, editor. Handbook of Growth and Growth Monitoring in Health and Disease New York, Dordrecht, Heidelberg, London: Springer; 2012. p. 27-73.
(29) Christensen K, Wienke A, Skytthe A, Holm NV, Vaupel JW, Yashin AI. Cardiovascular mortality in twins and the fetal origins hypothesis. Twin Res 2001;4:344-349.
(30) Petersen I, Nielsen MM, Beck-Nielsen H, Christensen K. No evidence of a higher 10 year period prevalence of diabetes among 77,885 twins compared with 215,264 singletons from the Danish birth cohorts 1910-1989 Diabetologia 2011;54:2016-2024.
17
Table 1. Means and standard deviations (SD) of metabolic factors by sex and age.
Less than 12 years 12 years or more
Boys Girls Boys Girls
(N=139) (N=151) (N=71) (N=71)
Mean SD Mean SD Mean SD Mean SD
Age (years) 8.31 1.88 8.41 1.85 14.1 1.56 14.8 2.0 BMI (kg/m2) 17.3 2.92 17.5 3.13 20.4 3.91 21.5 2.57 WC (cm) 58.8 7.60 58.5 8.12 70.3 9.18 69.3 7.93 SBP (mmHg) 105.5 11.11 104.3 9.66 114.1 12.22 112.3 9.72 DBP (mmHg) 60.9 7.63 61.9 8.22 63.1 7.10 63.7 6.36 GLU (mmol/L) 4.59 0.46 4.48 0.40 4.70 0.45 4.59 0.37 TG (mmol/L) 0.72 0.45 0.78 0.36 0.78 0.43 0.88 0.48 TC (mmol/L) 4.10 0.70 4.12 0.75 3.87 0.70 3.98 0.73 HDL-C (mmol/L) 1.60 0.37 1.51 0.34 1.49 0.37 1.61 0.47 LDL-C (mmol/L) 2.13 0.56 2.24 0.66 2.03 0.61 1.98 0.59
BMI=body mass index; WC=waist circumference; SBP=systolic blood pressure; DBP=diastolic blood pressure; GLU=fasting glucose; TG=fasting triglycerides; TC=total cholesterol; HDL-C= HDL cholesterol; LDL-C=LDL cholesterol
18
Table 2. The proportion of variation of metabolic traits explained by additive genetic (a2), shared
environmental (c2) and unique environmental (e2) factors under different genetic models by age. Additive genetic factors Shared environment Unique environment
a2 95% CI c2 95% CI e2 95% CI Less than 12 years of age BMI 0.90 0.84, 0.94 - 0.10 0.06, 0.16 0.90 0.72, 0.94 0.00 0.00, 0.18 0.10 0.65, 0.16 WC 0.89 0.82, 0.93 - 0.11 0.07, 0.18 0.89 0.78, 0.93 0.00 0.00, 0.10 0.11 0.07, 0.18 SBP 0.47 0.24, 0.64 - 0.53 0.36, 0.76 0.47 0.12, 0.64 0.00 0.00, 0.22 0.53 0.36, 0.76 DBP 0.52 0.32, 0.67 - 0.48 0.33, 0.68 0.52 0.14, 0.67 0.00 0.00, 0.27 0.48 0.33, 0.68 GLU 0.70 0.56, 0.79 - 0.30 0.21, 0.44 0.41 0.00, 0.76 0.26 0.00, 0.56 0.33 0.22, 0.50 TG 0.75 0.60, 0.84 - 0.25 0.16, 0.40 0.75 0.49, 0.84 0.00 0.00, 0.19 0.25 0.16, 0.40 TC 0.83 0.73, 0.89 - 0.17 0.11, 0.27 0.83 0.60, 0.89 0.00 0.00, 0.20 0.17 0.11, 0.27 HDL-C 0.82 0.73, 0.88 - 0.18 0.12, 0.27 0.55 0.26, 0.85 0.27 0.00, 0.51 0.18 0.12, 0.29 LDL-C 0.83 0.75, 0.89 - 0.17 0.11, 0.25 0.64 0.35, 0.88 0.19 0.00, 0.44 0.17 0.11, 0.27 12 years of age or more BMI 0.89 0.80, 0.93 - 0.11 0.07, 0.20 0.89 0.55, 0.93 0.00 0.00, 0.33 0.11 0.07, 0.20 WC 0.74 0.57, 0.84 - 0.26 0.16, 0.43 0.74 0.33, 0.84 0.00 0.00, 0.37 0.26 0.16, 0.43 SBP 0.59 0.35, 0.74 - 0.41 0.26, 0.65 0.29 0.00, 0.73 0.27 0.00, 0.62 0.44 0.27, 0.70 DBP 0.73 0.56, 0.83 - 0.27 0.17, 0.44 0.57 0.05, 0.83 0.15 0.00, 0.59 0.27 0.17, 0.45 GLU 0.55 0.32, 0.71 - 0.45 0.29, 0.68 0.10 0.00, 0.67 0.41 0.00, 0.64 0.64 0.30, 0.72 TG 0.72 0.55, 0.82 - 0.28 0.18, 0.45 0.09 0.00, 0.57 0.60 0.16, 0.77 0.31 0.18, 0.49 TC 0.82 0.69, 0.90 - 0.18 0.10, 0.31 0.82 0.53, 0.90 0.00 0.00, 0.28 0.18 0.10, 0.31 HDL-C 0.91 0.84, 0.95 - 0.09 0.05, 0.16 0.91 0.55, 0.95 0.00 0.00, 0.36 0.09 0.05, 0.16 LDL-C 0.81 0.68, 0.89 - 0.19 0.11, 0.32 0.81 0.51, 0.89 0.00 0.00, 0.29 0.19 0.11, 0.32
19
BMI=body mass index; WC=waist circumference; SBP=systolic blood pressure; DBP=diastolic blood pressure; GLU=fasting glucose; TG= fasting triglycerides; TC=total cholesterol; HDL-C=HDL cholesterol; LDL-C=LDL cholesterol; CI=confidence interval
20
Table 3. Trait correlations of metabolic factors and correlations between additive genetic (rA) and
unique environmental variance components (rE) explaining these trait correlations.
Trait correlation Additive genetic correlation Unique environment correlation
Trait1 Trait2 r 95% CI rA 95% CI % rE 95% CI % explained explained Less than 12 years of age BMI WC 0.87 0.83, 0.90 0.90 0.86, 0.93 93 0.60 0.40, 0.75 7 BMI SBP 0.45 0.35, 0.55 0.60 0.43, 0.76 91 0.19 -0.08, 0.44 9 BMI DBP 0.26 0.14, 0.38 0.37 0.18, 0.55 100 0.00 -0.26, 0.27 0 BMI GLU 0.08 -0.05, 0.21 - - BMI TG 0.27 0.14, 0.39 0.29 0.12, 0.44 89 0.19 -0.09, 0.44 11 BMI HDL-C -0.25 -0.36, -0.12 -0.29 -0.43, -0.14 100 0.00 -0.26, 0.26 0 BMI LDL-C 0.13 0.00, 0.25 0.13 -0.03, 0.28 85 0.15 -0.12, 0.40 15 WC SBP 0.45 0.34, 0.55 0.55 0.37, 0.71 85 0.31 0.04, 0.54 15 WC DBP 0.32 0.20, 0.43 0.42 0.23, 0.60 92 0.11 -0.15, 0.37 8 WC GLU 0.11 -0.02, 0.24 - - WC TG 0.36 0.23, 0.48 0.39 0.22, 0.53 89 0.26 -0.02, 0.51 11 WC HDL-C -0.36 -0.47, -0.24 -0.39 -0.52, -0.24 94 -0.17 -0.42, 0.10 6 WC LDL-C 0.12 0.00, 0.24 0.11 -0.05, 0.27 84 0.14 -0.13, 0.40 16 SBP DBP 0.67 0.60, 0.73 0.74 0.54, 0.88 57 0.60 0.42, 0.73 43 SBP GLU 0.19 0.07, 0.31 0.19 -0.09, 0.42 58 0.20 -0.05, 0.43 42 SBP TG 0.15 0.02, 0.27 0.23 -0.04, 0.48 95 0.02 -0.25, 0.29 5 SBP HDL-C -0.04 -0.16, 0.09 - - SBP LDL-C -0.01 -0.14, 0.11 - - DBP GLU 0.20 0.08, 0.31 0.21 -0.04, 0.43 64 0.19 -0.06, 0.42 36 DBP TG 0.17 0.04, 0.29 0.30 0.05, 0.56 114 -0.07 -0.32, 0.20 -14 DBP HDL-C -0.08 -0.20, 0.05 - - DBP LDL-C 0.05 -0.08, 0.17 - - GLU TG 0.02 -0.11, 0.15 - - GLU HDL-C 0.07 -0.06, 0.20 - - GLU LDL-C 0.00 -0.13, 0.13 - - TG HDL-C -0.39 -0.50, -0.27 -0.43 -0.58, -0.26 86 -0.25 -0.49, 0.02 14 TG LDL-C 0.16 0.03, 0.29 0.18 0.00, 0.36 90 0.08 -0.19, 0.34 10 HDL-C LDL-C 0.06 -0.07, 0.18 - - 12 years of age or more BMI WC 0.89 0.85, 0.92 0.93 0.88, 0.97 85 0.79 0.63, 0.88 15 BMI SBP 0.36 0.19, 0.51 0.35 0.09, 0.56 71 0.49 0.21, 0.69 29 BMI DBP 0.25 0.07, 0.42 0.28 0.04, 0.48 89 0.16 -0.16, 0.45 11 BMI GLU -0.04 -0.22, 0.14 - - BMI TG 0.19 0.00, 0.36 0.16 0.00, 0.38 68 0.34 0.00, 0.59 32 BMI HDL-C -0.30 -0.46, -0.12 -0.27 -0.46, -0.06 81 -0.55 -0.74, -0.28 19 BMI LDL-C 0.19 0.00, 0.37 0.21 -0.03, 0.42 91 0.12 -0.22, 0.43 9
21 WC SBP 0.31 0.13, 0.46 0.25 -0.08, 0.50 53 0.43 0.15, 0.65 47 WC DBP 0.18 0.00, 0.35 0.25 -0.02, 0.49 102 -0.01 -0.31, 0.30 -2 WC GLU 0.01 -0.17, 0.19 - - WC TG 0.19 0.01, 0.36 0.12 -0.15, 0.36 45 0.39 0.10, 0.62 55 WC HDL-C -0.28 -0.45, -0.10 -0.27 -0.47, -0.03 77 -0.42 -0.65, -0.12 23 WC LDL-C 0.19 0.01, 0.37 0.20 -0.06, 0.44 80 0.18 -0.16, 0.47 20 SBP DBP 0.59 0.45, 0.69 0.68 0.45, 0.85 76 0.42 0.14, 0.64 24 SBP GLU -0.02 -0.20, 0.16 - - SBP TG 0.10 -0.08, 0.28 - - SBP HDL-C -0.22 -0.39, -0.03 -0.25 -0.47, 0.01 85 -0.17 -0.46, 0.14 15 SBP LDL-C 0.17 -0.02, 0.34 - - DBP GLU 0.03 -0.15, 0.21 - - DBP TG 0.10 -0.09, 0.28 - - DBP HDL-C -0.08 -0.26, 0.11 - - DBP LDL-C 0.20 0.01, 0.37 0.28 0.01, 0.53 105 -0.04 -0.36, 0.28 -5 GLU TG 0.14 -0.04, 0.32 - - GLU HDL-C 0.07 -0.11, 0.26 - - GLU LDL-C 0.19 0.00, 0.36 0.13 -0.17, 0.41 47 0.36 0.05, 0.59 53 TG HDL-C -0.35 -0.50, -0.17 -0.37 -0.56, -0.14 86 -0.30 -0.55, 0.01 14 TG LDL-C 0.22 0.03, 0.39 0.22 -0.04, 0.45 75 0.24 -0.08, 0.51 25 HDL-C LDL-C -0.19 -0.37, 0.00 -0.20 -0.41, 0.03 92 -0.12 -0.42, 0.22 8
BMI=body mass index; WC=waist circumference; SBP=systolic blood pressure; DBP=diastolic blood pressure; GLU=fasting glucose; TG=fasting triglycerides; TC=total cholesterol; HDL-C= HDL cholesterol; LDL-C=LDL cholesterol
Supplemental Table 1. Number of complete twin pairs and within pair Pearson correlations adjusted for age in children and adolescence by sex and zygosity.
Boys Girls Opposite sex
MZ twins DZ twins MZ twins DZ twins DZ twins
N r N r N r N r N r Less than 12 years of age BMI 24 0.92 23 0.66 28 0.85 25 0.22 45 0.34 WC 24 0.85 23 0.55 28 0.88 25 0.30 45 0.16 SBP 23 0.48 23 0.35 28 0.55 24 0.32 44 -0.05 DBP 23 0.55 23 0.43 28 0.58 24 0.52 45 -0.12 GLU 24 0.61 22 0.27 27 0.73 24 0.44 45 0.60 TG 24 0.56 21 0.10 27 0.75 23 0.64 43 0.27 TC 24 0.87 22 0.50 27 0.80 24 0.55 45 0.13 HDL-C 24 0.87 22 0.50 27 0.69 24 0.58 45 0.60 LDL-C 24 0.82 22 0.63 27 0.84 24 0.69 45 0.28 12 years of age or more BMI 19 0.94 11 0.52 16 0.84 12 0.12 11 0.49 WC 19 0.91 11 0.17 16 0.61 14 0.22 11 0.28 SBP 19 0.73 9 0.55 16 0.23 14 0.29 11 0.79 DBP 19 0.76 10 0.73 16 0.74 14 0.37 11 -0.02 GLU 19 0.40 9 0.38 16 0.67 14 0.41 11 0.54 TG 19 0.72 9 0.33 16 0.39 14 0.75 11 0.79 TC 19 0.85 9 0.67 16 0.89 14 -0.04 11 0.00 HDL-C 19 0.90 9 -0.24 16 0.93 14 0.40 11 0.69 LDL-C 19 0.83 9 0.82 16 0.89 14 -0.28 11 0.28
MZ=monozygotic; DZ=dizygotic; BMI=body mass index; WC=waist circumference; SBP=systolic blood pressure; DBP=diastolic blood pressure; GLU=fasting glucose; TG=fasting triglycerides; TC=total cholesterol; HDL-C= HDL cholesterol; LDL-C=LDL cholesterol