RBRH, Porto Alegre, v. 23, e4, 2018 Scientific/Technical Article
http://dx.doi.org/10.1590/2318-0331.0318170057
Analysis of the longitudinal distribution of pressures near the ends of the vertical and
horizontal faces in stepped spillway of slope 1V: 0.75H
Análise da distribuição longitudinal de pressões próximas às extremidades dos espelhos e patamares de vertedouro em degraus de declividade 1V:0,75H
Fabrício Machado Osmar1, Alba Valéria Brandão Canellas2, Priscila dos Santos Priebe1, Lorena Silva Saraiva1,
Eder Daniel Teixeira1 and Marcelo Giulian Marques1
1Universidade Federal do Rio Grande do Sul, Porto Alegre, RS, Brazil 2Furnas Centrais Hidrelétricas, Rio de Janeiro, RJ, Brazil
E-mails: [email protected] (FMO), [email protected] (AVBC), [email protected] (PSP), [email protected] (LSS), [email protected] (EDT), [email protected] (MGM)
Received: April 19, 2017 - Revised: September 20, 2017 - Accepted: October 18, 2017
ABSTRACT
Stepped spillways have been widely used for flood runoff due to of their constructive advantages and in regards to energy dissipation during the drop, allowing downstream dissipation structures to be designed in smaller dimensions. Due to the need for further studies on the effect of runoff in the chute of the stepped spillway and the analysis of dimensionless numbers used to characterize the longitudinal distribution of the pressures acting on the faces of the steps of a spillway, this study aims to characterize the acting forces on the steps of said spillways. Analyses were performed on a physical model of spillway with a slope of 1V: 0.75H and steps with a height of 6 centimeters. The pressure fields on the steps were analyzed and compared with results found in literature. As a general finding concerning the pressure in the horizontal faces, it was ascertained that the traction and the compression loads have relatively similar magnitudes, the negative pressures being more intense. Regarding the maximum pressures at the horizontal faces of the steps, it should be emphasized that the maximum values of compression have occurred at the end of the chute and that the lower discharges yielded higher values of pressure coefficients.
Keywords: Dams; Stepped spillways; Pressures on spillways.
RESUMO
Vertedouros em degraus vem sendo muito utilizados para escoamento de cheias devido às suas vantagens construtivas e em relação à dissipação de energia durante a queda, possibilitando que as estruturas de dissipação a jusante possam ser projetadas em menores dimensões. Devido a necessidade de estudos mais aprofundados sobre a ação do escoamento na calha de vertedouros em degraus e a análise dos adimensionais utilizados para caracterizar a distribuição longitudinal das pressões atuantes nas faces dos degraus de um vertedouro, o presente estudo objetiva a caracterização dos esforços atuantes nos degraus dos referidos vertedouros. Foram realizadas análises sobre um modelo físicos de vertedouro com declividade de 1V:0,75H e degraus de 6 centímetros de altura. Os campos de pressões nos degraus foram analisados e comparados com os resultados disponíveis na bibliografia. Como constatação geral sobre as pressões nos espelhos verificou-se que os esforços de tração e compressão têm magnitudes relativamente semelhantes, sendo mais intensas as pressões negativas. Sobre as pressões máximas nos patamares, destaca-se que os valores máximos de compressão ocorreram no final da calha, percebendo-se que as menores vazões geraram maiores valores de coeficientes de pressões.
INTRODUCTION
Dams are structures used by mankind for centuries for a wide range of intents, such as water storage for supply purposes, for flood protection, and power generation, among others. These structures have extravasation mechanisms called spillways, which have the function of discharging the volumes of water surplus to the capacities of the reservoirs.
In several dams, the chute are constituted of steps with the objective of increasing the energy dissipation during the drop, enabling the downstream dissipation structures to be designed in smaller dimensions.
The use of stepped spillways as a form of energy dissipation is growing because of its great efficiency in reducing residual energy, for certain flow conditions, compared to smooth chutes and the development of the constructive technique of roller compacted concrete dams (RCC). Due to these factors, there is a need for more in-depth studies on the effect of the flow in the spillway structure, including the analysis of resulting pressures and forces acting on the steps, making it possible to achieve designs that are efficient, economical, and above all, that add security to the dams.
For structural and constructive reasons, stepped spillways have been used since antiquity, the earliest recorded being a 1300 BC structure, the Arkananian dam in Greece (CHANSON, 2015). However, according to Dai Prá et al. (2016), only as of the seventies, with the arise of new materials and constructive techniques, such as roller compacted concrete (RCC) and gabion structures, the interest in stepped chutes started to once again attract researchers and professionals in the field of hydraulic engineering.
Since then, several experimental models of spillways have been carried out by researchers such as Tozzi (1992), Sanagiotto (2003), Dai Prá (2004), Relvas and Pinheiro (2011), Zhang et al. (2012), Frizell et al. (2013), Sun and Chanson (2013), Dhatrak and Tatewar (2014), Husain et al. (2014), Conterato et al. (2015), Xu et al. (2015), Mirza et al. (2015), Dai Prá et al. (2016), Zhang and Chanson (2016) among others. Most of these studies focus on the energy dissipated by the steps and the residual energy in the bottom of the structure in order to give subsidies to the design of the dissipation structures. However, only a few studies adress the aspect of pressures in the steps, although their knowledge is of great importance for the structural designing, as well as for the outlining of low pressure regions, which allow the erosion/cavitation phenomenon to occur along the chutes of the spillways.
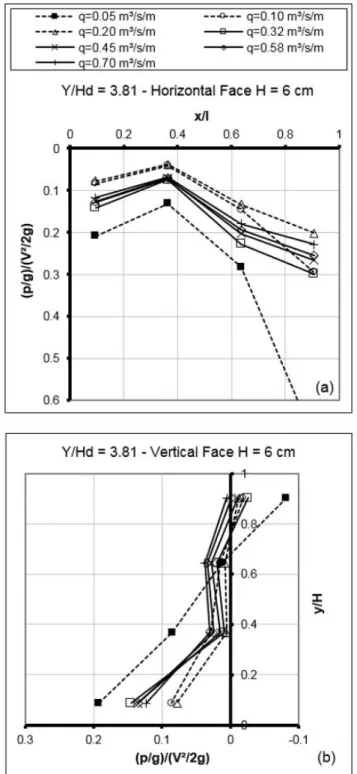
The pressures on the steps were analyzed by some authors, such as Sanagiotto (2003), Dai Prá (2004), Amador (2005), Gomes (2006), Conterato (2011), Osmar (2016) and others. Figures 1 and 2 show the mean pressure distribution and the extreme pressure distribution, respectively, on the faces of the spillway stepped according to Sanagiotto (2003) and Osmar (2016).
In Figure 1 (a) and (b) the mean pressure loads (p / )γ were made dimensionless in relation to the kinetic energy of the flow (V / 2g) and the positions of the tapping points are made 2 dimensionless in the vertical face (y / H) and in the horizontal face of the step (x / I), where H is the height of the step and l is the width of the step and x and y are the horizontal and vertical coordinates respectively (SANAGIOTTO, 2003).
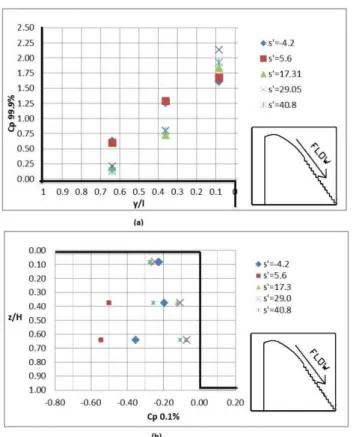
Figure 2 (a) shows the maximum extreme pressure coefficients that occur in the horizontal face of the steps associated with the non-exceedance probability of 99.9%. Figure 2 (b) shows the minimum extreme pressure coefficients occurring in the vertical
is the height of the step and l is the width of the step and z and y are the horizontal and vertical coordinates, respectively.
Figures 1 and 2 show that the pressures in the vertical face of the step reach negative values near the edge of the step and near the extremities of the horizontal faces of the steps the pressures are higher.
Therefore, the present paper aims to characterize the acting forces in stepped spillways by analyzing the variation of the acting pressures along the chute and their distributions on the faces of the steps, as well as analyzing the dimensionless numbers used by different authors in the characterization of the longitudinal pressure distribution.
MATERIALS AND METHODS
Hereinafter is shown the methodology of the research developed to meet the objective of characterizing the acting forces along a stepped spillway, through the analysis of its longitudinal distribution. The data analyzed were obtained by Conterato (2011) in a physical model of a stepped spillway built at the Hydraulic Works Laboratory of the Hydraulic Research Institute of the Federal University of Rio Grande do Sul (IPH / UFRGS). The model has the characteristics shown in Table 1:
According to the description by Conterato (2011), the data of the “instantaneous” pressures along the chute of the spillway were obtained through 20 pressure transducers of the brand Sitron, model SP96. Furthermore, the mean pressure data were also collected from 33 piezometers to verify the data collected by the transducers. Of the transducers used, 10 have a range of operation of ± 1.5 m.w.c. and 10 of ± 2.5 m.w.c. The two transducer models have an expected error of ± 0.5% of full scale.
The transducers were installed on the horizontal and vertical faces of the first 20 steps, 3 mm from the outer edge on the center line of the chute. Due to the difficulty of installation on all the steps simultaneously, because of the small distance between them, the tests were divided into two stages, first measuring the even steps and then the odd steps. The data was collected at a frequency of acquisition of 128 Hz over a 15 min interval. Further details on the tests can be obtained in the studies by Conterato (2011) and Osmar (2016). The specific yields tested in the model and the flow characteristics are shown in Table 2.
The rugged Froude of the step (F*) is defined in terms of the height of the roughness of the step, according to Equation 1:
( ) *
3 q F
g sen k
=
α (1)
Where:
q = specific yield; g = gravity acceleration; α = chute angle (°), (Figure 3);
k = roughness of the steps (Figure 3), calculated by Equation 2:
K H cos= α (2)
H = Step heigh.
The starting position of the aeration occurs when the thickness of the boundary layer reaches the total depth of the flow. According to Canellas et al. (2017), the analysis of aeration of the flow on stepped spillways by means of the position where the process of entry of air into the flow begins is important, since it is from this position that the flow acquires turbulent characteristics, dissipating the existing kinetic energy.
In order to characterize the pressures in the structures, the longitudinal distributions of the mean pressures, pressure fluctuations, minimum and maximum extreme pressures, associated to the non-exceedance probabilities of 0.1% and 99.9%, respectively, were calculated. Knowledge of these pressures allows for an estimate of the minimum and maximum values that the pressures can reach, even though they occur during a small amount of time.
Figure 2. Example of extreme pressure distribution on the faces of a stepped spillway (a) maximum extreme pressures in the horizontal face of the step (b) minimum extreme pressures in the vertical face of the step (adapted from Osmar, 2016).
Table 1. Basic characteristics of the physical model. Basic characteristics of the physical model
Chute slope 1V:0.75H
Chute height of the stepped spillway 2.45 m
Channel width 0.40 m
PRESSURES MADE DIMENSIONLESS
In order to allow comparison with the results of other authors, the pressures were made dimensionless through the pressure coefficient (Cp) according to Equations 3, 4, 5 and 6, for the mean pressure, pressure fluctuation, calculated from the standard deviation of the data sample, maximum and minimum extreme pressures, respectively. However, It should be highlighted that the use of this method for making the results dimensionless introduces errors in the calculation of the flow depth in each section.
m pmi 2 m P C V 2.g γ
= (3)
p i 2 m P C V 2.g σ
σ = γ (4)
99.9% p99.9%i 2 m P C V 2.g γ
= (5)
0.1% p0.1%i 2 m P C V 2.g γ
= (6)
Where:
Cpmi = mean pressure coefficient (dimensionless); Cpσi = pressure fluctuation coefficient (dimensionless);
Cp99.9%i = maximum extreme pressure coefficient (dimensionless); Cp0.1%i = minimum extreme pressure coefficient (dimensionless);
m P
γ = mean pressure load (m.w.c.), referenced to the edge of
the steps (Figure 4); Pσ
γ = pressure fluctuation load (m.w.c.), referenced to the edge
of the steps (Figure 4);
99.9% P
γ = maximum extreme pressure load with probability of
99.9% being lower (m.w.c.), referenced to the edge of the steps (Figure 4);
0.1% P
γ = minimum extreme pressure load with probability
of 0.1% being lower (m.w.c.),eferenced to the edge of the steps (Figure 4);
Vm = mean flow velocity in the section (m/s);
Table 2. Characteristics of the flow in the chute of the stepped spillway.
Discharge Specific yield Rough Froude
number Relative Height
Starting position of aeration
Q(m3/s) q(m3/s/m) F* dc/h L
A(m)
0.04 0.100 5.23 1.67 1.12
0.06 0.150 7.84 2.20 1.49
0.08 0.200 10.45 2.67 1.82
0.10 0.250 13.06 3.09 2.13
0.11 0.275 14.37 3.30 2.28
0.12 0.300 15.68 3.49 2.42
Where F* = Rugged Froude; dc = critical head; h = step heigh.
Figure 3. Dimensions of the stepped chute (DAI PRÁ, 2004).
Figure 4. Reference of the pressure loads in relation to the edge of the step.
g = gravity acceleration (m/s2); i = e = vertical face of the step; i = p = horizontal face of the step.
For the calculation of the flow depth in the starting position of aeration (di), the Equation 7 proposed by Sanagiotto (2003) was used and for the determination of the starting position of aeration (LA) the Equation 8 proposed in the same study was employed:
*0.5975 di 0.3965 F
k = (7)
*0.7014 A
L
9.7721 F
k = (8)
A
L 3.41
L
i d
0.971 0.891 e d
−
= + (9)
Where:
L = position along the chute measured from the crest of the spillway (m).
The positions of the measurement sections along the axis of the chute were made dimensionless by Equation 10:
( A) i L L s '
d
−
= (10)
Where:
s’ = dimensionless longitudinal position in the chute.
RESULTS AND DISCUSSION
This section shows the results obtained in the process of making the acting forces along the chute of the physical model of the stepped spillway dimensionless. The term “force” is being used taking into account the consideration that the measured pressures act on unitary areas generating forces on the surfaces.
Pressures acting on the vertical faces of the steps
The following are the results of mean pressures (Cpm), floating pressures (Cpσ), minimum pressures (Cp0.1%) and maximum pressures (Cp99.9%) in the vertical faces, m the measured values, all presented in the form of pressure coefficients.
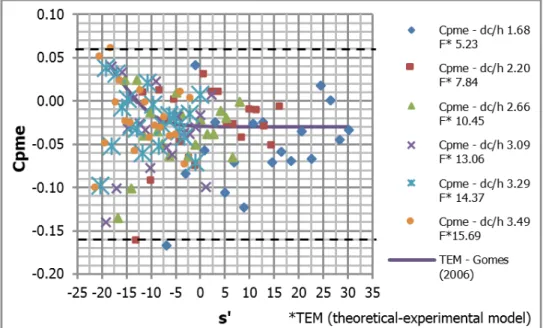
Figure 5 shows the longitudinal distribution of the mean pressure coefficient in the vertical faces (Cpme), where it is observed that the values are close to zero, ranging from -0.16 to 0.06, most of which are negative. These values reflect the fact that the vertical faces of the steps, are subjected to mean traction
and compression forces of similar magnitudes, with negative pressures being more intense.
It should be noted that the results of the this research are compatible with the theoretical-experimental model (TEM) proposed by Gomes (2006), as shown in Figure 5.
In Figure 6, it is possible to verify that the pressure fluctuation coefficient in the vertical face (Cpσe) had the same tendency as did the models proposed by Amador (2005) and Gomes (2006), however, with greater values of Cpσe. The segment near the starting point of aeration (-10 ≤ s’ ≤ 10) is the region that presented the greatest pressure fluctuations. From the position s’ ≥ ≈ 10 the values of Cpσe oscillate between 0.09 and 0.18.
In Figure 7 are shown the values of the minimum extreme pressure coefficients in the vertical face with probability of 0.1% being less than a certain value and the maximum extreme pressure coefficients in the horizontal face with probability of 99.9% being less than a certain value.
It should be noted that the maximum extreme values represented by Cp99.9%e in the segment:
* s’ < -10 (non-aerated): values increase and oscillate between 0.2 and 0.6;
* -10 ≤ s’ ≤ 10 (beginning of aeration): the values oscillate between 0.3 and 0.75;
* s’ > 10 (aerated): values range from 0.2 to 0.6.
For the values of the minimum extreme pressure coefficients with probability of 0.1% being lower (Cp0.1%e) it should be noted that:
* s’ < -10 (non-aerated): the values decrease and oscillate between -0.40 and 1.0;
* -10 ≤ s’ ≤ 10 (beginning of aeration) values contain the minimum value of Cp0.1%e and oscillate between -0.75 and -1.25;
* s’ > 10 (aerated) values range from -0.55 to -0.85.
Comparing with previous studies by Amador (2005) and Gomes (2006) the behavior of the data is similar. However, the results of Amador (2005) for Cp0.1%e follow under the upper data envelopment of the present study. And the results of the study by Gomes (2006) for Cp99.9%e follow under the lower data envelopment of the present paper. While, for Cp0.1%e the values display the same behavior, but with values higher than those of the present paper.
It should be highlighted that in the data of the present study, which were acquired in Conterato’s study (2011), the transducers were installed near the upper extremities of the vertical faces, in a relative position of 0.050 times the height of the step, for steps of 0.06 m while:
* Amador (2005): was at 0.050 times the height of the step and its step had a height of 0.07 m;
* Gomes (2006): was at 0.059 times the height of the step and its step had a height of 0.09 m.
Pressures acting on the horizontal faces of the steps
The pressures in the horizontal faces were statistically treated in the same way as the pressures in the vertical faces, that is, by verifying the mean values (Cpmp), pressure fluctuation (Cpσp) Figure 6. Pressure fluctuation coefficient in the vertical faces of the steps (Cpσe) for different discharges.
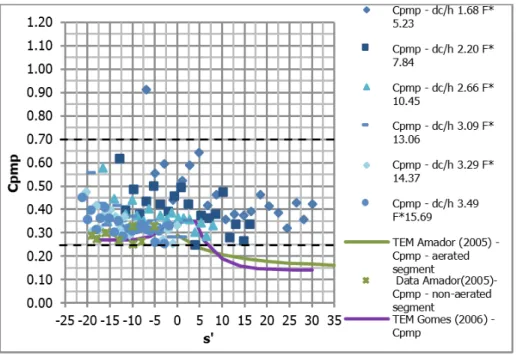
Figure 8. Mean pressure coefficient in the horizontal faces of the steps (Cpmp) for different discharges. and extremes, with non-exceedance probability of 0.1% (Cp0.1%p),
and 99.9% (Cp99.9%p).
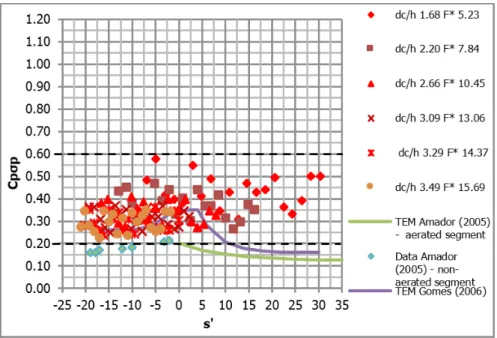
In Figure 8 it is possible to ascertain that the mean pressure coefficient in the horizontal face (Cpmp), did not have the same tendency as the models proposed by Amador (2005) and Gomes (2006) and are below the values of the present study, which varied between 0.25 and 0.70. Some factors may explain the cause of higher Cpmp values in the present study such as: transducer installation positions, closer to the outer extremities, difference in height of the steps and the relation dc/h not being the same in all three studies. It should be noted that the values for the highest dc/h of the present study are close to those of the study by Amador (2005).
In Figure 9, it is possible to verify that the values of pressure fluctuation coefficients in the horizontal faces (Cpσp) are higher than those of Amador (2005) and Gomes (2006), primarily for smaller relations dc/h. The values of the present study ranged from 0.20 to 0.60 and are of the same order of Cpmp. Probably among the factors that contribute to these differences are the particularities of installing the pressure transducers in the horizontal faces as mentioned previously.
In Figure 10, are shown the values of minimum extreme pressure coefficients in the horizontal face with probability of 0.1% (Cp0.1%p), of being lower and the maximum extreme pressure coefficients in the vertical face with probability of 99.9% (Cp99.9%p) of being less than a certain value. The values of Cp99.9%p range from 1.3 and 3.1. The maximum values occurred after the position s’> 0, and it was perceived that the smaller discharges generated higher values of Cp99.9%p. When compared to the tendency observed by Gomes (2006), it is noted that for s’ <0 the tendency is the same, but with higher values.
In therms of Cp0.1%p, values ranged from -0.25 to -1.0. The minimum values occurred after position s’> 0 and occurred
for the smallest discharges. When compared to the results of Gomes (2006), it should be noted that the data of the present study display similar tendency, but with greater values than those found by Gomes (2006).
The extreme pressure coefficients for the horizontal faces in Figure 10 show that the minimum values of Cp0.1%p remained in a range compatible with that proposed by Gomes (2006) for the relative positions s’ ≤ 10. However, the values obtained in the present study do not have the minimum point as obtained by Gomes (2006). The values were maintained in practically constant ranges up to s’ ≤ 10, ranging from -0.25 to -1.0 and showed a tendency to provide larger values, in modulus, from that point on. Comparing with the -0.25 value presented by Amador (2005), through histogram for position s’ = 0.95 and dc/h = 3.21, the results are also compatible and are within the range found in this study.
Still regarding the values of Cp0.1% more extreme observed on the horizontal faces, it should be noted that for the dc/h ratios of 1.68 to 2.2 the minimum was -1.0. These values are more extreme than the results of Gomes (2006), who recorded a minimum of -0.65 for this range of dc/h ratios. It should be emphasized that this author did not present results for positions upstream of the beginning of aeration for these dc/h ratios. For the upper range of discharges, dc/h ranged from 2.66 to 3.49 and the minimum Cp0.1% was of -0.75 and occurred at the relative position s’ = -15.
difference is even greater, but it should be noted that the result for this position was obtained with dc/h of 1.68 and that Amador (2005) presented the histogram for dc/h of 3.09.
It should also be highlighted that the transducers of the present study were installed in more external positions of the horizontal faces, in a relative position equal to 0.067 times the length of the step (0.045m), while:
* Amador (2005): it was at 0.14 times the length of the step and its step had a length of 0.056m;
* Gomes (2006): was at 0.06 times the length of the step and its step had a length of 0.0675m.
The fact that the tapping points are installed near the vertical face of the step results in mean pressures and lower pressure Figure 9. Pressure fluctuation coefficient on the horizontal faces of the steps (Cpσp) for different discharges.
fluctuations, this fact is already a consensus in the bibliography, and may be influencing the comparison between different authors.
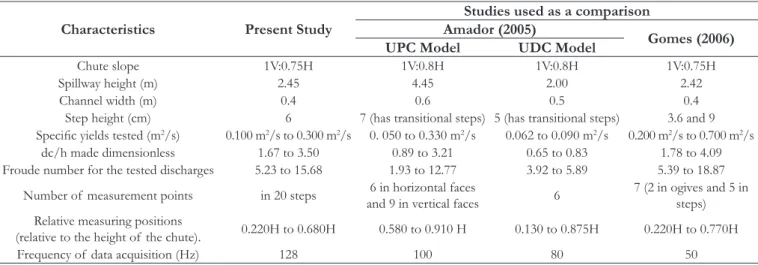
It should be emphasized that there is a large difference between the number of points in which the data were acquired in the present study compared to the previous ones. The data were collected in 20 instrumented steps, while Gomes (2006), for example, performed measurements in 6 steps and Amador (2005) performed measurements in 6 horizontal faces and 9 vertical faces. Table 3 shows the general characteristics of the present study and of the studies that were used to compare it with.
CONCLUSIONS
The objective of this paper was to characterize the acting forces in stepped spillways, through the analysis of the longitudinal distribution of pressures and the variation of the mean and extreme pressures acting along the chute, aiming at obtaining information that allowed further understanding of the phenomenon, so that the following conclusions can be drawn:
• The modules with the most intense minimum pressures (0.1%) in the vertical faces are higher than the modules of the maximum pressures (99.9%);
• The results of the maximum values of Cp (99.9%) in the vertical faces show that the maximums occurred in the initial segment of the chute;
• There is convergence with the results for the vertical faces in relation to Amador (2005) in most points. In relation to the results of Gomes (2006), the values overlap close to the starting point of aeration. For the other segments, the results of the present study were more extreme;
• The Cp 99.9% on the horizontal faces are higher than those reported by Amador (2005). However, it should be noted that in the present study, the transducers were installed in outer positions of the horizontal faces than those tested by Amador (2005);
• The differences ascertained in the results of the two experiments of the present study also had the contribution of the installation positions of the transducers;
• It should also be highlighted the large difference between the number of points in which the data were acquired in the present study compared to the previous ones, as shown in Table 3. When there are more instrumented steps, it is more likely that it will be measured more extreme forces, which are less frequent;
• The values of 0.1% Cp on the horizontal faces are compatible with the TEM proposed by Gomes (2006) for the relative positions (s’) lower than 10. Comparing with the Cp 0.1% point presented by Amador (2005), the results are also compatible for similar dc/h ratios;
• For the specific yield range tested (qprototype = 9.49 m2/s) the results indicate that there is no risk of cavitation;
• The maximum pressures (99.9%) on the horizontal faces, in the prototype scale are much lower than the characteristic compression strengths of conventional concretes;
• As for the pressures on the vertical faces, it can be ascertained that the minimum pressures have modules much lower than the typical traction strengths of the concrete, which are around 2 MPa. However, larger suction values (in modulus) were observed than the tear strenght observed by LNEC (PORTUGAL, 1981), which stated that tensions of -0.06 MPa are enough to tear grains of concrete, generating irregularities in the surfaces which result in processes that cause wear on faces.
The dimensionless numbers used to characterize the acting forces on the chute of the spillway according to the results of different researchers have divergences, beyond the possible causes cited, another reason could be due to the process of making the pressure coefficients dimensionless. When using the pressure coefficient, errors are introduced in the calculation of the depth of the flow in each section, which may cause divergences in the results of different experiments.
Table 3. Characteristics of the models.
Characteristics Present Study
Studies used as a comparison Amador (2005)
Gomes (2006) UPC Model UDC Model
Chute slope 1V:0.75H 1V:0.8H 1V:0.8H 1V:0.75H
Spillway height (m) 2.45 4.45 2.00 2.42
Channel width (m) 0.4 0.6 0.5 0.4
Step height (cm) 6 7 (has transitional steps) 5 (has transitional steps) 3.6 and 9
Specific yields tested (m2/s) 0.100 m2/s to 0.300 m2/s 0. 050 to 0.330 m2/s 0.062 to 0.090 m2/s 0.200 m2/s to 0.700 m2/s
dc/h made dimensionless 1.67 to 3.50 0.89 to 3.21 0.65 to 0.83 1.78 to 4.09 Froude number for the tested discharges 5.23 to 15.68 1.93 to 12.77 3.92 to 5.89 5.39 to 18.87
Number of measurement points in 20 steps 6 in horizontal faces
and 9 in vertical faces 6
7 (2 in ogives and 5 in steps) Relative measuring positions
(relative to the height of the chute). 0.220H to 0.680H 0.580 to 0.910 H 0.130 to 0.875H 0.220H to 0.770H
Thus, in order to characterize the acting pressures in the chute of different stepped spillway structures an alternative would be the use of a dimensionless number based on the geometric and hydraulic characteristics of the flow on the spillway chute.
ACKNOWLEDGEMENTS
To researcher Eliane Conterato who carried out the experiments analyzed in this research.
To CNPQ, Furnas Centrais Elétricas and Dona Francisca Energética S/A for the financing of the research project.
REFERENCES
AMADOR, A. Comportamiento Hidráulico de los Aliaderos escalonados em presas de hormigón compactado. 2005. Tese (Doutorado) - Universitat Politécnica de Catalunya, Barcelona, 2005.
CANELLAS, A. V. B.; PRIEBE, P. S.; DAI PRÁ, M.; MARQUES, M. G. Influência da aeração induzida por pilares no escoamento em vertedouros em degraus. In: Seminário Nacional de Grandes Barragens, 31., 2017, Belo Horizonte, MG. Anais… Rio de Janeiro: SBDB, 2017. CD-ROM.
CHANSON, H. Embankment overtopping protection systems. Acta Geotechnica, v. 10, n. 3, p. 305-318, 2015. http://dx.doi. org/10.1007/s11440-014-0362-8.
CONTERATO, E. Escoamento sobre vertedouro em degraus com declividade 1V:0,75H: caracterização das pressões e condições de aeração. 2011. 69 f. Trabalho de Conclusão de Curso (Graduação em Engenharia Civil) - Universidade Federal do Rio Grande do Sul, Porto Alegre, 2011.
CONTERATO, E.; MARQUES, M. G.; MEES, A. A. A. Proposta de uniformização das equações de previsão das características do escoamento sobre a calha de um vertedouro em degraus. RBRH: Revista Brasileira de Recursos Hídricos, v. 20, n. 1, p. 131-137, jan./mar. 2015. Available from: <http://www.abrh.org.br/SGCv3/ index.php?PUB=1&ID=176&SUMARIO=5034>. Access on: 12 mar. 2017.
DAI PRÁ, M. Características de escoamentos sobre vertedouros em degraus de declividade 1V:1H. 2004. 134 f. Dissertação (Mestrado em Recursos Hídricos e Saneamento Ambiental) - Universidade Federal do Rio Grande do Sul, Porto Alegre, 2004.
DAI PRÁ, M.; PRIEBE, P. S.; SANAGIOTTO, D. G.; MARQUES, M. G. Dissipação de energia do escoamento deslizante sobre turbilhões em vertedouros em degraus de declividade 1V:1H. Ingeniería del Agua, v. 20, n. 1, p. 131, 2016. https://doi.org/10.4995/ ia.2016.3714.
DHATRAK, A. I.; TATEWAR, S. P. Air entrainment and pressure fields over stepped spillway in skimming flow regime. Journal of Power and Energy Engineering, v. 2, n. 04, p. 53-57, 2014. http:// dx.doi.org/10.4236/jpee.2014.24008.
FRIZELL, K. W.; RENNA, F. M.; MATOS, J. Cavitation potential of flow on stepped spillways. Journal of Hydraulic Engineering, v. 139, n. 6, p. 630-636, 2013. http://dx.doi.org/10.1061/(ASCE) HY.1943-7900.0000715.
GOMES, J. Campo de pressões: condições de incipiência à cavitação em vertedouros em degraus com declividade 1V:0,75H. 2006. 173 f. Tese (Doutorado em Recursos Hídricos e Saneamento Ambiental) - Universidade Federal do Rio Grande do Sul, Porto Alegre, 2006.
HUSAIN, S. M.; MUHAMMED, J. R.; KARUNARATHNA, H. U.; REEVE, D. E. Investigation of pressure variations over stepped spillways using smooth particle hydrodynamics. Advances in Water Resources, v. 66, p. 52-69, 2014. http://dx.doi.org/10.1016/j. advwatres.2013.11.013.
MEIRELES, I.; RENNA, F.; MATOS, J.; BOMBARDELLI, F. Skimming, nonaereted flow on stepped spillways over roller compacted concrete dams. Journal of Hydraulic Engineering, v. 138, n. 10, p. 870-877, 2012. http://dx.doi.org/10.1061/(ASCE) HY.1943-7900.0000591.
MIRZA, M. J. O.; MATOS, J.; PFISTER, M.; SCHLEISS, A. J. Air entrainment and pressure development in skimming flow on na abrupt slope change on stepped spillways. In: IAHR World Congress, 36., 2015, The Hague, Netherlands. Proceedings… Madrid: IAHR, 2015.
OSMAR, F. M. Análise de esforços sobre vertedouros em degraus de declividade 1V:0,75H. 2016. 84 f. Dissertação (Mestrado em Recursos Hídricos e Saneamento Ambiental) - Universidade Federal do Rio Grande do Sul, Porto Alegre, 2016.
PORTUGAL. Ministério da Habitação de Obras Públicas. Laboratório Nacional de Engenharia Civil. Critérios para dimensionamento hidráulico de barragens descarregadoras. Lisboa, 1981. Memória, 556.
RELVAS, A. T.; PINHEIRO, A. N. Stepped Chutes lined with wedge-shaped concrete blocks: hydrodynamic pressures on blocks and stability analysis. Canadian Journal of Civil Engineering, v. 38, n. 3, p. 338-349, 2011. http://dx.doi.org/10.1139/L11-003.
SANAGIOTTO, D. Características do Escoamento sobre Vertedouros em Degraus de Declividade 1V:0,75H. 2003. 118 f. Dissertação (Mestrado em Recursos Hídricos e Saneamento Ambiental) - Universidade Federal do Rio Grande do Sul, Porto Alegre, 2003.
SUN, S.; CHANSON, H. Characteristics of clustered particles in skimming flowson a stepped spillway. H. Environmental Fluid Mechanics, v. 13, n. 1, p. 73-87, 2013. http://dx.doi.org/10.1007/ s10652-012-9255-2.
TOZZI, M. J. Caracterização/comportamento de escoamentos em vertedouros com paramento em degraus. 1992. 302 f. Tese (Doutorado) - Universidade de São Paulo, São Paulo, 1992.
Science China. Technological Sciences, v. 58, n. 4, p. 720-726, 2015. http://dx.doi.org/10.1007/s11431-015-5783-6.
ZHANG, G.; CHANSON, H. Interaction between free-surface aeration and total pressure on stepped chute. Experimental Thermal and Fluid Science, v. 74, p. 368-381, 2016. http://dx.doi.org/10.1016/j. expthermflusci.2015.12.011.
ZHANG, J.; CHEN, J.; WANG, Y. Experimental study on time-averaged pressures in stepped spillway. Journal of Hidraulic Research, v. 50, n. 2, p. 236-240, 2012. http://dx.doi.org/10.1080/00221686.2012.666879.
Authors contributions
Fabrício Machado Osmar: Organization of data, statistical analysis of the data studied, bibliographic review, interpretation of results, writing of the text.
Alba Valéria Brandão Canellas: Elaboration of the methodology, interpretation of the results and revision of the article.
Priscila dos Santos Priebe: Elaboration of the methodology, bibliographic review, revision of the article and formatting of the article.
Lorena Silva Saraiva: Bibliographic review, statistical analysis of the data studied and revision of the article.
Eder Daniel Teixeira: Elaboration of the methodology, interpretation of the results and revision of the article.