161
STUDY OF THE EXISTING RELATIONSHIP BETWEEN TEMPERATURE AND DISTRIBUTION OF VEGETATION THROUGH THE USE OF GEOPROCESSING IN THE
CITY OF PIRACICABA, STATE OF SÃO PAULO, BRAZIL
Peterson Ricardo Fiorio1, Pedro Paulo Silva Barros1, Mariana Brochine Lanzotti1
1Escola Superior de Agricultura “Luiz de Queiroz” (Esalq-USP). E-mail: [email protected]; [email protected];
ABSTRACT
Urban sprawl is the primary responsible for the current disposition of cities. And nowadays, all the importance that the conservation of the vegetal cover has is acknowledged, since it interferes with the quality of life, retains pollutant particles and the lack of it causes thermal discomfort. In this way the present work aims at analyzing the relationship between the presence of vegetation and the average temperature of the districts of the city of Piracicaba, in the state of São Paulo. RapidEye sensor image was used for mapping and quantification of vegetation and Landsat 8 for temperature quantification at 4 different times of the year. When it comes to vegetation, the city of Piracicaba has it in 40.44% of its territory. With the spatialization of the temperature, it is possible to observe its variation, presenting a thermal amplitude of 6.4° C in autumn. The areas that present the lowest rates of green areas stand with the highest temperatures, where the vertical constructions prevail, coupled with reduced tree cover.
Keywords: Urban plant cover, geoprocessing, temperature, vegetation, NDVI
ESTUDO DA RELAÇÃO EXISTENTE ENTRE TEMPERATURA E DISTRIBUIÇÃO DE VEGETAÇÃO ATRAVÉS DO USO DE GEOPROCESSAMENTO NA CIDADE DE
PIRACICABA ESTADO DE SÃO PAULO, BRASIL
RESUMO
A expansão urbana é a principal responsável pela disposição atual das cidades. E hoje, sabe-se toda a importância que possui a conservação da cobertura vegetal, pois interfere na qualidade de vida, retém partículas poluidoras e a falta dela causa desconforto térmico. Dessa forma o presente trabalho tem como objetivo analisar a relação existente entre a presença de vegetação e a temperatura média,
162
dos bairros da cidade de Piracicaba, no estado de São Paulo. Foi utilizada imagem do sensor RapidEye para o mapeamento e quantificação da vegetação e do Landsat 8 para quantificação da temperatura em 4 épocas diferentes do ano. A cidade de Piracicaba possui 40,44% de seu território com vegetação. Com a espacialização da temperatura pode-se observar sua variação, apresentando uma amplitude térmica de 6,4°C no outono. As áreas que apresentaram as menores taxas de áreas verdes destacaram-se com as maiores temperaturas, onde prevalece as construções verticais atreladas à reduzida cobertura arbórea.
Palavras-chave: Cobertura vegetal urbana, geoprocessamento, temperatura, vegetação, NDVI
INTRODUCTION
Most of the cities we inhabit these days have taken their current form through their expansion. Due to the lack of planning, chaotic growing of cities has resulted in several problems that one has to face daily, like: replacement of trees by buildings, dwellings in inappropriate places, waterproofing of most places, pollution, city stocking, and traffic (LIMA & AMORIM, 2006).
Environmental issues are becoming more and more important in discussions, since all the benefits and harms that can be caused by the presence or not of urban vegetation are known. Sites with vegetation have a significant difference in temperature; thus sites with more buildings tend to have higher temperatures; trees help in quality of life (for they contact man and nature), retains pollutant particles, and reduce noise pollution.
According to Abreu & Labaki (2010) the lack of vegetation is related to the sensation of thermal discomfort, that is, the temperature increase in urban areas. According to Souza (2004), the heat islands result from the lack of planning of the cities and occur in places with little vegetation and a lot of construction, where the temperature is higher than neighboring areas which are not urbanized. This increase in temperature in urban areas has been damaging the health of the inhabitants.
Some cities have legislation that aims at protecting their green areas, such as Piracicaba, which in Complementary Law no. 207 of September 04, 2007, deals with land subdivision and how green areas should be preserved in the urban environment, explains in which sites new enterprises can be built, and which Federal Laws on Environmental protection are in force (BRASIL, 2007).
In the urban perimeter, there are two classifications used to designate vegetation, they are: urban forests and urban afforestation. According to Miller (2007) urban forest is all vegetation and its
163 associations that are present in cities. Within this definition, we can frame the streets, parks, preservation areas, remnants and others.
The definition of urban afforestation comprises places that have predominant arboreal vegetation or natural vegetation in the cities (GADELHA, 2003). In this sense, trees are included in streets, avenues and parks. Some authors consider this definition as "Urban Forest ".
According to Luchiari (2011), several procedures are used to carry out the surveying of vegetation cover in urban areas: through fieldwork, analysis of charts and topographic plants on a large scale, interpretation of aerial photographs, and even analysis of images obtained at the orbital level.
In Brazil, some cities have field surveys on the conditions and availability of green areas and urban afforestation. Most of the time these data are obtained by sampling and refer only to the researched subject, green areas or afforestation. This type of survey is burdensome both for the time they demand and for the cost involved, bringing the need for the development of viable alternatives (SILVA et al., 2005).
The intense urbanization process in cities contributes to changes in the climate, especially in less wooded areas with a higher density of buildings. Studies carried out in Maceió, state of Alagoas, (BARBIRATO et al., 2007), Fortaleza, state of Ceará, (MOURA et al., 2008), Teodoro Sampaio, state of São Paulo (VIANA & AMORIM, 2008), and in Teresina, state of Piauí (FEITOSA et al., 2011), indicated that both surface and air temperatures underwent changes throughout the urban expansion process.
In order to study this existent vegetation in urban areas, the use of geoprocessing has been highlighted lately. There are studies which use this technique to assess the current situation of the vegetation of some place, making the contact of the researcher with the studied area not necessary. Based on these findings, this work has the following as hypothesis: The spatial dynamics of the temperature corresponds to the presence of vegetation in an urban area. Thus, the present work aims at evaluating the existence of a correlation between the distribution of urban vegetation and the surface temperature.
MATERIAL AND METHODS
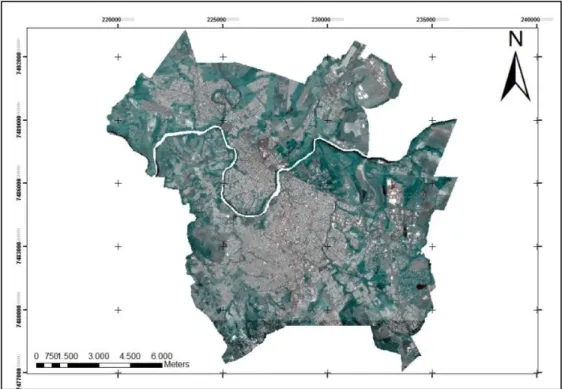
This study was carried out in the city of Piracicaba (Figure 1), in the state of São Paulo, Brazil. According to the Brazilian Institute of Geography and Statistics (IBGE, 2010), the municipality is located 138 km from the capital (city of São Paulo) and is in the southeastern part of Brazil, with 547
164
meters of altitude and coordinates 22º43'31 "S of latitude and 47º38 '57 "W of longitude. With 388.412 inhabitants, the city of Piracicaba totals 1.378.501 km 2, resulting in a population density of 264 inhabitants / km².
Figure 1 – Area of study. Source: RapidEye, 2012.
Regarding the geomorphology, according to the study of Almeida (1964), the region of Piracicaba is located in the Peripheral Paulista Depression, and is limited between the areas of Cuestas Basálticas and Planalto Cristalino Paulista, in which predominate broad, medium hills, elongated hills, and in some small areas there are basaltic plateaus that end in cliffs.
The municipality is located in the Atlantic Forest Biome, with geological, geomorphological and hydrological conditions that result in a Semidecidual Seasonal Forest, that is, it partially loses leaves during the year, but never stays completely without leaves (RODRIGUES, 1999).
The images were obtained from two artificial satellites: RapidEye and Landsat 8. According to Sccon (2013), RapidEye is a constellation of five satellites, which operate together, synchronized, complementing each other's coverage area. That is, they work with the same settings and, through their five multispectral bands (Red, Green, Blue, Near Infrared, and Red Edge), without merging, they collect images with the same spatial resolution (5 meters).
165 The images used were provided online by the Ministry of the Environment - MMA, through the site: http://geocatalogo.ibama.gov.br/, and, after registration, free access to the database of images of the Satellite was obtained. The image gathered was taken on August 6, 2012.
Landsat 8 is the eighth in the program series, and the seventh to succeed in its orbit, being part of the North American satellite program that began in the 1960s, developed and managed, respectively, by NASA and USGS. Landsat 8 was released in February 2013, and in May it started to be controlled by the USGS. Consequently, the collection of images began to exist dating from that same year.
The images present radiometric resolution of 16 Bits, with projection, Datum WGS 1984, spatial resolution of 30 meters and temporal of 16 days. It has 11 bands: Ultra-Blue, Blue, Green, Red, Near Infrared, Medium Infrared / SWIR 1 and 2, Panchromatic, Cirrus, Thermal Infrared / TIRS 01 and 02.
The images were obtained online (Table 1), free of charge, through the USGS website and, after registration, it is possible to access the entire database. The images used in this work are from 2013, and 04 images were collected, one corresponding to each season of the year, with the following dates:
Table 1– Data of the Landsat 8 images used in this work.
Season Image Date
Winter LC82200762013155LGN00_B10 06/04/2013
Summer LC82200762013347LGN00_B10 12/13/2013
Autumn LC82200762013235LGN00_B10 08/23/2013
Spring LC82200762013299LGN00_B10 10/26/2013
For the accomplishment of the present work, the following programs were used: ArcGIS, which is one of the Geographic Information System (GIS) software that was developed by ESRI. The software has tools capable of transforming, manipulating and analyzing spatial data. It allows the elaboration of maps and the decision making with a wide database (ESRI, 2014).
ECognition, which is a program created by Trimble in 2000, that aims at analyzing and extracting information from collected spatial data. As its main activities, the program classifies and defines objects geographically (TRIMBLE GEOSPATIAL IMAGING, 2014).
The Normalized Difference Vegetation Index - NDVI is a specific method that aims at verifying and identifying the distribution of vegetation in a given location. The index is calculated through the
166
use of a formula that consists of calculating the reflectance difference between the near infrared (NIR) - band 4 and visible band (VIS)-band 3 (LIU, 2015).
The Index eliminates the presence of atmospheric constituents, as it results from the combination of two bands. Their results vary from -1 to +1, in which the negatives correspond to the lack of vegetation and, the higher the result, the larger the green surface it represents. With the results, it is possible to discriminate areas that contain vegetation from the ones that do not (LIU, 2015).
The reflectance of the solar radiation corresponding to the canopy of the vegetation involves the reflectance of other factors, as, for instance, the structure of the plant, its age, and properties. The index is used to analyze the vegetation cover, as well as the vegetation progress, leaf area and the amount of biomass (PONZONI et al., 2012).
According to Liu (2015) it is possible to calculate the Normalized Difference Vegetation Index through the equation eq. (1). After one applies it, one obtains a new image, which is classified in: vegetation and not vegetation.
(𝑁𝐼𝑅 − 𝑉𝐼𝑆)
(𝑁𝐼𝑅 + 𝑉𝐼𝑆) eq. (1)
For the first analysis, the following programs were used: ArcGis and eCognition as well as the images of the RapidEye satellite.
The first step was to define the limit, that is, through the original images (bands 3 and 5); only the urban perimeter of the municipality of Piracicaba was cropped, with the aid of the “Extract by Mask” tool.
After this procedure, the cropped images (bands 03 and 05) were classified into vegetation and not vegetation. By using eCognition tools, it was possible to submit the images to the NDVI formula [eq. (1)].
To obtain the temperature, a methodology developed by Coelho & Correa (2013) that aims at transforming the values of gray levels of the image (CN) into radiance and then to Kelvin was adopted. The methodology was designed from the extraction of the metadata from the image of Landsat 8 (band 10) analyzing the infrared thermal properties.
The images underwent a cutout of the original image, that is, with the help of the "Extract By Mask" tool, only the desired area for the study was selected.
167 The next step was to convert the gray levels of the image to radiance, and then to the Kelvin temperature, based on the equations: eq. (2) and eq. (3).
𝐿𝜆 = 𝑀𝐿 ∗ 𝑄𝑐𝑎𝑙 + 𝐴𝐿
eq. (2) Where:: Spectral Radiation of the aperture sensor in Watts / (m2 srμm) ML: Multiplicative factor for resizing the band 10 = 3.34204 AL: Additive specific resizing factor of the band 10 = 0.10000 Ccal: Quantized value calibrated by the pixel in DN = Image band 10
𝑇 𝐿𝑛(𝐾1
𝐿𝜆+1)
eq. (3)
Where:
T: Effective satellite temperature in Kelvin (K) K1: Calibration constant 1 = 774.89 (K) L: Spectral Radiance in Watts / (m2 srμm)
After this procedure, an absolute value of 273.15 (which corresponds to the transformation from Kelvin to Celsius) was subtracted from the formula, (HEWITT, 2002). The value generated corresponds to the air temperature register. The calculation of the average of each neighborhood is done subsequently.
RESULTS AND DISCUSSION
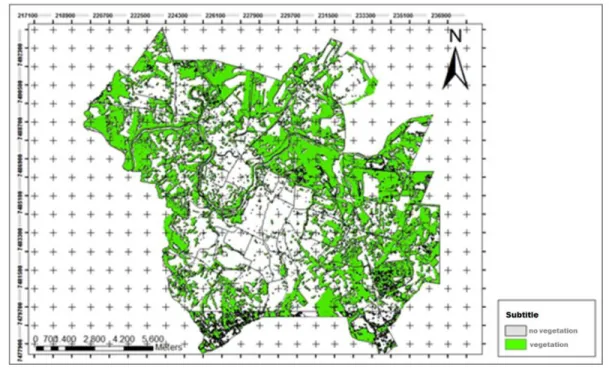
The urban area of the municipality of Piracicaba has a total of 1.376.900.000 m² (IBGE, 2010). Of this total, 59.966.044 m² is covered by vegetation. In other words, 40.44% of the entire urban territory has trees as vegetation cover. Visually (Figure 2), the city has smaller amounts of vegetation in the central and southern regions. What explains this matter is the occupation of the municipality, since the city had its beginning in these neighborhoods, due to the fact that they were closer to the river. The
168
history of the city greatly influences the occupation of the neighborhoods, the ways they are arranged and the amount of vegetation that one finds in them.
Figure 2 – Vegetation distribution in the neighborhoods of the city of Piracicaba
.
In most cases, places with vegetation usually have a lower temperature than those that do not. However, this rule is not always valid, since there are other factors, besides vegetation, that influence the temperature, such as local coverage, presence of rivers, amount of wind that arrives at the site, altitude, and latitude and longitude (FRITZSONS; MANTOVANI; AGUIAR, 2008).
Piracicaba neighborhoods do not behave differently, as one may find in the literature, there are neighborhoods that have a small percentage of vegetation, but still have a lower temperature, while there are others with high percentages of vegetation which have a higher temperature.
When looking at the four seasons of the year (Figure 3), one notices that the seasons behave in similar ways. Winter and spring behave similarly, while autumn and summer are analogous.
169
Figure 3 – Distribution of temperature in the neighborhoods in the city of Piracicaba.
As for the thermal amplitudes found, winter had amplitude of 2.7ºC, being the highest temperature 19.8ºC and the lowest 17.1ºC. Spring behaved in a similar way, with an amplitude of 2.5ºC, the highest temperature was 19.8 ° C and the lowest 17.3 ° C. Autumn had a difference of 6.7ºC between the highest and lowest temperatures, being the highest average temperature 28.2ºC and the lowest 22.1ºC. In summer, the highest temperatures were observed in neighborhoods, the thermal amplitude was 6.4ºC, and the lowest average temperature was 26.0ºC, while the highest was 33.3ºC.
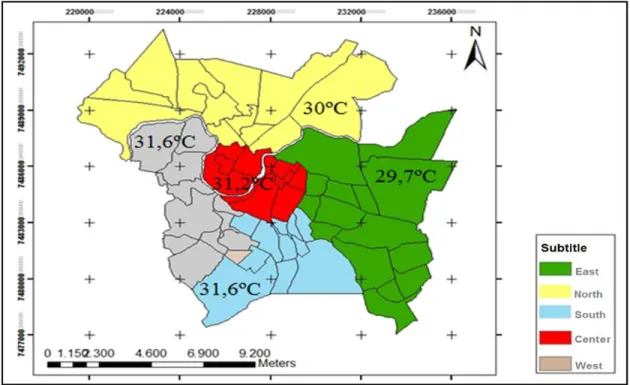
In the 60's the city of Piracicaba had population expansion to different places of the center, which happened thanks to a precarious housing and also a lot of poverty. It is in the suburbs that are the majority of the population of low income, due to the real estate speculation. Usually the neighborhoods located in the central region tend to be warmer than those in the periphery (Figure 4) and this is due to the presence of cars, industries, commerce, people and other factors. In recent years, the northern and
170
south directions have been occupied more frequently, but even so the area with the highest concentration of people and slums in the southeast region (INSTITUTO DE ESTUDOS FORMAÇÃO E ACESSORIA EM POLÍTICAS SOCIAIS, 2003).
Figure 4 –Average temperature in different regions of Piracicaba.
The neighborhoods present in the eastern zone of Piracicaba have a plant mass (located in its end) and by the presence of this vegetation the neighborhood ends up having the second lower average of temperature when compared with the other regions. Most of the existing slums in Piracicaba are located in the South and West region, which means that this region presents the highest average.
The northern region is the one that has the largest number of inhabitants when compared to the others. It has 68.796 inhabitants, which does not interfere much in its temperature, since most of the neighborhoods present in the region have more than 40% of vegetation in their totality.
The central region has the neighborhoods with the lowest percentage of vegetation, being that the majority has values below 30% of vegetation. What explains the average temperature of 31.2 °C is the fact that it was the first region to be explored in the city, thus presenting a high degree of urbanization.
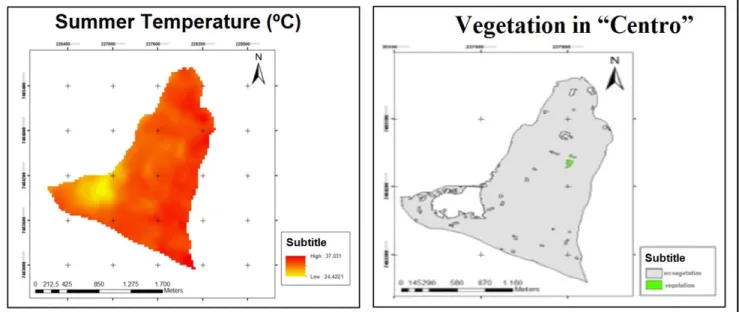
171 The "Centro" neighborhood (Figure 5) was the first to be populated, that is, its occupation is directly related to the amount of trees present in the region. As depreciation began in 1766, it has been more than 230 years since people have started exploring the site. The amount of existing vegetation is 227.397.31 m² and this corresponds to 3.9% of the entire area of the neighborhood. Currently, the neighborhood "Centro" is where the business area of the city takes place. Besides that, a large number of inhabitants and automobiles can also add up to the average temperature of the place. This neighborhood can be considered as a place that has people of medium and high social standards.
Figure 5 – Vegetation and Temperature in “Centro” neighborhood.
The neighborhood "Cidade Jardim" was, also, one of the first that arose in the city. The lands of Mario Dedini were parceled out to be built in a standardized way, with gardens. However, even with this requirement, allotment devastated much of the existing vegetation, leaving only 6.7% of the original amount with vegetation. In the same way, "Nova Piracicaba" was subdivided, but presents a greater percentage of 13.9%.
The analysis of the neighborhood "Nhô Quim" did not present the best percentage. The site has 14.4% of vegetation cover, and presents a Permanent Preservation Area (PPA), in other words, there is a high probability that the vegetation present (123.039.62 m²) belongs to the area destined to the PPA.
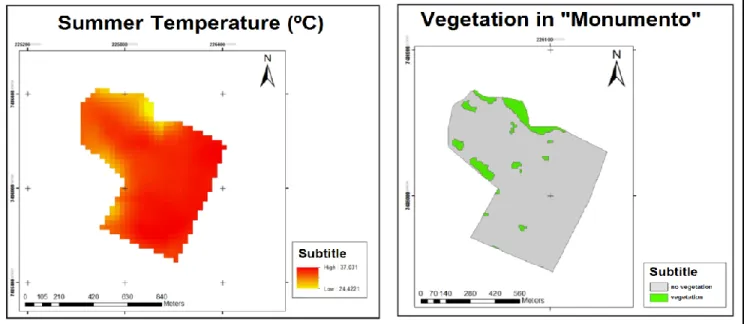
As for the average temperatures found in summer, the "Jardim Monumento" neighborhood (Figure 6) is the one with the highest average (33.3 ºC). Besides being part of the central region (which
172
strengthens the temperature increase) the neighborhood has only 7.6% of vegetation in its extension. This value corresponds to 42 .401.23 m².
Figure 6 – Vegetation and Temperature in “Jardim Monumento” neighborhood.
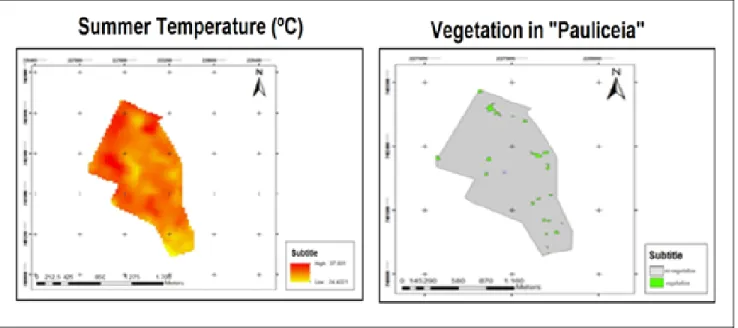
With the second highest average temperature in summer, there is "Pauliceia" (Figure 7). It has 1.61% of vegetation (27.965.9m²). Its average temperature reached 33ºC. In addition to the small amount of vegetation present, the neighborhood is the most populous in the southern region (12.097 inhabitants), that is, there is a large number of people in a relatively small area, which results in greater degradation. Besides, the neighborhood has a housing complex, which reflects in a significant amount of people with low income living in the place. The nature of construction applied to these types of housing interferes with the temperature, making the place warmer.
173
Figure 7– Vegetation and Temperature in “Pauliceia” neighborhood
The average summer temperature of 1.71% is that of the "Paulista" neighborhood (Figure 8). Located in the South region, the neighborhood has 17.906.6m² and has an average temperature of 33ºC. In relation to its population, the neighborhood houses 9.739 inhabitants. The neighborhood has nothing that can interfere with its temperature, the lack of vegetation, in this case reflects in the air temperature.
Figure 8 – Vegetation and Temperature in “Paulista” neighborhood.
174
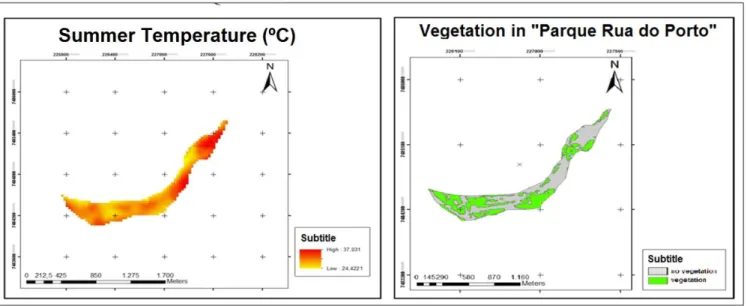
Even though the neighborhood "Parque Rua do Porto" (Figure 9) was designed so that the city had a leisure point, it presents a relatively low percentage for a place destined to this sort of activity, this neighborhood has 42.54% of vegetation. Also, this percentage is small because the neighborhood is bordered by river at one end and should have more PPA. This entire configuration reflects in the average temperature in the summer of 28.2º C.
Figure 9 – Vegetation and Temperature in “Parque Rua do Porto” neighborhood.
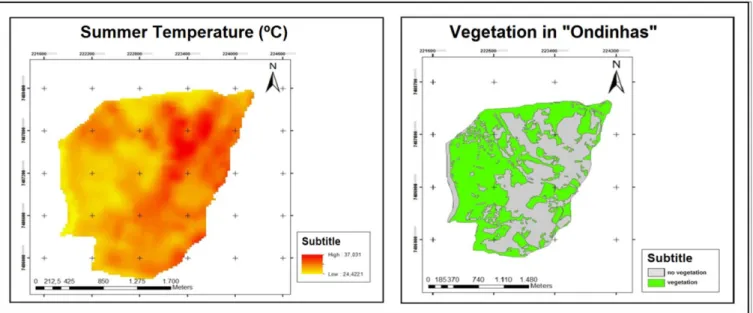
The neighborhood "Ondinhas" (Figure 10) presents the third lowest average temperature, 26.9º C. In addition to having 53.24% of total vegetation (2.433.157.95 m²), the neighborhood is bordered by the rural area, which may influence the thermal average. With 228 inhabitants, the place has irregular housing. The small number of people in this neighborhood does not influence the temperature so much, since more than half of the area has vegetation.
175
Figure 10 – Vegetation and Temperature in “Ondinhas” neighborhood.
"Monte Alegre" is another neighborhood bordering the rural area (Figure 11). It is a neighborhood of the eastern region, has few inhabitants (465 people), a temperature of 27.1º C and 65.61% of vegetation (1.715.495.3 m² of vegetation in its territory).
Figure 11 – Vegetation and Temperature in “Monte Alegre” neighborhood.
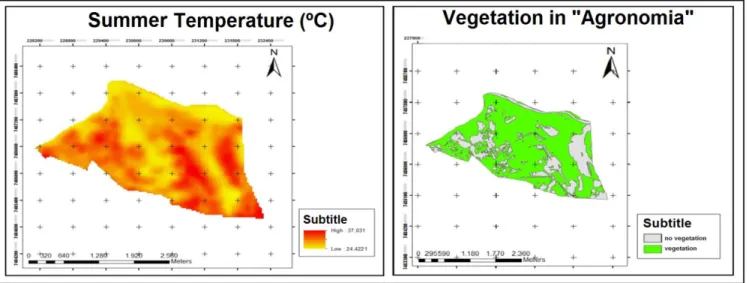
The neighborhood "Agronomia" (Figure 12) is the one that has the lowest average temperature in the summer, 27.1º C, the neighborhood is located in the eastern region of Piracicaba. The farm of
176
Luiz Vicente de Souza Queiroz was donated to build an agricultural college on the site, and many of the characteristics of the farm were maintained. Currently, the site has 71.48% of vegetation and houses 174 people.
Figure 12 – Vegetation and Temperature in “Agronomia” neighborhood.
Regarding vegetation, the "Cidade Alta" neighborhood (Figure 13) has 1.79% of trees in its extension and presents a relatively average temperature. Being part of the central region, the neighborhood has 13.692 people inhabiting it. Consequently, factors normally brought by a central region are added up, which are; excess of people, automobiles, commerce, and others.
177
Figure 13 – Vegetation and Temperature in “Cidade Alta” neighborhood.
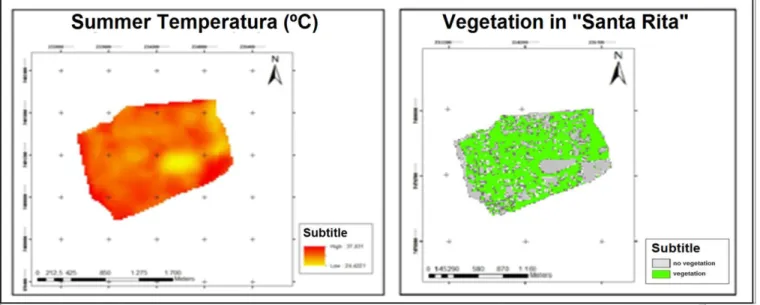
The "Santa Rita" neighborhood (Figure 14), which is considered to be a high-class neighborhood, borders the rural area of the city of Piracicaba. It has 65.80% of vegetation, which corresponds to 1.527.287 m². That amount of vegetation influences the local temperature, which finishes having an average, in the summer, of 28.1º C. In addition to the vegetation, the neighborhood is home to 677 residents, which helps even more for local conservation.
Figure 14 – Vegetation and Temperature in “Santa Rita” neighborhood.
Regarding the social level of the neighborhoods, the "Jardim Primavera" (Figure 15), which presented the average summer temperature of 32.3º C, has 16.6% of total vegetation. The site has a housing complex, which can interfere with the increase in temperature. It is also the neighborhood of the north that presents the least amount of people (1.205).
178
Figure 15 – Vegetation and Temperature in “Jardim Primavera” neighborhood.
"Santa Terezinha", which borders the rural area of northern Piracicaba, is among slum-dwelling neighborhoods. Its average temperature is 30ºC and it presents 36.85% of vegetation. The low value of vegetation may be due to the fact that the place shelters 11.947 people and to the depreciation. "Vila Cristina" and "Monte Líbano", as well as "Santa Terezinha" present slums, which also interfere in the social class of the place and in the educational level. The average temperatures of the above districts are 31.8° C and 31.3° C, respectively.
The district "Monte Líbano" has the largest number of people in the western region, 4.734, in addition to housing a slum in its area; the neighborhood presents only 14.42% of present vegetation.
There are neighborhoods of high social standards, such as "Nova Piracicaba" and "Clube de Campo", which have less than 30% of vegetation in their territory, and have approximately 30ºC average temperature in the summer.
CONCLUSIONS
The tools and methodology used are efficient and represent the reality of the place. Geoprocessing has been playing an important role in the development of these studies, in Piracicaba, State of São Paulo, Brazil.
The city of Piracicaba has 40.44% of its territory with vegetation. Being "Agronomia" the one with bigger vegetation cover, it presented 71.48% of its total area covered by vegetation. The second one in this rank is "Santa Rita", which has 65.80% with vegetation. As for the lower percentages, they
179 occur in the districts: "Cidade Alta", "Paulista" and "Pauliceia", with 1.79%, 1.71% and 1.61% respectively.
"Jardim Monumento", "Pauliceia" and "Paulista" districts have the highest average temperatures in the summer, while the districts "Ondinhas", "Monte Alegre" and "Agronomia" have the lowest average temperatures recorded.
The winter and spring seasons have similar conduct and distinguish themselves from the summer and fall seasons, which have the same pattern of conduct. When it comes to the examinations done, summer was used, since it has greater amplitude between temperatures, and it is at this season of the year that the solar radiation is intense.
In relation to vegetation, it is possible to conclude that neighborhoods with vegetation tend to decrease the average temperature, but this is not a rule, since there are other factors: amplitude, altitude, longitude, relief, presence of rivers, and social class, that interfere with the final temperature result.
REFERENCES
ABREU, L.V.; LABAKI, L.C. 2010. Conforto térmico propiciado por algumas espécies arbóreas: avaliação do raio de influência através de diferentes índices de conforto. Ambiente Construído, Porto Alegre, v. 10, n. 4, p. 103-117.
ALMEIDA, F.F.M. 1964. Fundamentos geológicos do relevo paulista. Boletim do Instituto
Geográfico e Geológico, São Paulo, n.41, p.169-262.
BARBIRATO, G.M; SOUZA, L.C.L.; TORRES, S.C. 2007 Clima e cidade: a abordagem climática como subsídio para estudos urbanos. Maceió: EDUFAL, 164 p.
BRASIL (Município). Lei Complementar nº 207, de 04 de setembro de 2007. Disciplina o parcelamento do solo no Município de Piracicaba e dá outras providências. Lei Complementar N.
º 207. Piracicaba, 2007.
COELHO, A.L.; CORREA, W.S.C. 2013. Temperatura de superfície celsius do sensor TIRS/LANDSAT-8: metodologia e aplicações. Revista Geográfica Acadêmica, Roraima, v. 7, n. 1, p. 31-45.
ESRI. 2014. ArcGIS Platform. Available from: <https://www.arcgis.com/features/>.
FEITOSA, S.M.R.; GOMES, J.M.A.; MOITA, N.J.; ANDRADE, C. D. 2011. Consequências da urbanização na vegetação e na temperatura da superfície de Teresina-Piauí. REVSBAU, Piracicaba, v. 6, n. 2, p. 58-75.
FRITZSONS, E.; MANTOVANI, L.E.; AGUIAR, A.V. 2008. Relação entre altitude e temperatura: uma contribuição ao zoneamento climático no estado do paraná. Revista de Estudos Ambientais, Blumenau, v. 10, n. 1, p.49-64.
GADELHA, C.H.M.S.; SOUSA, E.B.M.; MEDEIROS, F.P.M.; MENEZES, I.R.; ALBUQUERQUE, H.N.; SANTOS, L. 2003. Análise da arborização dos bairros do Mirante e Vila Cabral na cidade de Campina Grande-PB. Revista de Biologia e Ciências da Terra, João Pessoa, v. 3, n. 2, p.120-126.
180
INSTITUTO BRASILEIRO DE GEOGRAFIA E ESTATÍSTICA. 2010. Infográficos: Dados gerais
do município. Available from: <http://cidades.ibge.gov.br/painel/painel.php?codmun=353870>
Access Sept. 2014.
INSTITUTO DE ESTUDOS FORMAÇÃO E ACESSORIA EM POLÍTICAS SOCIAIS (Org.). 2003.
Revisão do Plano Diretor de Desenvolvimento de Piracicaba. Instituto de Pesquisas e
Planejamento de Piracicaba: Piracicaba. 45p.
LIMA, V.; AMORIM, M. C. C. T. 2006. A importância das áreas verdes para a qualidade ambiental das cidades. Revista Formação, Presidente Prudente, n.13, p. 139 -165.
LIU, W.T.H. 2015. Índice de Vegetação da Diferença Normalizada. In: LIU, W.T. H. Aplicações de
Sensoriamento Remoto. Oficina de texto: Campo GrandeCap. 7. p. 220-224.
LUCHIARI, A. 2011. Identificação da cobertura vegetal em áreas urbanas por meio de produtos de sensoriamento remoto e de um sistema de informação geográfica. Revista do departamento de
geografia, São Paulo, v. 14, p. 47-58.
MILLER, R.W. 2007. Urban Forestry: Planning and Managing Urban Greenspaces. Waveland Press: Long Grove, 2th ed. 512 p.
MOURA, M.O; ZANELLA, M.E; SALES, M.C.L. 2008. Ilhas térmicas na cidade de Fortaleza - CE.
Boletim Goiano de Geografia. Goiânia, v.28, n.2, p. 33-34.
PONZONI, F.J.; SHIMABUKURO, Y.E.; KUPLICH, T.M. 2012. Sensoriamento remoto no estudo
da vegetação. Parêntese: São José dos Campos, 176 p.
RODRIGUES, R.R. 1999. A vegetação de Piracicaba e municípios do entorno. Circular Técnica Ipef, Piracicaba, v. 189, n.1, p.1-20.
SCCON. Imagens RapidEye. 2013. Available from: <http://www.sccon.com.br/rapideye.html> Access Sept. 2014.
SILVA FILHO, D. F.; PIVETTA, K.F.L.; COUTO, H.T.Z.; POLIZEL, J.L. 2005. Indicadores de floresta urbana a partir de imagens aéreas multiespectrais de alta resolução. Scientia Forestalis, Piracicaba, n. 67, p. 88-100.
SOUZA, L. C. L. 2004. Ilhas de calor. Jornal Unesp. São Paulo, v.18, n.186, p.11.
TRIMBLE GEOSPATIAL IMAGING. 2014 eCognition. Available from:
<http://www.ECognition.com/> Access Sept. 2014.
VIANA, S.S.M; AMORIM, M.C.C.T. 2008. Caracterização do clima urbano em Teodoro Sampaio - SP: uma introdução. Sociedade e Natureza. Uberlândia, v.20, n.2, p. 19-42.
XAVIER, A. L.; NOGUEIRA, M, C, J de.; MAITELLI, G, T.; OLIVEIRA A, G.; OLIVEIRA, A, S, de.; SANTOS, F, M, M.; NOGUEIRA, J, S. 2009. Variação de temperatura e umidade entre áreas urbanas de Cuiabá. Engenharia Ambiental. Espírito Santo do Pinhal. v.6, n.1, p.82-93.
Received in: December 02, 2016 Accepted in: October 03, 2017