Article
*e-mail: [email protected]
Honey Classification from Semi-Arid, Atlantic and Transitional Forest Zones in Bahia, Brazil
José Soares dos Santos,* Núbia Soares dos Santos, Maria Lúcia Pires dos Santos, Sabrina Novaes dos Santos and Julian Júnio de Jesus Lacerda
Departamento de Ciências Naturais, Universidade Estadual do Sudoeste da Bahia, Estrada do Bem Querer km 4, CP 95, 45083-900 Vitória da Conquista-BA, Brazil
Neste trabalho, amostras de mel produzidas em três diferentes regiões climáticas do Sudoeste da Bahia, Brasil (semi-árido, Mata Atlântica e Zona de Transição Climática) foram caracterizadas com base nos teores de minerais, elementos traços, cinzas e condutividade elétrica. Os metais foram determinados por espectrometria de absorção atômica. Com a finalidade de avaliar as variáveis químicas capazes de promover uma caracterização do mel produzido em cada região, as técnicas de cluster e componentes principais (ACP) foram aplicadas nos resultados das análises. Com base nas análises de cluster e ACP, foi possível distinguir os diferentes grupos de amostras correspondentes às três origens geográficas dos méis. A elevada correlação observada entre a condutividade elétrica e Cu nas amostras das zonas de transição climática, sugere que essas variáveis estão associadas, e esse fato pode ser atribuído ao uso de cobre na cafeicultura que é a principal atividade agrícola desenvolvida nessa região.
In this study, samples of honey produced in three different regional climates in the southwest Bahia, Brazil (semi-arid, Atlantic and Transitional Forest Zones) were characterized on the basis of their mineral and trace elements, ash content and electrical conductivity. The metals were determined by atomic absorption spectrophotometry. The cluster and principal component analysis (PCA) methods were applied to the chemical concentration data in order to study the chemistry variables capable of promoting a characterization of the honey produced in each area. Cluster analysis and PCA distinguishes the different groups of honey samples corresponding to each region of the three geographical origins. The high correlation between electrical conductivity and Cu observed in honey samples from transitional forest zones suggested a coupling to the nutrient cycle, and can be attributed to use of copper compounds in coffee production, a major activity developed in all transitional forest zones.
Keywords: honey, cluster analysis, principal component analysis, PCA, heavy metals, geographical classification,semi-arid zone
Introduction
Honey is a natural product produced by Apis mellifera
bees from the nectar or secretions of plants, and usually contains no additives or preservatives. The chemical composition of any batch of honey will depend largely on the mix of flowers consumed by the bees that produced the honey.1
Honey contains small amounts of a wide array of vitamins, minerals, amino acids and antioxidants. The vitamins found in honey may include (depending on floral variety) niacin, riboflavin and pantothenic acid;
minerals present include calcium, copper, iron, magnesium, manganese, phosphorus, potassium and zinc.2-6 Just as
the color and flavor of honey varies by floral source, so do the vitamin, mineral, antioxidant and amino acid contents.7 Thus, honey is used in traditional folk medicine
and apitherapy and is an excellent natural preservative.8
However, honey is often marketed as mixed-flower honey with a blend of flavours. In order to determine the legitimacy of the particular floral source of honey, analysis of pollen (melissopalynology) and either organoleptic or physico-chemical properties are traditionally employed.9-12
interest in the certification of the geographical origin of food products because authenticity and quality issues can often be associated with a given geographical origin.13,14 Developmenting methods for the geographical
classification of food are becoming very important. Moreover, reliable techniques for origin authentication are essential because official analysis of honey involves a series of several determinations of chemical and physical parameters that will be of little use for the geographical certification.15,16 Therefore, in recent years, several efforts
have been made to authenticate the origin of honey by means of chemometric analysis, with different chemical and physical parameters, and multivariate analysis has proven to be a powerful tool for determining the geographical origin for honey.17-20
In Brazil, especially in the Bahia State, many types of farmhouse honey are produced. Bahia honey varieties span a wide range of originating flora and microclimatic and atmospheric conditions. This substantially increases their market value and raises the need to detect potential frauds in origin or even adulteration.
Honey varieties from the semi-arid zone of Southwest Bahia, by virtue of the special climate and vegetation of the area, exhibit chemical and physico-chemical characteristics that facilitate their discrimination from honey produced in other regions, as the prevailing local vegetation differ to a great extent.
The aim of this research was to investigate minerals and trace elements that might enable the differentiation of honeys produced in three different regional climates in southwest Bahia State, Brazil (semi-arid, Atlantic and transitional forest zones) by applying principal component analysis (PCA).
Experimental
Honey samples
The data set included 52 samples of monofloral and multifloral honey, produced in three different regional climates in the southwest of Bahia State, Brazil, was obtained from the Casa do Mel of the Agronomy School of the Universidade Estadual do Sudoeste da Bahia. Collection sites included different botanical origins, soil characteristics and climates.
The area studied is located in the Southwest of the state of Bahia–Brazil, close to the city of Vitória da Conquista. The region constitutes three different climates: semi-arid, Atlantic and transitional forest. Population density is low, and the main human activities are agriculture (coffee in transitional forest zone and cocoa in Atlantic forest zone)
and animal raising (cattle, sheep and goat in semi-arid zone).
The honey samples were stored in polyethylene jars. Each jar contained about 250 g of honey. The honey samples were kept in the dark at room temperature until analysis.
Reagents
All solutions were prepared using high purity deionized water obtained with a Millipure water purification system (Millipore, São Paulo, SP, Brazil). For extraction procedures, nitric acid (HNO3, 65%, p.p., Merck, Rio de Janeiro, RJ, Brazil) and hydrochloric acid (HCl 37% p.a., Merck, Rio de Janeiro, RJ, Brazil) were used.
Analytical reference solutions in 1.0% (v/v) HNO3 prepared by successive dilution of 1000 mg L-1 Titrisol
standard solutions (Merck, Darmstadt, Germany), were used for the calibration of atomic absorption spectrometer (AAS). All solutions were stored in decontaminated polypropylene bottles (Company, Rochester, NY, USA).
Apparatus
For measurements, an air–acetylene flame atomic absorption spectrometer (FAAS) Perkin Elmer AAnalyst 200 (USA) equipped with a deuterium background corrector and a flame photometer were used.
Sample preparation
All glassware and polyethylene flasks were cleaned with detergent solutions, soaking in 10% (v/v) nitric acid for 24 hours, rinsed with Millipure water and dried in polypropylene containers. Two different types of digestion procedures were applied to the digestion of honey samples: dry and ultrasonic extraction. Extractions have been replicated three times for each sample. The procedures are given below.
Dry decomposition procedure
Ultrasonic extraction procedure
Honey (1.25 g) was sonicated for 20 min with 1.25 mL of 65% (p.p) HNO3 (Merck, Rio de Janeiro, RJ, Brazil) in an ultrasonic bath (frequency 40 kHz, 320 W, USC-1800, Unique, São Paulo, Brazil). The extract was diluted with Millipure water in a 25 mL calibrated flask.
Analytical methods
Ash content analyses were performed following international recommendations (AOAC, 1990).21 EC
(mS cm-1) was determined in a 20% (w/v) solution of
honey (dry matter basis) in Millipure water using a conductimeter (CAAL Model MCA150, São Paulo, Brazil). Ca, Mg, Cu, Fe, Mn and Zn were determined directly in the extract solution by FAAS. The instrument response was periodically checked with known standards. An air acetylene flame and hollow cathode lamp were used for all samples. Calibration curves were prepared using dilutions of stock solutions. Na and K were determined by a flame photometer. All analyses were done in triplicate and the mean values were used for the statistical evaluation.
Statistical data evaluation
Due to the existence of different factors (botanical origins, soil characteristics, climates and pollution) that could affect the content of the mineral or trace element in honey, the cluster and principal component (PC) methods were applied to the chemical concentration data in order to study the chemistry variables capable of characterizing the honey produced in each area.
A data matrix (52 × 10) whose rows are the different honey samples analyzed (cases) and whose columns correspond to the content of the mineral or trace element determined (variables) was built. The data were processed by HCA (hierarchical cluster analysis) and PCA. In HCA, the squared Euclidian distance and coefficient of similarity were used to group the cases in clusters in term of their nearness or similarity. Ward’s clustering method was used.
PCA is a powerful technique for pattern recognition that attempts to explain the variance of a large set of inter-correlated variables. It indicates association between variables, thus, reducing the dimensionality of the data set. PCA extracts the eigenvalues and eigenvectors from the covariance matrix of the original variables. The PCs are the uncorrelated (orthogonal) variables that are obtained by multiplying the original correlated variables with the eigenvector (loadings). The eigenvalues of the PCs are the measurements of their associated variance, the participation of the original variables
in the PCs is given by the loadings, and the individual transformed observations are called scores.
PCA was used to achieve a reduction of dimension while retaining the maximum amount of variability present in the data and observeing a primary evaluation of the between-class similarity. All mathematical and statistical computations were made using Excel 2003 and SPSS 12.0 (SPSS, USA, 2001).
Results and Discussion
Optimization of the extraction procedure
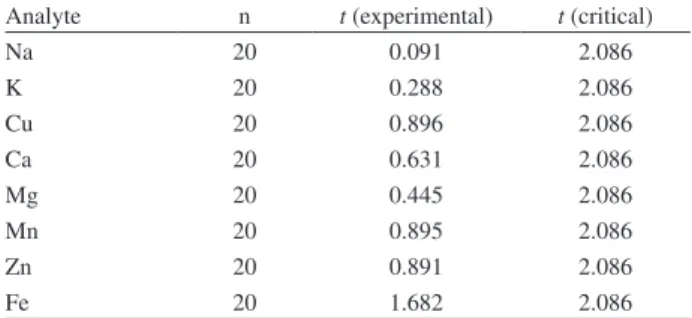
Extraction is still one of the most critical steps during honey analysis. Basically, the extraction should be performed in such a way that the analyte is separated from the interfering matrix without loss, contamination, or change of speciation and with minimum interference. The most commonly used procedures to extract metal from honey samples are acid extraction after ashing. This is a labour-intensive, time-consuming process, so an alternative procedure was sought. To this end, preliminary tests were conducted to determine the metal contents in 21 samples of various origins, using solutions obtained from either the dry decomposition of honey or samples prepared by ultrasonic extraction. In order to test whether there was a significant difference between results obtained by each extraction procedure, paired two-tailed t-tests were performed. In Table 1 results
on the experimentally calculated t-values are listed for Na,
K, Ca, Mg, Cu, Zn, Mn and Fe, where t (critical)denotes the
critical value taken from statistical tables of the student t-test
distribution for 20 degrees of freedom at a confidence level of 95%. The results obtained with both were highly correlated, so we chose ultrasonic extraction in subsequent tests.
Total metal concentrations in honey
The mineral and trace element content in honey samples could give an indication of environmental pollution and
Table 1. Test of significance (t-test) of the difference between results obtained for each analyte by two different extraction procedures
Analyte n t (experimental) t (critical)
Na 20 0.091 2.086
K 20 0.288 2.086
Cu 20 0.896 2.086
Ca 20 0.631 2.086
Mg 20 0.445 2.086
Mn 20 0.895 2.086
Zn 20 0.891 2.086
therefore also an indication of the geographical origin of the honey. Table 2 shows the mean values, medians, standard deviations (SD) and ranges of the general descriptive variables for the honey samples. In general, K, Na, Ca and Mg showed the highest levels with range concentrations of 113.75-1993.00 µg g−1; 21.87-840.40 µg g−1; 1.25-150.20
µg g−1 and 6.12-33.44 µg g−1, respectively. For those metals,
the levels of concentrations found are in accordance with values reported in the literature. Some researchers reported K as the most abundant element in honey.6,11 The values
for the potassium contents of our samples were generally are at the same level of the literature values.6,11,20 Sodium,
calcium, iron, manganese and zinc values found in the present study are in agreement with the respective levels of honey samples from São Paulo (Brazil).20 The range of
copper for semi-arid region is similar to the range of copper for honey samples from Israel.11 High copper content
was found 33.66 µg g−1 in a honey sample from Jequié
city (transitional forest zone). It might be explained by possible contamination for beekeeping equipment during the processing of honey.
In honey from different botanical and geographical origins, the metal concentration values obtained are strongly dependent on the origin of the honey; Na, K, Cu, and Ca were most sensitive to these origins.
Cluster analysis
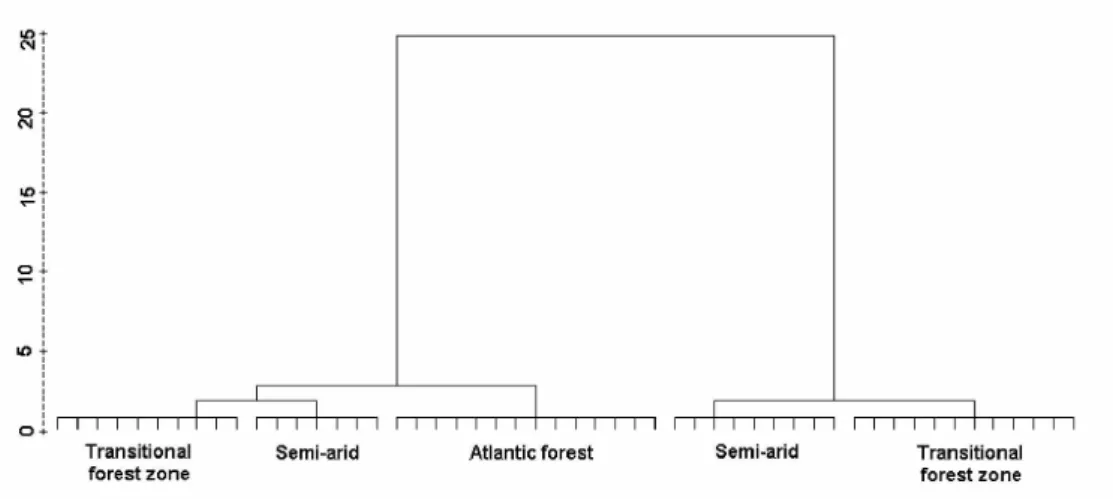
Cluster analysis is comprised of a series of multivariate methods that are used to find true groups of data or stations. In clustering, the objects are grouped such that similar objects fall into the same class. The hierarchical method of cluster analysis (Ward’s clustering procedure), which
is used in this study, has the advantage of not demanding any prior knowledge of the number of clusters, which the non-hierarchical method does. Figure 1 shows the dendrogram that corresponds to clusters of the observations corresponding to each geographical origin of the honey samples. It was possible to distinguish five different groups. From the left, the first and fifth groups are composed of honey produced in transitional forest zones; the second and fourth groups are composed of honey from semi-arid zones; the third group is composed of honey produced in the Atlantic forest.
Correlations between mineral, trace elements, EC and ash in each zone
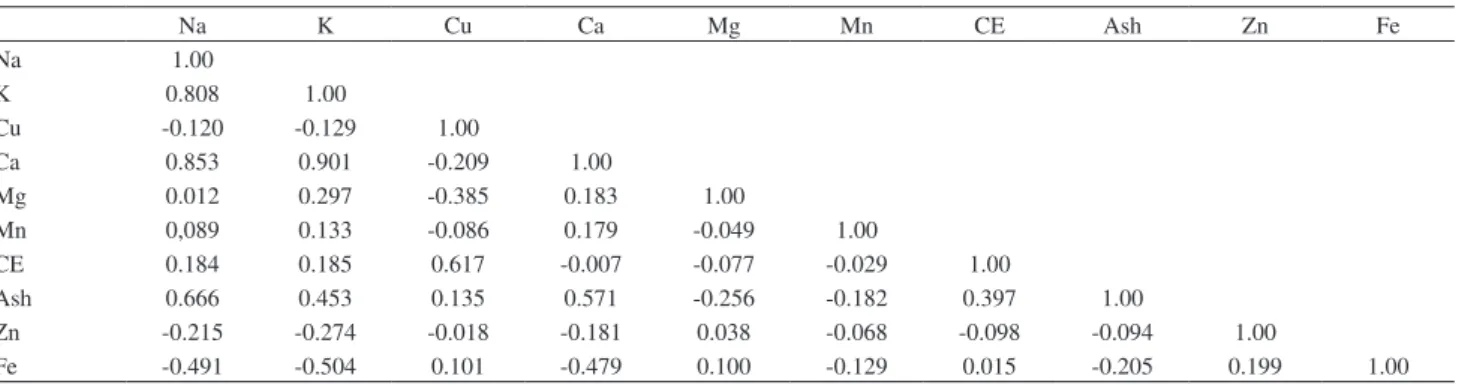
Tables 2, 3 and 4 report the correlation matrix between mineral and trace elements, ash content and EC for the 12 variables studied. All variables show a significant correlation with at least one other variable. Table 2 shows the correlation matrix of variables that correspond to honey samples from transitional forest zones; no strong correlations between the four metals (Fe, Mn, Mg and Zn) are noticeable. High correlations are observed for the EC-Cu (r = 0.617) and ash-Na pairs (r = 0.666). This fact leads to the following preliminary considerations: the correlation between EC and Cu suggested a coupling to the nutrient cycles. This is probably due to use of copper compounds in coffee production, a major activity developed in all transitional forest zones. The ash content and electrical conductivity in honey depend on the nectar composition of the predominant plants in the area for their formation. The EC is closely related to the concentration of mineral salts, organic acids and proteins and proved
useful for discriminating honey of different botanical and geographical origins. That is why some authors, have suggested the EC measurements as an indirect technique to determine the mineral content in some foods.14,22 However,
the correlations observed for the pairs: CE-Cu (r = 0.617)/ CE-Na (r = 0.184) and ash-Na (r = 0.666)/ash-Cu (r = 0.135) imply that the EC values depend not only on concentration but also are dependent on the mobility of ions present in the honey samples.
The correlation coefficients for the different concentrations of the Atlantic forest zone samples are presented in the Table 4. There was a significant increase in the correlation coefficients compared with those for the semi-arid zone samples (Table 3) for Na, K and Ca with CE: CE and Na (r = 0.670 for semi-arid and 0.893 for Atlantic forest zones); CE and K (0.748 for semi-arid and 0.986 for Atlantic forest zones); CE and Ca (0.688 for semi-arid and 0.784 for Atlantic forest zones). However, in transitional forest zones, no significant correlations between the elements Na, K and Ca and EC were noticeable.
Principal component analysis
PCA was applied to the autoscaled data matrix in order to provide a data structure study in a reduced dimension while retaining the maximum amount of variability present in data. Prior to performing PCA, the suitability of data for factor analysis was assessed. Tables 2, 3 and 4 reports the correlation matrix between mineral and trace elements, ash content and EC for 10 variables studied. All variables show a significant correlation with at least one other variable.
Three components were extracted that describe approximately 72% of the common variance. PCA results are summarized in Figure 2, which shows the loading plots that characterize the main concentrations patterns in
every analyzed data set and their explained variance. High positive and negative loadings indicate that these variables have an important presence in the considered PC.
PC1 defines the contrast between two inversely correlated parameters profiles. Positive loadings show a contribution defined mostly by elements that explain the separation in honey samples according to floral and geographical origins (Ca, Na and K), while negative loadings describe a more specific contribution of Fe and Zn contents; this suggest that these two elements are not associated with floral or geographical origins of honey. Together, these two tendencies describe 33.97% of the total data variance. PC2 which accounts for 20.27% of the data variance also describes the contrast between two variable patterns. Positive loadings show a contribution defined mostly by EC, Cu and ash whereas negative loadings define a contribution characterized mostly by Mg and Mn. Cu can have an agricultural origin. They are present in high concentrations in honey samples from transitional forest zones, due the existence of a significant extension of traditional coffee production areas. The negative loading of Mg and Mn suggests an antagonistic effect in respect to Cu. PC3 (17.02% of the data variance) is characterized by inverse correlations between Mg and Mn.
The scores plot (PC1 and PC2) for the honey samples (Figure 3) showed mixed sample distribution in two different clusters. The first PC is correlated with a group of variables that jointly make it possible to distinguish the honey samples according to botanical and geographical origins. It is possible to distinguish two different groups: honey samples from semi-arid areas are on the negative side of the first PC, and samples from Atlantic forest on the positive side. However, the transitional forest samples appear distributed in both groups. This can be attributed to environmental factors, because the transitional forest zones are located between the semi-arid and Atlantic forest zones, presenting some common characteristics of each region.
Figure 2. Loadings of variables (Ca, K, Na, Fe, Cu, Mg, Mn, Zn, ash content and electrical conductivity) in the first three principal components for honey
Table 5. Correlation matrix between the variables of honey samples from Atlantic forest zones
Na K Ca Mg Mn CE Ash Zn Fe
Na 1.00
K 0.925 1.00
Ca 0.847 0.786 1.00
Mg -0.323 -0.376 -0.476 1.00
Mn -0.271 -0.151 -0.247 -0.147 1.00
CE 0.893 0.986 0.784 -0.450 -0.065 1.00
Ash 0.015 0.091 0.032 0.083 -0.230 0.127 1.00
Zn 0.079 -0.067 -0.037 -0.116 -0.071 -0.071 -0.173 1.00
Fe -0.067 -0.168 -0.112 -0.186 -0.106 -0.214 -0.797 0.490 1.00
Table 2. Values for metals (µg g-1), electric conductivity (µS cm-1) and ash (%) studied in honey according to their geographical origin
Statistics K Na Cu Ca Mg Mn Zn Fe EC Ash
Atlantic forest
Mean 524.84 205.70 nd 49.94 13.86 0.98 0.25 3.98 450.61 0.20
Minimum 222.60 138.80 nd 26.43 6.12 nd nd 1.50 250.00 0.04
Maximum 1436.20 508.96 nd 111.10 23.78 3.00 3.52 6.24 1070.00 0.76
SD 293.25 93.24 nd 25.28 5.43 0.80 0.94 1.33 209.78 0.20
Semi-arid
Mean 555.94 113.08 0.48 32.63 15.99 0.90 0.49 21.99 520.45 0.34
Minimum 113.75 21.87 nd 5.71 7.28 nd nd 1.78 250.10 nd
Maximum 1993.00 277.50 3.31 150.20 29.76 3.36 6.73 89.08 1055.00 1.03
SD 464.41 78.99 0.84 36.27 6.24 0.84 1.67 25.37 207.46 0.30
Transitional forest
Mean 489.43 200.56 2.10 32.48 16.88 3.27 0.79 8.76 453.78 0.28
Minimum 128.75 50.62 nd 1.25 6.33 nd nd nd 261.40 0.04
Maximum 1208.10 840.40 33.66 109.60 33.44 52.98 14.26 38.28 1212.00 1.00
SD 361.20 170.62 7.10 30.86 5.38 11.15 3.05 7.48 213.41 0.25
nd, Not determined by FAAS.
Table 3. Correlation matrix between the variables of honey samples from transitional forest zones
Na K Cu Ca Mg Mn CE Ash Zn Fe
Na 1.00
K 0.808 1.00
Cu -0.120 -0.129 1.00
Ca 0.853 0.901 -0.209 1.00
Mg 0.012 0.297 -0.385 0.183 1.00
Mn 0,089 0.133 -0.086 0.179 -0.049 1.00
CE 0.184 0.185 0.617 -0.007 -0.077 -0.029 1.00
Ash 0.666 0.453 0.135 0.571 -0.256 -0.182 0.397 1.00
Zn -0.215 -0.274 -0.018 -0.181 0.038 -0.068 -0.098 -0.094 1.00
Fe -0.491 -0.504 0.101 -0.479 0.100 -0.129 0.015 -0.205 0.199 1.00
Table 4. Correlation matrix between the variables of honey samples from semi-arid zones
Na K Cu Ca Mg Mn CE Ash Zn Fe
Na 1.00
K 0.894 1.00
Cu -0.402 -0.309 1.00
Ca 0.806 0.946 -0.236 1.00
Mg -0.123 -0.196 0.488 -0.094 1.00
Mn 0.098 0.262 0.742 0.326 0.406 1.00
CE 0.670 0.748 0.051 0.688 -0.185 0.485 1.00
Ash 0.535 0.244 -0.128 0.205 0.185 -0.063 0.311 1.00
Zn -0.303 -0.166 0.218 -0.048 0.259 -0.020 -0.187 -0.140 1.00
Conclusions
PCA constitutes a valuable tool that allows the characterization and classification of honey samples of different origin that are difficult to characterize using univariate statistical methods. The most important contribution of PCA in this study was the identification of a group of variables that make it jointly possible to distinguish honey samples according to their botanical and geographical distribution. Thus, PCA and cluster analysis revealed that honey produced in three different regional climates (semi-arid, Atlantic and transitional forest zones) can be differentiated in terms of their mineral and trace elements, ash contents and electrical conductivity. Also, correlation analysis between the variables of honey samples from transitional forest zones suggested that the EC values depend not only concentration but are in fact mostly dependent on the mobility of ions present in the honey samples. This characterization with the aid of PCs, is of great importance to detect fraud or adulteration without the need for sophisticated techniques.
Acknowledgments
The authors thank Fundação de Amparo a Pesquisa do Estado da Bahia (FAPESB) and Coordenação de Aperfeiçoamento de Pessoal de Nível Superior (CAPES) for financial support.
References
1. Luis, F. C. G.; Jorge, A. P.; Louis, S. S.; Sauri-Duch, E.; Food
Chem. 2007, 103, 1032.
2. Elke, A.; Food Chem. 1998,63, 549.
3. Fallico, B.; Zappalà, M.; Arena, E.; Verzera, A.; Food Chem.
2004, 85, 305.
4. Ana, M. G. P.; Alfonso, J. G. B.; Carlos, C. M.; Rafael, J. G. V.; José, S. S.; Food Chem. 2006, 95, 148.
5. Cano, C. B.; Felsner, M. L.; Matos, J. R.; Bruns, R. E.; Whatanabe, H. M.; Almeida-Muradian, L. B.; J. Food Comp.
Anal.2001, 14, 101.
6. Rashed, M. N.; Soltan, M. E.; J. Food Comp. Anal.2004, 17, 725.
7. Vilma, B.; Petras, R. V.; Violeta C.; Food Chem. 2007, 101,
502.
8. Salim, O.; Hayette, L.; Paul S.; Food Contr. 2007, 18, 52. 9. Roberta, S.; Nadia, S.; Ângelo, P.; Maria I. P.; Paola C. P.; Gavino
S.; Andrea T.; J. Chromatogr., A.2005, 1090, 76. 10. Pohl, P.; Prusisz, B.; Talanta 2006, 69, 1227.
11. Arnon, D.; Ohad, A.; Yelena, Y.; Arthur, S.; Sharoni, S.; Int. J.
Food Sci. Technol. 2006, 41, 387.
12. Vikas, N.; Sarkar, B. C.; Sharma, H. K.; Bawa, A. S.; J. Food
Comp. Anal. 2003, 16, 613.
13. Imad, O.; Saleh, A. L.; Hasan, D.; Ibrahim, Al-N.; Amin, I.; Valery, M. D.; Lumír, O. H.; Food Chem. 2007,101, 1393.
14. Lachman, J.; Kolihova, D.; Miholova, D.; Kosata, J.; Titera, D.; Kult, K.; Food Chem. 2007, 101, 973.
15. Corbella, E.; Cozzolino, D.; LWT-Food Sci. Technol. 2006, 39,
534.
16. Rut, F. T.; Juan L. P. B.; Miguel, A. B. L.; Manuel C. M.; Juan C. J. S.; Guiraúm, A. P.; Talanta 2005, 65, 686.
17. Hernández, O. M.; Fraga, J. M. G.; Jiménez, A. I.; Jiménez, F.; Arias, J. J.; Food Chem. 2005, 93, 449.
18. Felsner, M. L.; Cano, C. B.; Bruns, R. E.; Watanabe, H. M.; Almeida-Muradiane, L. B.; Matos, J. R.; J. Food Comp. Anal.
2004, 17, 737.
19. Bertelli, D.; Plessi, M.; Sabatini, A. G.; . Lolli, M.; Grillenzoni,
F.; Food Chem. 2007, 101, 1565.
20. Luís, C. M.; Augusta, C. C. C. M.; Ivani, P. O.; Ciênc. Tecnol.
Aliment.2005, 25, 8.
21. AOAC: Official methods of analysis; Association of Official
Analytical Chemists; 14th ed.; Washington, DC, 1984.
22. Carolina, A.; Pilar, B.; Beatriz, E.; Food Chem. 2007, 101,
695.
Received: June 25, 2007 Web Release Date: March 5, 2008
Figure 3. Score plot of honey samples (PC2 vs PC1): , Transitional