The Interpretation of Water Anomalies in
Terms of Core-Softened Models
E. A. Jagla
†The Abdus Salam International Centre for Theoretical Physics, Strada Costiera 11, 34014, Trieste, Italy
Received on 30 July, 2003.
In the first part of this paper I review the understanding of anomalous properties of water in terms of particles interacting by core-softened potentials. I discuss the origin of the bulk anomalies in terms of the two different configurations of neighbor particles: low energy–high volume and high energy–low volume. In the second part I study some anomalies of water under strong spatial confinement, namely when it lubricates a contact between two solid surfaces. Solvation and friction forces are studied as a function of lubricant thickness. Whereas for hard core particles maxima in the solvation force are correlated with maxima in the friction force, for soft core particles and appropriately chosen parameters the opposite is true. This leads to a reduction of the friction coefficient of about one order of magnitude in the second case. I argue that materials that expand when freeze may be modeled in terms of soft core particles, and that these materials are naturally good boundary lubricants.
1
Introduction
There is no doubt that water is (from many points of view) the most important liquid on earth. It cannot be denied also that it is a liquid with many anomalous properties. In search-ing for the origin of these anomalies, a natural question is whether they are independent of each other, or they can be ascribed to some common and fundamental origin, and if the second is the correct view (as I will argue to be the case), what this fundamental origin is. Trying to systematize the anomalous properties of water under a unifying principle, it is illuminating the observation that most of the anoma-lies can be re-obtained with a model of classical particles interacting with a particularly chosen spherically symmet-ric potential of the core-softened type. This model is simple enough as to permit a qualitative discussion of the origin of the anomalies, and the identification of its ultimate physical origin.
Core-softened potentials were first considered by Stell and Hemmer[1] some thirty years ago. However, it has been recognized only recently that these models reproduce most of the anomalous properties found in water. My presenta-tion has the following scheme. In the first part I will briefly review results obtained in the last few years on the anoma-lous properties of core-softened models, in particular refer-ring to the description of water anomalies. Hoping than this will persuade the reader that these models capture the main physics behind water anomalies, in the second part I will present results on the fluidity and lubrication properties of these models under confinement. They permit to under-stand why the lubricating properties of water are anomalous and also provide some ideas for the search of materials with good lubricating properties.
2
The explanation of bulk water
anomalies in terms of core-softened
potentials
2.1
Motivation
of
core-softened
models.
Anomalous melting and density anomaly
Although it is the nature of the hydrogen bond that gives water most of its especial character, it is more important from our point of view the statement that water is a
tetra-hedral liquid. In fact, the oxygen in the water molecule
tends to form a tetrahedron with its two own hydrogens and with two other hydrogens of neighbor molecules via hy-drogen bonds. The tetrahedral structure is then supported by hydrogen bonds, but from our perspective we take the tetrahedral structure as more fundamental. In fact, most of the description of anomalous properties that will be made here apply also to the whole family of tetrahedrally
coor-dinated materials[2, 3]. In addition to water they include a
lot of substances based on the prototypical tetrahedral (sp3 -coordinated) elements: carbon, silicon and germanium.
pictorially displayed in Fig. 1(a). We may wonder whether the existence of these two kinds of configurations is enough to produce the melting anomaly and also what is the sim-plest model we can imagine with these two configurations. The answer to the first question is positive. To address the second we introduce the core-softened Stell-Hemmer poten-tials.
(b) (a)
r1
r0 r
V
ε0
Figure 1. (a) Two types of local arrangement between water molecules: low energy–high volume (left) and high energy–low volume (right) (continuous line indicate intramolecular bonds, dashed lines are hydrogen bonds). (b) A spherically symmetric core-softened potential, with the two distances mimicking the con-figurations in (a).
In this model, the energy between two spherical particles in the system is composed of a hard core at some distance r0plus a shoulder than extends up to some other distancer1 (see Fig. 1(b)). By now we take the potential to be purely re-pulsive. Some details of the potential are not relevant for the discussion. For instance, some people have studied it using a square shoulder instead of a linear one, and we will also present results for a smoothed version of the linear shoulder case. However, the crucial point is that there should be an abrupt transition between low energy–high volume configu-rations (represented by particles at relative distancer1) and high energy–low volume configurations (represented by par-ticles at relative distancer0). Simulating a classical model of particles interacting with this potential we do observe anomalous melting[5]. In Fig. 2(a) we see the evolution of specific volume as a function of temperature for a system at pressureP = 1.0ε0/r
2
0(for clarity I show here results for a two-dimensional system). The melting transition with den-sity increase is clearly visible. Snapshots of the system [Fig. 2(b)] show in fact that the crystalline phase is a triangular structure with lattice parametera∼r1. In the liquid phase, however, there is energy available for neighbor particles to surmount the energy shoulder of its neighbors, and this pro-duces a density increase upon melting. Density continues to increase after melting for a while, and then decreases start-ingT ≃ 0.15ε0. Then this temperature marks a point of
maximum density in the fluid, very much as real water at 4C.
0.01 0.1
2.1 2.2 2.3 2.4
(a)
T/
ε0v/
r
02
T/ε0=.146
T/ε0=.296
T/ε0=.060 T/ε0=.021
Figure 2. (a) Evolution of specific volume as a function of temper-ature for a two dimensional system withr1/r0= 1.65, at pressure
P = 1.0ε0/r 2
0. Results were obtained decreasing and increasing temperature, as indicated by the arrows. The anomalous melting and the temperature of maximum density (minimumv) are clearly observable. (b) Snapshots of the system at different temperatures (dots indicate the hard core radiusr0of the particles). Note that there are essentially no particles (except a few defects) at distance r0 in the lowest temperature picture, whereas in the fluid phase, at larger temperature, there are many. This effect produces the anomalous melting and the density anomaly (adapted from Ref. [5]).
2.2
Compressibility anomaly and the second
critical point
In an attempt to systematize the anomalous properties of wa-ter, H. E. Stanley and co-workers introduced[6] the hypoth-esis of a second critical point (SCP) in its phase diagram. The SCP would be the end point of a line of first order tran-sition between two different liquid (or glassy, as tempera-ture is very low) phases, very much like the normal criti-cal point is the end point of the liquid-gas coexistence line. Estimations[6, 3] indicated that the SCP would be located in a region of the phase diagram not directly accessible, as liq-uid water cannot be avoided to crystallize there. However, it was Stanley’s suggestion that the existence of the SCP can generate anomalies in the properties of water, even relatively far away from the critical point itself. Then the effects of the SCP are observable even if the SCP itself remains hidden.
different interpretation of the relation between the SCP and thermodynamic anomalies. In my view it is not the existence of the SCP that generates the thermodynamic anomalies, but it is in some sense the opposite. To understand this let us first discuss the compressibility anomaly in core-softened models[7]. We will need to consider the supercooled liq-uid regime[13]. In order to study supercooled flliq-uid phases theoretically, some mechanism has to be postulated to avoid crystallization of the system. A simple possibility is to con-sider a polydisperse system, formed by particles of differ-ent sizes. This may avoid crystallization, and then the fluid phase can be claimed to exist down to zero temperature (note that experimentally the system can be supercooled only in particular conditions, since the most stable configuration at low enough temperatures is ultimately a crystalline one).
P
v
γ<γ
crγ=0
γ=γ
crγ>γ
crFigure 3. Qualitative evolution of specific volume vs. pressure of a core-softened model without attractive term in the supercooled regime (continuous curve). The effect of the inclusion of an attrac-tion between particles in the van der Walls limit (i.e., replacingP byP+γ/v2
) can be seen as dashed lines for progressively larger values ofγ, from right to left. In the last case a first order transition has appeared.
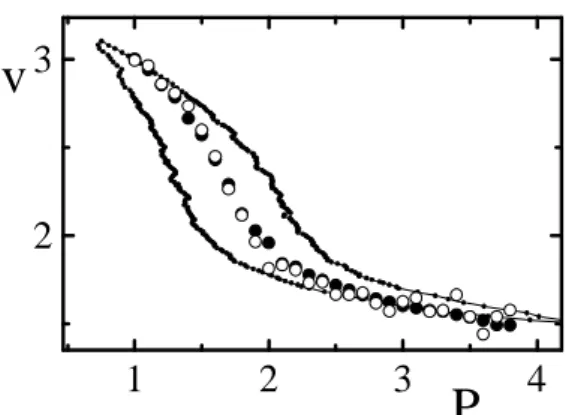
Let us imagine our core-softened model in the limit T →0and without the possibility to crystallize. I will con-centrate on its density vs. pressure characteristic. At very low pressures the particles behave as hard spheres of radius r0, since then cannot surmount the energy shoulder of its neighbors. On the other hand, at very high pressure the sys-tem behaves as a hard sphere syssys-tem but now with radiusr1, since the energy shoulder is negligible in this limit. Then we expect an evolution of specific volume (inverse of density) vs. pressure as depicted in Fig. 3 (continuous line). The transition between the low-P and high-P configurations is not expected to be sharp, since as the system is amorphous not all the particles collapse onto their neighbors at the same value of pressure. This kind of curve is in fact reproduced in simulations of the model[7, 9], as we see in Fig. 4. The com-pressibility coefficient is defined as−1
v ∂v
∂P . It is clear that a
density-pressure curve as that of Fig. 4 implies a maximum in the compressibility at some pressure, which is named the compressibility anomaly.
1
2
3
4
2
3
v
P
Figure 4. Results of simulations in a bidisperse system (see Ref. [9] for details) for the specific volume as a function of pressure at T = 0. Small dots: results from a single run increasing and de-creasing pressure. Large full dots: individual simulations quench-ing a high temperature fluid phase down to zero temperature. Large open dots: calculated by evaluating the enthalpyhin the individ-ual quenching runs, and then using the thermodynamic relation v = ∂h/∂P, valid atT = 0. The almost coincidence between open and full dots indicates thermodynamic consistence.vandP are in units ofr2
0andε0/r
2
0respectively (from Ref. [9]).
The compressibility anomaly is the germ of the SCP, that appears in the model only when an attractive term of suf-ficient strength is included in the potential energy between particles. We can see this in the simplest case, namely, when the attractive energy is supposed to be of long range, and then treatable in the van der Waals approximation[7]. In this limit, the inclusion of an attraction between particles is equivalent to the application of a fictitious negative pressure PvdW, given byPvdW = −γ/v2
, wherev is the specific volume of the system. The results for a system with a fi-niteγcan then be obtained from those with γ = 0 by the substitutionP →P +PvdW. AsPvdW depends itself on
density, this substitution is self-consistent, and can produce non-trivial results. We can see in Fig. 3 the qualitative ef-fect of this substitution on the original (continuous) curve. If γis larger than some critical valueγcr, the density-pressure
curve becomes reentrant, and this implies a first order transi-tion between two fluid phases (Fig. 5). Then, it is the com-pressibility anomaly together with an attractive part in the interaction that generate the SCP in core-softened models. The ability of these models to reproduce the anomalies in water suggests that this qualitative explanation applies also to real water, and then that the SCP is a consequence of the compressibility anomaly, and not the opposite. As an ad-ditional evidence supporting this view, I note that the SCP seems to exist in water [14], but it does not seem to occur in some other tetrahedral materials that share many of the anomalies of water. This may be the situation in silica, for instance[9, 15, 16].
2.3
Other bulk anomalies
P
T T T
P P
SCP
γ=0
γ >γcr
γ >γ>0cr
Figure 5. The supercooled pressure-temperature phase diagram of core-softened potentials as a function of the intensityγof the van der Waals attraction. The dashed region indicates the zone of the compressibility anomaly. If the attraction is larger than some value γcr the compressibility anomaly generates a first order transition line and the SCP appears (the normal liquid-gas critical point is not indicated).
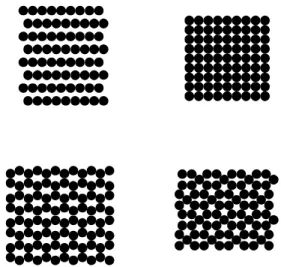
spherically symmetric core-softened model we are studying has also different crystalline structures. In two dimensions, in addition to the triangular one, the structures shown in Fig. 6 are stable in different regions of theP-T plane[5]. Even a quasi-crystalline phase becomes stable in a region of parameters[5]. In three dimensions the possible crystalline structures have not been surveyed in detail, but it seems in fact that there are many[17].
Figure 6. Other crystalline configurations for the two dimen-sional system, stable under particular pressure-temperature condi-tions (see Ref. [5] for details).
The last anomaly I will mention is of dynamic nature. It concerns the diffusivity of single particles in thermal equi-librium. In most liquids, this quantity is a monotonically decreasing function of pressure, as pressure constraints the movement of particles by caging them more tightly by its neighbors. In water, diffusivity first increases as a function of pressure, reaches a maximum and then decreases[18]. The increasing diffusivity with pressure is observed in core softened models[19, 12]: at low pressures particles do not have the possibility of going onto the energy shoulders of their neighbors. As pressure increases these states become
accessible as intermediate steps in the process of diffusion of single particles, and an increase of diffusivity is observed.
3
Lubricity and fluidity under
con-finement
Among the many anomalous properties of water there is its tendency to remain fluid even when strongly con-fined spatially[20, 21]. This property is puzzling since water molecule is rather spherical, and it is known that for most liquids with more or less spherical molecules, confinement produces a tendency to solidify[22, 23, 24], and in the end, a strong reduction in diffusivity. Ac-tually it is this confinement-induced solidification one of the most serious problems when using fluid lubricants in the so-called boundary regime[24], in which only few molecular layers of lubricant remain between the lubri-cate solids. In these nanocontacts, the hydrodynamic lu-brication regime[24] breaks down, and most of the fric-tion and wear between the two surfaces originates there. This problem would be severe in the operations of micro-electromechanical machines (MEMS), which up to now are usually used unlubricated.
Careful measurements using water films down to one or two molecular layers indicate that water performs extremely well as lubricant in this regime[20], which is again an indi-cation of its high lubricity under strong confinement. Un-derstanding these anomalous properties of water in the sim-plest way may contribute with some new ideas in the design of new lubricants for miniaturized equipment. I will present here some qualitative considerations of how the lubricity of water is preserved under strong confinement. The analysis will be based –again– in the use of core-softened models to qualitatively mimic the behavior of water[25].
num
be
r o
f
p
ar
tic
le
s
fri
cti
on
fo
rce
so
lv
ati
on
fo
rce
d
d
Figure 7. Qualitative evolution of the solvation and friction forces, and the number of particles in the gap as a function of the distance separating the confining walls, in a system with hard core interac-tion. The solvation force oscillates around the value corresponding to the bulk pressure in the lubricant. The correlation between sol-vation and friction forces is positive.
numbe
r o
f
p
ar
ticles
fri
cti
on
fo
rce
so
lv
ati
on
fo
rce
d
d
Figure 8. Same as previous figure for a system of core softened particles (the two radii of the particles are indicated in the draw-ings below). Now decreasing the distance between confining walls may cause the lubricant to become more fluid without squeezing out particles. This leads to a negative correlation between solva-tion and fricsolva-tion forces.
The situation can be thought to be different for core softened-particles, as depicted in Fig. 8. Now a reduction of the distance between the solids can be thought to produce a disordering of the lubricant particles without implying the squeezing out of them. This means for instance that under
the transition between the two right-most configurations in Fig. 8, the solvation force increases (since we are compress-ing a system with a fixed number of particles) but friction force decreases (since the system becomes more fluid). This leads to an overall negative correlation between solvation force and friction force. Since (as already said) typically only the upper parts of the oscillation of the solvation force are accessible experimentally, this implies that the minimum friction force is accessible, and this is experimentally desir-able.
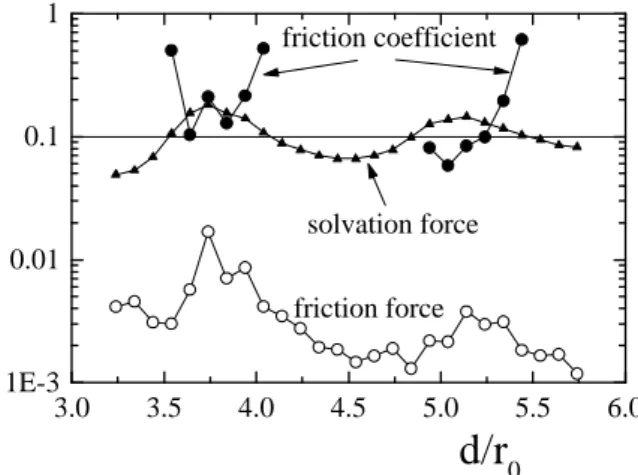
Results of molecular dynamics simulations with core-softened models support this qualitative description. I refer to Ref. [25] for details of the simulations. In Figs. 9 and 10 we see the results of simulations in two different cases. In Fig. 9 the externally applied pressure is such that the lubri-cating fluid behaves essentially as a hard core system (point Ain [25]). We see the positive correlation between solva-tion (Fs) and friction (Ff) forces, as in the qualitative
de-scription of Fig. 7. In 10, instead, the pressure is such that the fluid behaves anomalously (pointB in [25]). Now the correlation betweenFsandFf is negative. Due to this, the
friction coefficient attained (calculated in a standard way as Ff/(Fs−F0),F0being the reference force due to the bulk pressure in the lubricant) is about one order of magnitude lower.
3.0 3.5 4.0 4.5 5.0 5.5 6.0
1E-3 0.01 0.1 1
friction coefficient
solvation force
friction force
d/r
0
Figure 9. Results of numerical simulations in a ‘normal’ point of the phase diagram, in which particles behave essentially as hard core particles (point ‘A’ in Ref. [25]. See it for details). Friction Ffand solvationFsforces (per unit area) are in units ofε0/r
3
0.Ff
is calculated by keeping the distancedas fixed, at a shear veloc-ity given byv= 10−2v
0, withv0 =
p
ε0/m,mbeing the mass of the particles. Note thatFsoscillates aroundF0 = 0.1ε0/r
3
0,
which is the value corresponding to the bulk pressure of the lu-bricant. There is a positive correlation betweenFf andFs, as in the qualitative description of Fig. 7. dmeasures the distance be-tween the planes containing the center of the particles in the walls. Within those plains particles are accommodated in a rigid triangu-lar lattice, as explained in Ref. [25].
2 4 6 1E-3
0.01 0.1 1
d/r
0 friction coefficient solvation forcefriction force
Figure 10. Same as previous figure, now in an ‘anomalous’ point of the phase diagram (point ‘B’ in Ref. [25]). Ff is calculated at a shear velocity ofv= 5×10⁻³v
0). The correlation betweenFf andFsis now negative, as in the qualitative description of Fig. 8. Note that the range of friction coefficients that are be obtained in this case is about one order of magnitude lower than in the previous figure.
DiffusivityDis numerically calculated from the time evolu-tion of the posievolu-tion of a single particle during the molecular dynamics simulation as
|r(t)−r(0)| 2
= 2Dδt, (1)
whereδ is the dimensionality of the system. Results are shown in Fig. 11 for three different configurations of the confining walls: (i) crystalline commensurate (in which walls consist of fixed particles on a triangular lattice, with lattice parameter equal to the equilibrium bulk lattice param-eter at the corresponding pressure, and the top and bottom walls are in register); (ii) crystalline rotated (same as be-fore, but top and bottom walls rotated relatively 26 degrees around the normal); (iii) disordered (walls formed by parti-cles located at random, with the maximum density possible under the restriction that no particles in the walls are closer than 0.8r1from each other). We also see in Fig. 11 the bulk diffusivity of particles in three dimensions at the same con-ditions. The general trend is that diffusivity decreases when temperature is reduced. In the normal case however, this de-crease is much more rapid than in the anomalous case, and at the melting point, the diffusivity of confined particles in the normal regime is about a factor of 20 lower than in the anomalous case, comparing equivalent configurations of the confining walls. Then it can be concluded that confinement has an effect more drastic on the diffusivity of particles inter-acting through hard core interactions. For particles interact-ing through interactions of the core-softened type, the effect of confinement is much lower. A qualitative explanation can be given. In the strongly confined regime, the corrugation of the potential generated by the walls is an important factor affecting the mobility of particles. Strong corrugation is typ-ically related with low mobility. Hard core interactions pro-duce a strongly corrugated potential. For the core-softened interaction instead, there is a range of distances on which the corrugation potential becomes anomalously small (see Fig.
12). If the external pressure is such that particles of the film locates close to this distance from the wall, the confinement effect of the walls is reduced, favoring a greater diffusivity of the particles. This idea may serve as a starting point for the design of lubricants based on tetrahedrally coordinated materials.
0 0.05 0.1 0.15 0.2
0 0.02 0.04 0.06
Bulk commensurate rotated disordered
TM T
M
A B
D
T/ε0 Figure 11. Diffusivity of particles forming a single layer between two confining hard walls, in the normal (pointA,P = 0.1ε0/r
3
0,
left curves) and anomalous (pointB,P= 0.9ε0/r 3
0, right curves) case (see Ref. [25]), as a function of temperature. The bulk melting temperature in both cases is indicated. Calculations were done with a solvation force per unit area of ten percent of the bulk pressure. Dis in units ofr0
p
m/ε0. Three different cases are considered for the arrangement of particles in the confining walls (see text): (i) crystalline commensurate, (ii) crystalline rotated, and (iii) dis-ordered.
1 2
0 0
r
V(r)/ε
0
Figure 12. One dimensional example of the corrugation potential. Lines of equal vertical force for a probe particle interacting with particles aligned on a straight line with the potential indicated at the right. The maximum slope of these lines is the static friction coefficient for the probe particle. Note that there is an intermediate distance (roughly indicated by the arrow) in which the corrugation potential is particularly low.
4
Conclusions
materials obtained from studies of core-softened model po-tentials. It seems to me that these models capture the main physics behind the anomalies, and this is the existence of two different kinds of local arrangement of particles, with an abrupt transition between the two. Although quantitative predictions for water or other specific materials are not ex-pected to be obtainable from the core-softened calculations (at least in the present form), they provide a simple, yet qualitatively comprehensive framework that is useful both to understand well known properties, and also to suggest unexpected behaviors.
† On leave from CONICET and Centro At´omico
Bar-iloche, Argentina.
References
[1] P. C. Hemmer and G. Stell, Phys. Rev. Lett. 24, 1284 (1970); G. Stell and P. C. Hemmer, J. Chem. Phys. 56, 4274 (1972); J.M. Kincaid, G. Stell, and E. Goldmark, J. Chem. Phys. 65, 2172 (1976).
[2] C. A. Angell, R. D. Bressel, M. Hemmati, E. J. Sare, and J. C. Tucker, Phys. Chem. Chem. Phys. 2, 1559 (2000).
[3] O. Mishima and H. E. Stanley, Nature (London) 396, 329 (1998).
[4] P. V. Hobbs, Ice Physics, Clarendon Press, Oxford, 1974; V. F. Petrenko and R. W. Withworth, Physics of ice, Oxford Uni-versity Press, Oxford, 1999.
[5] E. A. Jagla, Phys. Rev. E 58, 1478 (1998).
[6] P. H. Poole, F. Sciortino, U. Essmann, and H. E. Stanley, Na-ture (London) 360, 324 (1992).
[7] E. A. Jagla, J. Chem. Phys. 111, 8980 (1999).
[8] E. A. Jagla, Phys. Rev. E 63, 061501 (2001).
[9] E. A. Jagla, Phys. Rev. E 63, 061509 (2001).
[10] G. Franzese, G. Malescio, A. Skibinsky, S. V. Buldyrev, and H. E. Stanley, Nature (London) 409, 692 (2001).
[11] M. R. Sadr-Lahijany, A. Scala, S. V. Buldyrev, and H. E. Stanley, Phys. Rev. Lett. 81, 4895 (1998).
[12] A. Scala, M. R. Sadr-Lahijany, N. Giovambattista, S. V. Buldyrev, and H. E. Stanley, Phys. Rev. E 63, 041202 (2001)
[13] P. G. Debenedetti, Metastable Liquids, Princeton Univerity Press, Princeton, 1997.
[14] O. Mishima, L. D. Calvert, and E. Whalley, Nature (London) 310, 393 (1984); 314, 76 (1995); O. Mishima, K. Takemura, and K. Aoki, Science 254, 406 (1991); O. Mishima, J. Chem. Phys. 100, 5910 (1994).
[15] D. J. Lacks, Phys. Rev. Lett. 84, 4629 (2000); E. A. Jagla, Phys. Rev. Lett. 86, 3206 (2001); D. J. Lacks, Phys. Rev. Lett. 86, 3207 (2001);
[16] K. Trachenko and M. Dove, Phys. Rev. B 67, 064107 (2003).
[17] E. A. Jagla, J. Chem. Phys. 110, 451 (1999).
[18] F. X. Prielmeier, E. W. Lang, R. J. Speedy, and H. -D. Lude-mann, Phys. Rev. Lett. 59, 1128 (1987).
[19] E. A. Jagla, Mol. Phys. 99, 753 (2001).
[20] A. M. Homola, J. N. Israelachvili, M. L. Gee, and P. M. McGuiggan, J. Tribology 111, 675 (1989); J. N. Israelachvili, Surf. Sci. Rep. 14, 109 (1992).
[21] U. Raviv, P. Laurat, and J. Klein, Nature (London) 413, 51 (2001).
[22] C. Rhykerd, M. Schoen, D. Diester, and J. Cushman, Nature (London) 330, 461, (1989); P. A. Thompson and M. O. Rob-bins, Science 250, 792 (1990).
[23] B. Brushan, J. N. Israelachvili, and U. Landman, Nature (London) 374, 607 (1995).
[24] B. N. J. Persson, Sliding Friction: Physical Principles and
Applications, Springer, Heidelberg, 1998.