1Núcleo de Estudos de Correntes de Densidade, Instituto de Pesquisas Hidráulicas, Universidade Federal do Rio Grande do Sul – UFRGS, Porto Alegre (RS), Brasil.
E-mails: [email protected], [email protected]
2Centro de Estudos de Geologia Costeira e Oceânica, Instituto de Geociências, Universidade Federal do Rio Grande do Sul – UFRGS, Porto Alegre (RS), Brasil.
E-mail: [email protected] *Corresponding author.
Manuscript ID: 20170066. Received in: 05/04/2017. Approved in: 08/14/2017.
ABSTRACT: Autogenic controls have signiicant inluence on deep-water fans and depositional lobes morphology. In this work, we aim to investigate autogenic controls on the topography and geometry of deep-water fans. he inluence of the sediment concentration of turbidity currents on deep-water fans morphology was also investigated. From the repeatability of 3D physical modeling of turbidity currents, two series of ten experiments were made, one of high-density turbidity currents (HDTC) and another of low-density turbidity currents (LDTC). All other input parameters (discharge, sediment volumetric concentration and grain size median) were kept constant. Each deposit was analyzed from qualitative and quantitative approaches and statistical analysis. In each experimental series, the variability of the morphological parameters (length, width, L/W ratio, centroid, area, topography) of the simulated deep-water fans was observed. Depositional evolution of the HDTC fans was more complex, showing four evolutionary steps and characterized by the self-channelizing of the turbidity current, while LDTC fans neither present self-channelizing, nor evolutionary steps. High disparities on the geometrical parameters of the fans, as characterized by the elevated relative standard deviation, suggest that autogenic controls induced a stochastic morphological behaviour on the simulated fans of the two experimental series.
KEYWORDS: Autogenic controls; Deep-water fans morphology; Turbidity currents; Physical modeling; Sediment concentration.
RESUMO: Controles autogênicos inluenciam signiicativamente a morfologia dos leques de águas profundas e seus lobos deposicionais. Neste trabalho, objetivamos investigar a ação dos controles autogênicos sobre a topograia e a geometria de leques de águas profundas, bem como a inluência da concentração de sedimentos gerados por correntes de turbidez sobre a morfologia destes. Por meio da repetibilidade de experimentos de modelagem física 3D de correntes de turbidez, foram realizadas duas séries de experimentos: correntes de turbidez de alta densidade (HDTC) e correntes de turbidez de baixa densidade (LDTC). Todos os demais parâmetros de entrada (vazão, concentração volumétrica de sedimentos e tamanho de grão) foram mantidos constantes. Cada depósito foi analisado mediante abordagens qualitativas e quantitativas e análise estatística. Em cada série experimental, foi observada a variabilidade dos parâmetros morfológicos dos depósitos gerados (comprimento, largura, razão comprimento/largura, área, topograia). Os leques de HDTC apresentaram evolução deposicional complexa, com quatro etapas evolutivas bem marcadas ao longo do tempo que resultaram no processo de autocanalização das correntes de turbidez, enquanto que nos leques de LDTC não foi identiicado autocanalização ou quaisquer etapas evolutivas distintas. Altas disparidades na geometria dos leques, caracterizadas pelos elevados valores de desvio padrão relativo, sugerem que os controles autogênicos induziram a um comportamento morfológico estocástico nos leques.
PALAVRAS-CHAVE: Controles autogênicos; Morfologia de leques subma-rinos; Correntes de turbidez; Modelagem física; Concentração de sedimentos.
Autogenic inluence on the morphology
of submarine fans: an approach from 3D
physical modelling of turbidity currents
Inluência de controles autogênicos na morfologia
de leques submarinos: uma abordagem com base
na modelagem física de correntes de turbidez 3D
Cristiano Fick1,2*, Rafael Manica1, Elírio Ernestino Toldo Junior2
INTRODUCTION
Turbidity currents are powerful processes in deep-water fan systems in terms of volume of sandy sediments trans-ported into ocean basins, and can generate large deposits with high potential for hydrocarbon reservoirs. he main sandy deposits are generated by turbidity currents, a sedi-ment density low in which the luid turbulence acted as the grains support mechanism (Kuenen 1950, 1951,Lowe 1982), which can store hydrocarbon in deep-water fan systems as lobe complexes and their elements, commonly located at the most distal areas of deep-water fans (Prélat et al. 2010).
he morphology of deep-water fans and lobes is trolled by allogenic and autogenic processes. Allogenic con-trols are related to extrinsic factors of the depositional system (Beerbower 1964, Johnson et al. 2001), such as sea level, cli-matic and tectonic changes. Autogenic controls, in turn, are related to intrinsic factors of the depositional system and its capacity of self-organization (Beerbower 1964, Paola et al. 2009), as avulsion, migration and abandonment of channels.
Recent studies (Straub et al. 2009, Hajek et al. 2010, Jerolmack & Paola 2010, Prélat et al. 2010, Wang et al. 2011) on autogenic dynamics and allogenic controls have been focused on autogenic signatures within the sedimentary record. hey intend to verify whether these records can be distinguished from allogenic signatures or mask some allo-genic processes. With the use of diferent approaches, i.e., physical and numerical modelling and description of ancient sedimentary systems at the outcrop, these studies introduced statistical and qualitative methods to quantify the inluence of self-organization on stratigraphic stacking and also on the morphology of sedimentary systems, particularly consider-ing the spatial and temporal scales of each type of control. Autogenic processes can erase the evidence generated by allogenic processes. However, a signiicant gap remains in the understanding of turbidity currents, because autogenic processes may form structures similar to allogenic processes.
he goals of this work are to observe the inluence of autogenic controls on geometry and morphology of fans and
lobes, as well as on the morphodynamic evolution of deposits, and to verify the inluence of sediment concentration of the turbidity currents on the geometry and morphology of the deposits. We explore the autogenic inluence on morphol-ogy and geometry of turbidity currents deposits with the 3D physical modelling of turbidity currents in a tank with sim-ilar slope and basin geometry. his is an important topic in deep-water sedimentology, and the data presented are relevant to the better understanding of the behavior of turbidity cur-rents in the natural environment and their resulting deposits.
APPARATUS AND METHODOLOGY
Experimental methodology
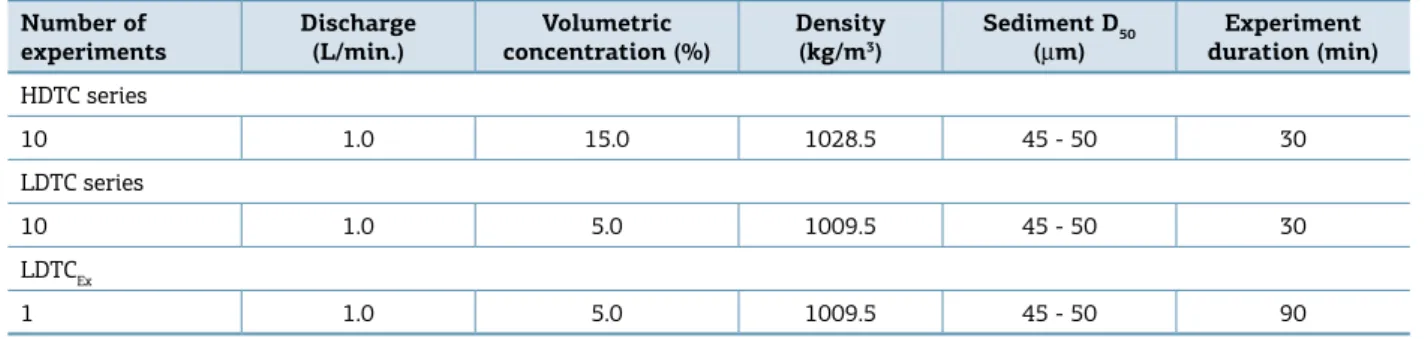
he experimental methodology reproduced a scenario of simulation in which only autogenic processes acted on the formation of deposits, i. e., without changes of extrin-sic factors to the experiment. Two series of ten continuous feed experiments of turbidity currents were made, one with higher sediment concentration (15% Cvol), representing high-density turbidity currents (HDTC>10% Cvol.; Kuenen 1966, Middleton 1967), and one with lower sediment con-centration (5%), representing low-density turbidity cur-rents (LDTC<10% Cvol; Middleton & Hampton 1973). In each experimental series, all input parameters, such as discharge, sediment concentration, suspension grain size, suspension volume and experiment duration (Tab. 1), had the same value and were maintained constant during each experiment, giving to the experiments an ideal condition for the evaluation of autogenic processes. In addition, an extra experiment of low-density turbidity currents (LDTCEx) was run at three times the duration.
We thus compared the deposits in each experimental series and observed their geometric and morphological trends, testing the autogenic inluence on depositional products and, also, the inluence of sediment concentration, comparing deposits of HDTC and LDTC series. he analysis was of individual deposits of each experiment series and not of stacked deposits.
HDTC: high-density turbidity current; LDTC: low-density turbidity current; LDTCEx: extra experiment of low-density turbidity currents.
Number of experiments
Discharge (L/min.)
Volumetric concentration (%)
Density (kg/m3)
Sediment D50 (μm)
Experiment duration (min) HDTC series
10 1.0 15.0 1028.5 45 - 50 30
LDTC series
10 1.0 5.0 1009.5 45 - 50 30
LDTCEx
1 1.0 5.0 1009.5 45 - 50 90
Experimental apparatus
and flow characteristics
he physical experiments were performed in a 230 cm-long × 110 cm-wide tank (Fig. 1A) featuring a 4º sloping loor that deepened from 30 cm at the input to 50 cm at the tank bottom (Fig. 1B). he simulation of the connection of the continental slope to the basin loor was made at the labora-tory of the Núcleo de Estudos em Correntes de Densidade of the Instituto de Pesquisa Hidráulica of the Universidade Federal do Rio Grande do Sul (NECOD/IPH/UFRGS).
he suspension was prepared in an auxiliary reservoir (feeder system) (Fig. 1A), consisting of a metal bowl of 90 L connected through pipes and valves to a metal tower with 270 cm in height (Fig.1A). A mechanical mixer inside this auxiliary reservoir was responsible for keeping the suspension homogenised. he suspension was composed of water and
sieved mineral coal with a density of 1,190 kg/m3 and grain size
ranging from 0.5 to 150 µm (with grain size median — D50
— approximately 45 µm). he sieved mineral coal was used due its good hydrodynamic behaviour in small-scale
exper-iments of turbidity currents (Manica 2002, Manica et al.
2006), decreasing the scale efects, beyond to have a low cost. he suspension was injected continuously into the tank after passing through a magnetic lowmeter (Siemens M1100) with a discharge time series at 4 Hz frequency. At the end of this feeder system, a difuser conduit (30 cm long) (Fig. 1A) was installed to conduct the low in order to decrease the efects of the jet generated at the injection point.
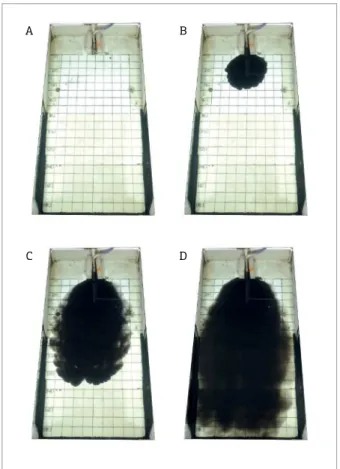
Two samples of the injected suspension were collected, one before and the other after the experiment, to determine the concentration and grain-size homogenization. he experi-ments were recorded using two cameras, one positioned at the top-view of the tank, recording the low initial propagation at the same location for all experiments every 10 s (Fig.2), and another movable, recording low and deposit details during the experiment. Qualitative visual description of the deposits evolution was also performed along the entire simulation to follow the depositional system development and/ or evolution.
Figure 1. Experimental apparatus. (A) Tank and tower of feeding (I – Tank, II – Metallic tower, III – reservoir,
IV – Mixer, V – Flow rate meter, VI – Difuser
conduit, VII – Tank bottom and their X and Y axis).
(B) Longitudinal proile geometry.
Water level
Diffuser
Flow
30 cm
50 cm
Tank bottom
50 cm 170 cm
)4° I)
II) III) IV)
V)
VI)
VII)
110 cm 230 cm
A
B
Figure 2. Experiment evolution. Sequence of images
showing the irst 90 s of the experiment, in which each picture is 30 seconds delayed. (A) 0s. (B) 30s. (C) 60 s. (D) 90s.
A
C
B
At the end of each run, a laser scanner (accuracy of 0.1 mm) swept the entire deposit to create digital surfaces. Finally, the sediment grain size of both mixture and deposit samples were performed by a Cilas 1180 laser particle analyser.
he main characteristic of the density lows generated in both experimental series was the bipartite behaviour of the currents, in which it was identiied, visually, a concentrated basal layer, that concentrated most of the sediments and a cloud of ine sediments in suspension (Alexander & Morris 1994, Parsons et al. 2002, Baas et al. 2004, Guirro 2008). he hydrodynamic analysis of the individual low layers (basal concentrated and ine suspension) was not possible due to the lack of appropriate instrumentation. However, the entire body of the currents were analysed by videos and images, in which was calculated the average Froude and Reynolds num-ber (Tab. 2) in the irst 60 s of experiment. hus, all HDTC and LDTC presented subcritical (Froude<1) and good degree of turbulence behaviour (Reynolds>500), when compared with open channel lows. hese characterizations showed no signiicant inlet jet inluence during the irst stages of the low; it was mainly aided by the wall difuser installed just after the source. Yet, the two simulated types of lows (15 and 5% — initial sediment volumetric concentration — Cvol) had Newtonian rheological behaviour, as both had less than 25% of volumetric concentration threshold of pure coal sed-iment (non-cohesive) in the mixture, as reported by Castro (2016). Despite the basal layer of the lows had had proba-bly a diferent concentration than the initial suspension, per-haps higher what would imply a non-Newtonian behaviour, it cannot be suggested exactly why, when a density low is streaming, sediments are settling and ambient luid is incor-porated (Mulder & Alexander 2001,Talling et al. 2012), in order to damp the concentration increasing and to maintain its rheological behaviour.
Analytical methodology
he analytical methodology used in this study was based in quantitative aspects, from the statistical analysis, and qualitative observations. his methodology was applied to evaluate both the boundary conditions of experiments and the deposits and their elements. In this manner, the identi-ication of a standard behavior of the results as function of constant boundary conditions, allowed an accurate method
to evaluate the morphologic features of the deposits (chan-nels, lobes, levees, etc.) regarding visual repetition.
he standard deviation (S) (Eq. 1) and the relative stan-dard deviation (RSD) (Eq. 2) were used to assess the repeat-ability of the experiments and quantify the level of variance of the geometric elements.
S =
n – 1
∑ (xi – x)2
(1),
in which xi is the individual value; x_, the arithmetic mean; and n,the total quantity of individual values.
RSD = S . 100
x
‒ (2),
in which S is the standard deviation (non-polarised) and x_, the arithmetic mean.
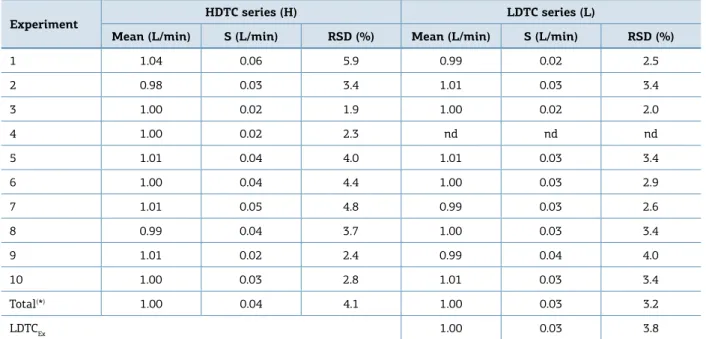
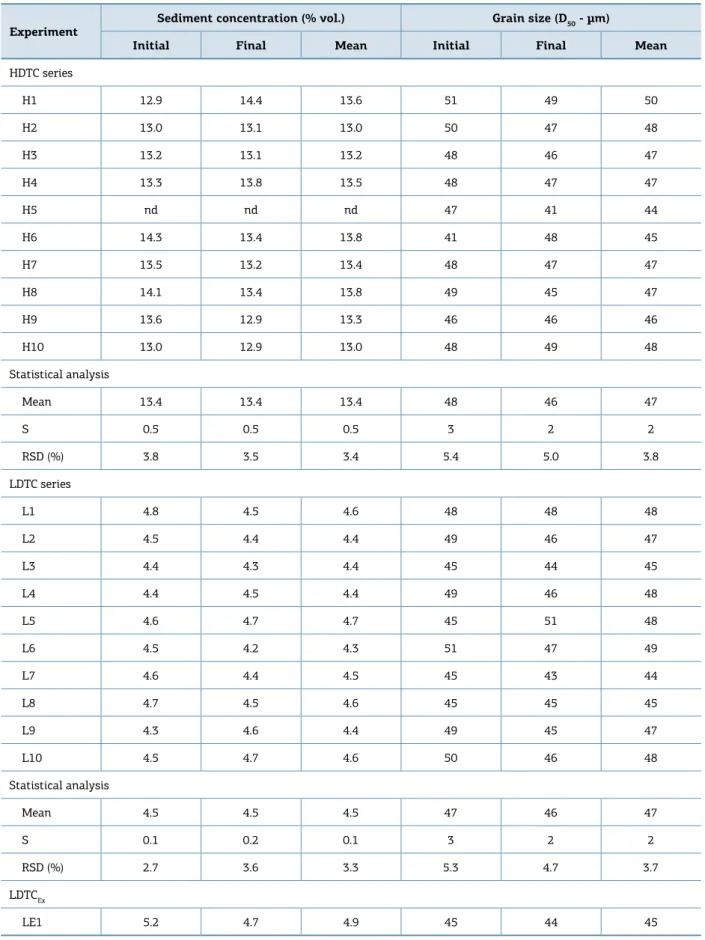
he input parameters of each suspension demonstrate the degree of repeatability of the experiments. In all experiments, the mean values for discharge (Tab. 3) were close to the expected value of 1.0 L/min. he RSD discharge values of the HDTC series (around 4% on average) were higher than LDTC series (3% on average). Averaged time series of discharge (per min-ute) in all experiments of both series (Fig.3) show few oscil-lations during the experiments, but, in most cases, discharge remained constant at 1.0 L/min. Mean values of volumetric concentrations and grain sizes (D50) (Tab.4) showed close to the expected values (Tab. 1). RSD values of sediment volumetric concentration and suspension sediment grain sizes were simi-lar in the HDTC and LDTC series and LDTCEx experiment. Low RSD values in all input parameters (discharge, vol-umetric sediment concentration and grain size of suspension sediments) indicate a satisfactory degree of experimental repeatability (>90%). From this statistical analysis, we have an experimental scenario of autogenic controls in the simulated deep-water fan systems that have minimal external controls.
MORPHOLOGY OF
SIMULATED DEEP-WATER FANS
he deposits generated in both experimental series settled along the slope area of the tank. On the basin (horizontal
Table 2. Physical parameters of the currents.
*Velocity average in the first 30 cm of the tank; **Thickness average in the first 30 cm of the tank; ***Data from Castro (2016); Cvol: sediment volumetric
concentration; HDTC: high-density turbidity current; LDTC: low-density turbidity current; LDTCEx: extra experiment of low-density turbidity currents.
Head Velocity - U
(m/s)*
Body Thickness
(m)**
Dynamic Viscosity Coeicient - μ***
Density (kg/m3)
Density Froude Number - Fr
Reynolds Number - Re
HDTC series (Cvol – 15%)
2.7x10⁻² 6.0x10⁻² 2.33x10⁻³ 1028.50 0.21 715.09
LDTC series (Cvol – 5%)
Experiment HDTC series (H) LDTC series (L)
Mean (L/min) S (L/min) RSD (%) Mean (L/min) S (L/min) RSD (%)
1 1.04 0.06 5.9 0.99 0.02 2.5
2 0.98 0.03 3.4 1.01 0.03 3.4
3 1.00 0.02 1.9 1.00 0.02 2.0
4 1.00 0.02 2.3 nd nd nd
5 1.01 0.04 4.0 1.01 0.03 3.4
6 1.00 0.04 4.4 1.00 0.03 2.9
7 1.01 0.05 4.8 0.99 0.03 2.6
8 0.99 0.04 3.7 1.00 0.03 3.4
9 1.01 0.02 2.4 0.99 0.04 4.0
10 1.00 0.03 2.8 1.01 0.03 3.4
Total(*) 1.00 0.04 4.1 1.00 0.03 3.2
LDTCEx 1.00 0.03 3.8
Table 3. Relative standard deviation analysis of discharge.
S: standard deviation; RSD: relative standard deviation; HDTC: high-density turbidity current; LDTC: low-density turbidity current; LDTCEx: extra experiment of low-density turbidity currents; *: average of statistical parameters; nd: not determined.
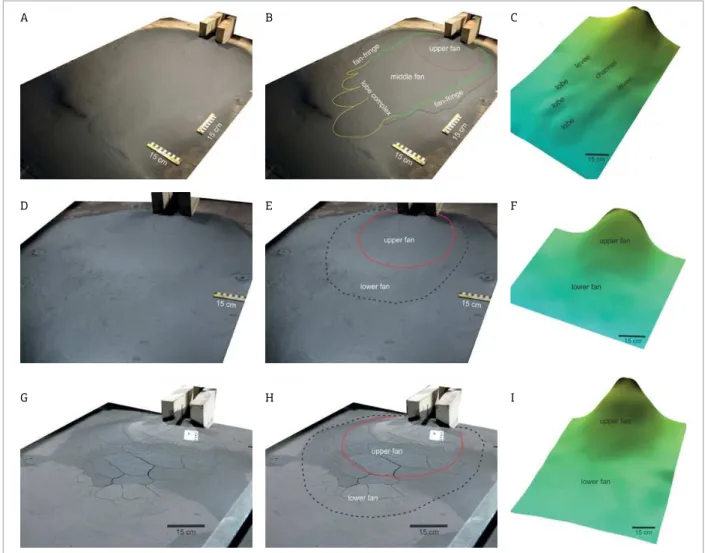
bottom), it was generated just a thin accumulation (<0.5 mm), deposited by the suspension cloud over the entire area of the tank. he accumulations that were considered as efective deposit areas (analysable) presented visible relief and, erally, thickness >1 mm. Both series of the experiments gen-erated fan-shaped deposits, here called simulated deep-wa-ter fans; showing diferent dimensions and morphologies. he HDTC deposits (Figs. 4A-4C) were longer and had a more complex morphology than the nearly round-shape deposits of LDTC (Figs. 4D-4F).
Morphology of high-density
turbidity current fans
The HDTC fans presented a slightly varied morphol-ogy (Figs. 5A-5T), mainly distinguished by internal units. From visual analysis and topographic surveying, four major
morphological elements were identiied and classiied: upper
fan, middle fan, lobe complex and fan-fringes, presented in detail in Figures 4A-4C.
■ Upper fan: the upper fan was identiied as a thicker semi -circular shaped body localized at the proximal area of the fans and sur-rounding the current entry point. his body had 250–300 mm radius and thickness between 20 and 45 mm. Proximal fans were identiied in all 10 simulated HDTC fans;
■ Middle fan: the middle fan was identiied by an elongated shape extending from the upper fan to the lobe complex and limited laterally by the fan-fringes, showing thicknesses between 3 and 20 mm. his morphological element was characterized by two diferent internal features. One has
Figure 3. Discharge temporal series. (A) High-density turbidity current series. (B) Low-density turbidity current series. (C) Extra experiment of low-density turbidity currents.
Discharge (l/min)
2.0
1.5
1.0
0.5
0
0 5 10 15 20 25 30
Time (min) A
Discharge (l/min)
2.0
1.5
1.0
0.5
0
0 5 10 15 20 25 30
Time (min) B
Discharge (l/min)
2.0
1.5
1.0
0.5
0
0 15 30 45 60 75 90
Experiment
Sediment concentration (% vol.) Grain size (D50 - µm)
Initial Final Mean Initial Final Mean
HDTC series
H1 12.9 14.4 13.6 51 49 50
H2 13.0 13.1 13.0 50 47 48
H3 13.2 13.1 13.2 48 46 47
H4 13.3 13.8 13.5 48 47 47
H5 nd nd nd 47 41 44
H6 14.3 13.4 13.8 41 48 45
H7 13.5 13.2 13.4 48 47 47
H8 14.1 13.4 13.8 49 45 47
H9 13.6 12.9 13.3 46 46 46
H10 13.0 12.9 13.0 48 49 48
Statistical analysis
Mean 13.4 13.4 13.4 48 46 47
S 0.5 0.5 0.5 3 2 2
RSD (%) 3.8 3.5 3.4 5.4 5.0 3.8
LDTC series
L1 4.8 4.5 4.6 48 48 48
L2 4.5 4.4 4.4 49 46 47
L3 4.4 4.3 4.4 45 44 45
L4 4.4 4.5 4.4 49 46 48
L5 4.6 4.7 4.7 45 51 48
L6 4.5 4.2 4.3 51 47 49
L7 4.6 4.4 4.5 45 43 44
L8 4.7 4.5 4.6 45 45 45
L9 4.3 4.6 4.4 49 45 47
L10 4.5 4.7 4.6 50 46 48
Statistical analysis
Mean 4.5 4.5 4.5 47 46 47
S 0.1 0.2 0.1 3 2 2
RSD (%) 2.7 3.6 3.3 5.3 4.7 3.7
LDTCEx
LE1 5.2 4.7 4.9 45 44 45
Table 4. Relative standard deviation analysis of the sediment concentration and grain size of the suspension in the experiments.
two longitudinal elongated relief features at the lanks of the middle fan similar to levee shapes, represented by incipient topographic highs extending from the upper fan to the lobe complex. he other one is a smooth and short channel between the longitudinal elongated depos-its, mostly illed by sediments at more proximal areas and more visible near the lobe complexes. All simulated HDTC fans presented longitudinal elongated relief features and channel with the exception of the experiment H10; ■ Lobe complex: the lobe complex occurred at the more
distal area of the simulated deep-water fan (lower fan), characterized by a group of lobes arranged side by side and, in a few cases, partially amalgamated. hey had vari-able sizes and lobe quantities (from 2 to 4 units), showing thicknesses between 1 and 3 mm. hese lobes were con-sidered the smallest hierarchical element in the lobe com-plexes, according to the Prélat et al. (2009) classiication.
he boundary between the lobe complex and middle fan and the boundaries of some lobes were difuse, due the smoothness of the topography of these deposit areas. Experiment H10 did not generate a lobe complex; ■ Fan-fringes: fan-fringes were thin sheets, thickness around
1 mm, located on the edge of the upper and middle fan, and, in a few cases, around the lobe complexes. All HDTC fans had fan-fringe elements.
Morphology of low-density
turbidity current fans
Simulated LDTC fans had a simple morphology consti-tuted by two elements. An upper fan occurred as a circular, conical feature around the current entry point, and a lower fan as a circular lat deposit that pinched out uniformly and smoothly from the upper fan to the edges (Figs. 4D-4F and Figs. 6A-6T). Lobes, levees and channels were not observed in
Figure 4. Details of morphological elements of the simulated deep-water fans. (A, B, C) Example of high-density turbidity current fan (H3): pure image, image with morphological units discrimination and topographic model with internal features discrimination. (D, E, F) Example of low-density turbidity current fan (L3): pure image with morphological units discrimination and topographical model with morphological units discrimination.
A B C
D E F
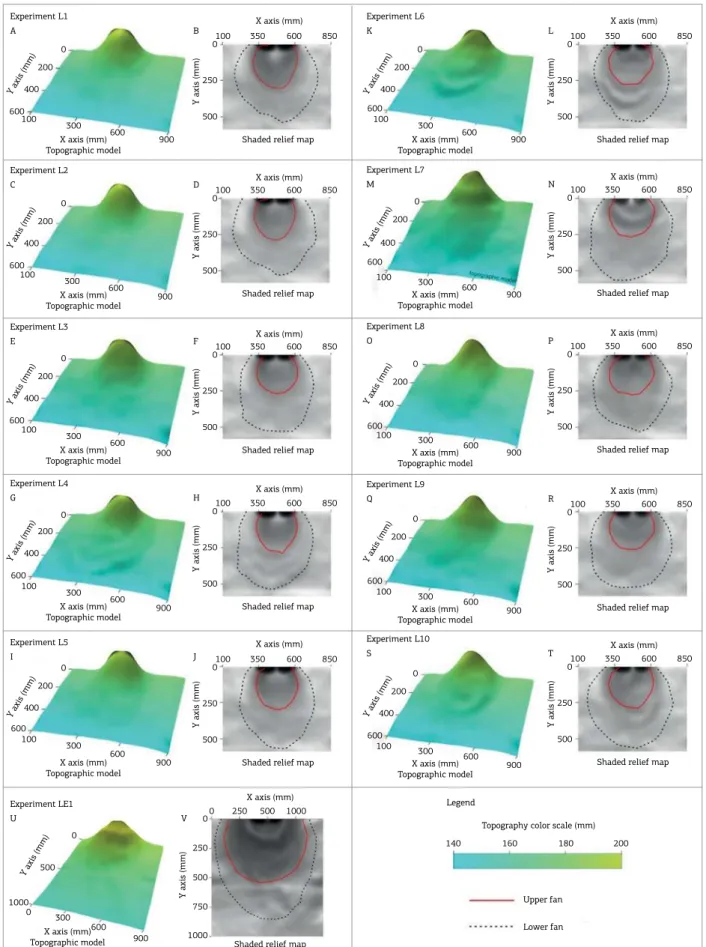
Figure 5. 3D topographical model (A, C, E, G, I, K, M, O, Q, S) and morphological units delimitation (B, D, F, H, J, L, N, P, R, T) of the high-density turbidity current fans.
Legend
Fan-fringe
Upper fan
Lobe complex (lobes)
Middle fan Experiment H1 A C D E F G H I J Experiment H2 Experiment H3 Experiment H4 Experiment H5
Topography color scale (mm) 100 120 140 160 180 200
K L S T Q R O P M N Experiment H6 Experiment H7 Experiment H8 Experiment H9 Experiment H10 0 0 250 250 0 750 1000 500 500 750 250 500 750 1000 0 250 500 750 X axis (mm) Topographic model
X axis (mm)
Y axis (mm)
Y axis (mm)
Shaded relief map
0 0 250 250 0 750 1000 500 500 750 250 500 750 1000 0 250 500 750 X axis (mm) Topographic model
X axis (mm)
Y axis (mm)
Y axis (mm)
Shaded relief map
0 0 250 250 0 750 1000 500 500 750 250 500 750 1000 0 250 500 750 X axis (mm) Topographic model
X axis (mm)
Y axis (mm)
Y axis (mm)
Shaded relief map
Shaded relief map
0 0 250 250 0 750 1000 500 500 750 250 500 750 1000 0 250 500 750 X axis (mm) Topographic model
X axis (mm)
Y axis (mm)
Y axis (mm)
Shaded relief map B 0 0 250 250 0 750 1000 500 500 750 250 500 750 1000 0 250 500 750 X axis (mm) Topographic model
X axis (mm)
Y axis (mm)
Y axis (mm)
Shaded relief map
Shaded relief map
0 0 250 250 0 750 1000 500 500 750 250 500 750 1000 0 250 500 750 X axis (mm) Topographic model
X axis (mm)
Y axis (mm)
Y axis (mm)
Shaded relief map
Shaded relief map
0 0 250 250 0 750 1000 500 500 750 250 500 750 1000 0 250 500 750 X axis (mm) Topographic model
X axis (mm)
Y axis (mm)
Y axis (mm)
Shaded relief map
Shaded relief map
0 0 250 250 0 750 1000 500 500 750 250 500 750 1000 0 250 500 750 X axis (mm) Topographic model
X axis (mm)
Y axis (mm)
Y axis (mm)
Shaded relief map
Shaded relief map
0 0 250 250 0 750 1000 500 500 750 250 500 750 1000 0 250 500 750 X axis (mm) Topographic model
X axis (mm)
Y axis (mm)
Y axis (mm)
Shaded relief map
Shaded relief map
0 0 250 250 0 750 1000 500 500 750 250 500 750 1000 0 250 500 750 X axis (mm) Topographic model
X axis (mm)
Y axis (mm)
Y axis (mm)
Shaded relief map
Figure 6. 3D topographical model (A, C, E, G, I, K, M, O, Q, S) and morphological units delimitation (B, D, F, H, J, L, N, P, R, T) of low-density turbidity current fans and extra experiment of low-density turbidity current fan. Obs.: distal fans were delimitated by the 1 mm isopach, due poor visible deposit edges.
600
100 500
250
100 350 600 850
0 300 600 900 400 200 0
Y axis (mm)
X axis (mm) Topographic model
Shaded relief map
Y axis (mm)
Experiment L1
A B
600
100 500
250
100 350 600 850
0 300 600 900 400 200 0
Y axis (mm)
X axis (mm) Topographic model
Shaded relief map
Y axis (mm)
Experiment L3
E F
600
100 500
250
100 350 600 850
0 300 600 900 400 200 0
Y axis (mm)
X axis (mm) Topographic model
Shaded relief map
Y axis (mm)
Experiment L4
G H
600
100 500
250
100 350 600 850
0 300 600 900 400 200 0
Y axis (mm)
X axis (mm) Topographic model
Shaded relief map
Y axis (mm)
J 600
100 500
250
100 350 600 850
0 300 600 900 400 200 0
Y axis (mm)
X axis (mm) Topographic model
Shaded relief map
Y axis (mm)
Experiment L2
C D
600
100 500
250
100 350 600 850
0 300 600 900 400 200 0
Y axis (mm)
X axis (mm) Topographic model
Shaded relief map
Y axis (mm)
Experiment L6
K L
600
100 500
250
100 350 600 850
0 300 600 900 400 200 0
Y axis (mm)
X axis (mm) Topographic model
Shaded relief map
Y axis (mm)
Experiment L7
M N
600
100 500
250
100 350 600 850
0 300 600 900 400 200 0
Y axis (mm)
X axis (mm) Topographic model
Shaded relief map
Y axis (mm)
Experiment L9
Q R
600
100 500
250
100 350 600 850
0 300 600 900 400 200 0
Y axis (mm)
X axis (mm) Topographic model
Shaded relief map
Y axis (mm)
Experiment L10 S T 600 100 500 250
100 350 600 850
0 300 600 900 400 200 0
Y axis (mm)
X axis (mm) Topographic model
Shaded relief map
Y axis (mm)
Experiment L8
O P
0
0 250 500 1000
1000 750 500 250 0 500 1000 0 600 900 300
Y axis (mm)
X axis (mm) Topographic model Experiment L5 I
Experiment LE1
U V
X axis (mm) X axis (mm) X axis (mm) X axis (mm)
X axis (mm) X axis (mm)
X axis (mm)
X axis (mm)
X axis (mm)
X axis (mm)
Shaded relief map X axis (mm)
Y axis (mm)
140 160 180 200
Upper fan
LDTC fans. he LDTCEx fan (Figs. 4G-4I and Figs. 6U-6V) presented the same morphological features as the LDTC fans, however the boundary between the upper and lower fan was very clear, due to the diferent gradient and thickness.
QUANTITATIVE COMPARISON
OF THE MORPHOLOGY OF THE
SIMULATED DEEP-WATER FANS
Two topographic sections of the laser sweep were selected to compare quantitatively the morphology of both series
from statistically analysis, one longitudinal (line 500 — Y axis) and the other one transverse (line 300 – X axis), in all deposits of them. he chosen lines are good elements for a quantitative comparison of deposits morphology, because they cross lines at approximately the maximum length and width of the deposits.
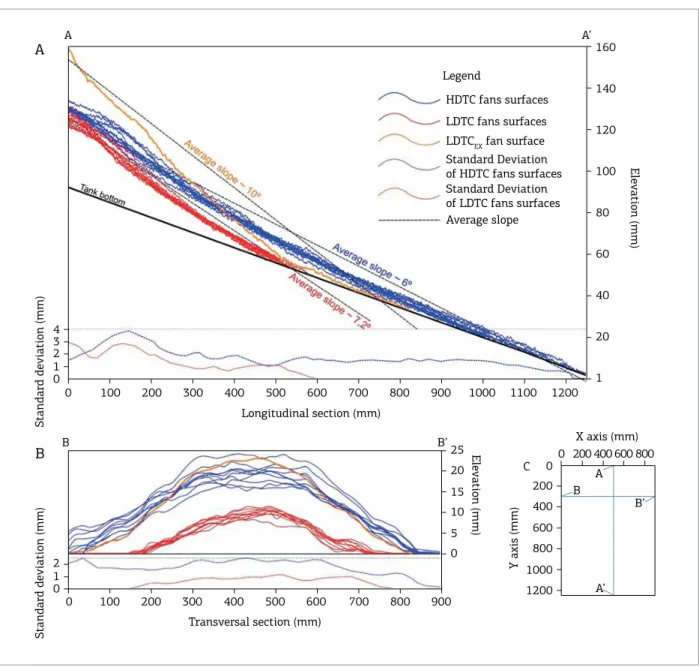
HDTC fans were thicker than LDTC fans along the entire longitudinal and transversal sections, except in the irst 200 mm of strike sections, in which some LDTC fans were thicker than HDTC fans (Figs. 7A and 7B). Deposits of the HDTC fans were longer and wider than LDTC depos-its. Simulated HDTC fans presented topographic gradients
Figure 7. Quantitative comparison between high-density turbidity current and low-density turbidity current fans morphology. (A) Longitudinal sections topography of the simulated deep-water fans of both series and standard deviation of their topographic levels. (B) Transversal sections topography of the simulated deep-water fans of both series and standard deviation of their topographic levels. (C) Sections orientation.
100
100
B B’
0 200 300 400 500 600 700 900
0 5 10 15 20 25
800 0
4 3 2 1 0
2 1 0
200 300 400 500 600 700 800 900 1000 1100 1200 1 20 40 60 80 100 120 140 160
Legend
HDTC fans surfaces
LDTC fans surfaces LDTCEX fan surface Standard Deviation of HDTC fans surfaces Standard Deviation of LDTC fans surfaces Average slope
Elevation (mm)
Elevation (mm)
Y axis (mm)
Standard deviation (mm)
Standard deviation (mm)
Longitudinal section (mm)
X axis (mm)
Transversal section (mm) A
A
B
C
A’
200 0
200 0
400
600
800
1000
1200
400 600 800
A B
B’
(average dip angle) lower than LDTC deposits (Fig. 7A), with no signiicant topographical break in the longitudinal section in both series. he LDTCEx fan showed the highest deposit thickness in the irst 350 mm of the longitudinal sections. At the beginning of the section, the LDTC EX fan was approximately twice thick than the HDTC and LDTC fans (Fig. 7A). Moreover, LDTCEx fan had higher average dip angle than fans of the other two experimental series, showing a signiicant topographic break at the 500 mm of the longitudinal section. Transversal sections (Fig. 7B) of the simulated fans presented shape distinctions between HDTC and LDTC deposits. he main diference was the top of the sections, in which HDTC fans were lat, and LDTC fans and LDTCEx fan were curved.
Longitudinal sections of the HDTC fans had higher topo-graphic S than LDTC sections, except in the irst 50 mm (Fig. 7A). In the transverse sections (Fig. 7B), the HDTC topography had higher values of S than LDTC topography along the entire sections.
GEOMETRICAL PARAMETERS OF
THE SIMULATED DEEP-WATER FANS
he geometrical parameters of length, width, length to width (L/W) ratio, volumetric centroids and fan areas were obtained for the efective deposits (Fig.8), i. e., the simu-lated deep-water fans. Length and width were measured in deposit images and 3D digital surfaces. he volumetric cen-troids (X and Y coordinates) and area were calculated from the 3D laser survey. Due to low thickness of the fans, the Z coordinate of the centroids was not considered.
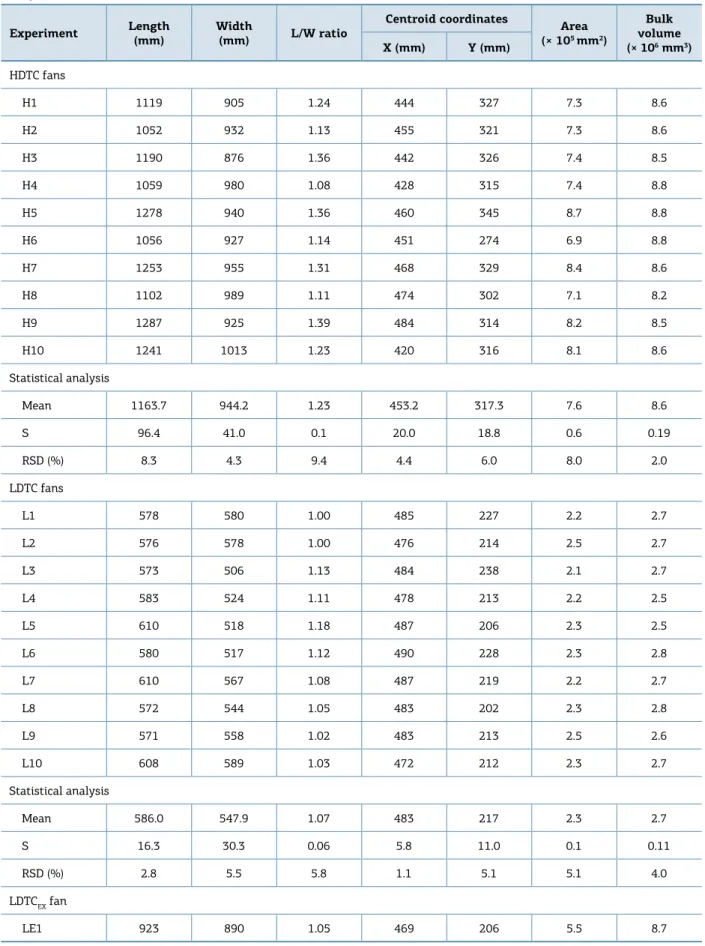
he values of the geometric parameters of the simulated deep-water fans of both experimental series, as well as their statistical analysis, are shown in Table 5.he HDTC deposits were approximately twice in terms of mean values of length and width than LDTC deposits (Fig.9). In the HDTC fans, the diference between the maximum value (H9) and the minimum value (H2) of length was 22%, and the maxi-mum value of width (H10) and minimaxi-mum value (H3) was 16%. In the LDTC fans, the maximum value (L5 and L7) and the minimum value (L9) of length had a discrepancy of 7%, while the maximum value (L10) and the minimum value (L3) of width had 14%. he LDTCEx deposit was almost two times longer and wider than the LDTC depos-its, but had smaller length and width than HDTC deposits. Simulated HDTC fans were on average 20% more elon-gated than LDTC fans and the LDTCEx fan, based on to their mean L/W ratios. he volumetric centroids (Fig. 10 and Tab.5) of HDTC deposits were positioning 100 mm farther downlow than the centroids of LDTC fans and the LDTCEx fan. In addition, the HDTC centroids loca-tion varied (mainly in X) more than LDTC fans. Simulated LDTC fans had L/W ratio and centroid coordinates simi-lar to the LDTCEx fan. HDTC fan areas were around three times greater than LDTC areas, and around 1,5 time greater than the LDTCEx fan.
According to RSD values (Tab.5), HDTC fans presented variability higher than 6% for all geometric parameters, except for the width and centroid coordinate X. On the other hand, LDTC fans presented variability lower than 6% for all geometric parameters.
GEOMETRICAL ANALYSIS OF
THE HIGH-DENSITY TURBIDITY
CURRENT LOBE COMPLEXES
he lobe complexes are the main depositional result of the turbidity currents in the natural environment and they constitute high-quality oil reservoirs. he geometrical anal-ysis of lobe complexes can provide consistent data for the interpretation of depositional processes and the inluence of autogenic controls in turbidity current deposits. hus, it focuses on the analysis of simulated lobe complexes of the HDTC fans for further discussion and interpretation. From the length, width, L/W ratio, area and area factor (lobe complex area to fan area ratio (A)) (Eq. 3), the lobe com-plexes and their individual lobes were analyzed to compare the morphology of the HDTC fans (Tab. 6). We preferred to use the area values rather than volume values, because of the diiculty in calculating the volume of the lobe com-plexes and their individual lobes; as they are similar and
Figure 8. Scheme of measurement of length, width
and centroids of the simulated deep-water fans, which were obtained from 3D topographic models and deposit images.
Fan length
Fan width
X Y
0
Centroid Do
Experiment Length (mm)
Width
(mm) L/W ratio
Centroid coordinates
Area (× 105 mm2)
Bulk volume (× 106 mm3)
X (mm) Y (mm)
HDTC fans
H1 1119 905 1.24 444 327 7.3 8.6
H2 1052 932 1.13 455 321 7.3 8.6
H3 1190 876 1.36 442 326 7.4 8.5
H4 1059 980 1.08 428 315 7.4 8.8
H5 1278 940 1.36 460 345 8.7 8.8
H6 1056 927 1.14 451 274 6.9 8.8
H7 1253 955 1.31 468 329 8.4 8.6
H8 1102 989 1.11 474 302 7.1 8.2
H9 1287 925 1.39 484 314 8.2 8.5
H10 1241 1013 1.23 420 316 8.1 8.6
Statistical analysis
Mean 1163.7 944.2 1.23 453.2 317.3 7.6 8.6
S 96.4 41.0 0.1 20.0 18.8 0.6 0.19
RSD (%) 8.3 4.3 9.4 4.4 6.0 8.0 2.0
LDTC fans
L1 578 580 1.00 485 227 2.2 2.7
L2 576 578 1.00 476 214 2.5 2.7
L3 573 506 1.13 484 238 2.1 2.7
L4 583 524 1.11 478 213 2.2 2.5
L5 610 518 1.18 487 206 2.3 2.5
L6 580 517 1.12 490 228 2.3 2.8
L7 610 567 1.08 487 219 2.2 2.7
L8 572 544 1.05 483 202 2.3 2.8
L9 571 558 1.02 483 213 2.5 2.6
L10 608 589 1.03 472 212 2.3 2.7
Statistical analysis
Mean 586.0 547.9 1.07 483 217 2.3 2.7
S 16.3 30.3 0.06 5.8 11.0 0.1 0.11
RSD (%) 2.8 5.5 5.8 1.1 5.1 5.1 4.0
LDTCEX fan
LE1 923 890 1.05 469 206 5.5 8.7
Table 5. Length, width, L/W ratio, centroids coordinates and area of simulated submarine fans and their statistical analysis.
Figure 9. Geometrical parameters of the simulated deep-water fans. (A) Graphic fan length x fan width. (B) Graphic
fan area x fan L/W ratio. Note that the high-density turbidity current (HDTC) fans occupy a larger area of the graphics than low-density turbidity current (LDTC) fans, suggesting higher geometrical variability of the HDTC fans than LDTC fans.
1000
800
W
idth (mm) L/W ratio
Length (mm) Area (× 105 mm2)
600
400
700
500 900 1100 1300 1.0
0.8 1.0 1.2 1.4
3.0 5.0 7.0 9.0
A B
HDTC fans LDTC fans LDTCEx fans
L/W ratio = 1
HDTC fans LDTC fans LDTCEx fans
Current entry point
A B
1200
0 200 400 600 800
320
350
400 420 440 460 480 500
290 260 230 200
1000 1000
800 600 400
Y axis (mm) Y axis (mm)
X axis (mm)
X axis (mm) 200
0
Tank bottom
Figure 10. X and Y coordinates of fan centroids of the both experimental series. Note the major dispersal of
centroids of the high-density turbidity current fans than centroids of low-density turbidity current fans.
very thin in all HDTC fans. On the other hand, this area analysis provided consistent data for the deposits analysis.
A = lobe complex area
fan area (3)
Based on the lobe complex L/W ratio and area (Fig. 11A), two distinct groups of simulated HDTC fans, each one com-prising about half of experiments, are apparent.
■ Group I: lobe complexes of simulated fans H1, H2, H4,
Lobe complex of
HDTC fans Length (mm) Width (mm) L/W Area (105 mm2) A (area factor)
H1 335 405 0.8 1.01 0.14
H2 319 388 0.8 1.04 0.14
H3 399 399 1.0 1.19 0.16
H4 327 357 0.9 0.72 0.10
H5 534 340 1.6 1.38 0.16
H6 275 474 0.6 0.89 0.13
H7 512 438 1.2 1.23 0.15
H8 325 390 0.8 0.80 0.11
H9 500 456 1.1 1.49 0.18
H10 nd nd nd nd nd
Statistical analysis
Mean 391.8 405.2 1.0 1.08 0.14
S 98.3 44.1 0.3 0.25 0.025
RSD (%) 25 11 29 24 18
Table 6. Geometrical parameters and statistical analysis of high-density turbidity current lobe complexes.
L/W: length to width ratio; S: standard deviation; RSD: relative standard deviation; HDTC: high-density turbidity current.
Figure 11. Geometrical parameters of lobe complexes of the high-density turbidity current fans. (A) Graphic of lobe complex area x lobe complex L/W ratio. (B) Graphic of fan L/W x lobe complex L/W ratio. (C) Graphic of A factor x lobe complex L/W ratio.
Lobe Complex L/W
0.4 0.6
0.7 0.7 1.1 1.3 1.5
0.8 1.0 1.2 1.4 1.6 A
Lobe complex area
(× 105 mm2)
H4
H8 H2
H6 Group I
Group II
1.0 × 10
5
H1 H3
H7 H5
H9
Lobe Complex L/W
1.6
1.4
1.2
1.0
0.8
0.6
0.4
0.8 0.10 0.12 0.14 0.16 0.18 0.20
C
A factor
H7
H9 H3
H2
H1
H6 H8 H4
H5
Group II
Group I
Lobe Complex L/W
1.0 1.2 1.4
0.4 0.6 0.8 1.0 1.2 1.4 1.6 B
Fan L/W H4
H8 H2
H6 Group I
Group II
H1
H3 H7
H5
smaller areas than group II fans. Moreover, group I fans presented the lowest fan L/W ratio (Fig. 11B) and the
lowest A factor (Fig. 11C);
■ Group II: lobe complexes of the simulated fans H3, H5,
H7 and H9, which had L/W ratio >1 and presented the larger areas than group I fans. Moreover, group II fans presented the highest fan L/W ratio (Fig. 11B) and
A factor (Fig. 11C).
Statistical analysis of lobe complexes of the HDTC fans (Tab. 6) conirms the high disparity in geometry among the lobe complexes, in which the RSD of length, width, L/W ratio and area were higher than fans geometry variability (Tab.5). In addition, A factor also had a considerable vari-ability in terms of RSD.
Individual lobes of the lobe complexes were also ana-lyzed for length, width and L/W ratio. In this analysis, the lobes were previously divided into lobe complexes group I and group II. he lobes presented a tendency to group together in two diferent regions (Fig. 12), accord-ing to their length and width, so that individual lobes of complexes group I were in a region (region I) and indi-vidual lobes of complexes group II were in other region (region II). Lobes of group I (region I) are smaller than lobes of group II (region II), according to their mean values (Tab. 7). On the other hand, L/W ratio had approximately the same mean values (2.0), indicating similar forms. RSD values show signiicant variance (between 20 and 40%) of geometrical parameters in both lobe groups. Length vari-ation was higher in group II, while width and L/W ratio were more variable in group I.
DESCRIPTIVE EVOLUTION OF
THE SIMULATED DEEP-WATER FANS
Depositional evolution of the simulated deep-water fans was obtained by visual description of the deposit, fol-lowing the supericial morphological evolution during the experiments. Internal architecture of the fans could not be observed due the lack of color contrast of the sedimentary material used in the models, and for the small thickness of the deposits as well. Depositional evolution was diferent between the two experimental series, but progradational and aggradational behaviour was observed in both series.
High-density turbidity
current fans evolution
All simulated HDTC fans had a complex and chrono-logically organised depositional evolution, except in experi-ment H10. Self-channelizing was the main process observed in HDTC fans (Métivier et al. 2005, Yu et al. 2006, Guirro 2008, Hoyal et al. 2008, Silva et al. 2012), through the formation of a central topographic channel (valley) that captured and channelized the turbidity current (Fig. 13). he morphologic evolution of the HDTC deposits pre-sented four well-deined steps, observed in all experiments except H10, whose deposit did not generate lobe complex formation and self-channelizing processes. hese four steps followed the following chronological order (Fig. 13): ■ First step: from the beginning to minute 10 (2/6 of
experimental time), the turbidity current entered the clean tank bottom, generating a central non-conined deposit, which prograded and aggraded along time
Figure 12. Graphic of length x width of the individual lobes and their respective regions (grey) according lobe complex groups.
L/W ratio = 1
Lobes width (mm)
300
200
100
100
0 200 300 400
0
Lobes length (mm) Individual lobes of Group I Individual lobes of Group II
Region I
Region II
L/W: length to width ratio; S: standard deviation; RSD: relative standard deviation.
Table 7. Statistical analysis of the depositional lobes geometrical parameters.
Statistical parameter
Length (mm)
Width
(mm) L/W ratio
Depositional lobes of Group I
Mean 24.2 12.6 2.0
S 5.5 4.2 0.8
RSD 23% 34% 38%
Depositional lobes of Group II
Mean 29.0 15.3 2.1
S 9.8 4.5 0.5
(Fig. 13A). Until this time, 2/6 of total time, the evolu-tion of HDTC fans is very similar to the entire LDTC fans, as shown in the next sub-item;
■ Second step: from minute 10 to minute 20 (4/6 of
experimental time), the non-conined deposit aggraded and formed a topographic high (irst step), which nearly plugged the current entry point, dividing the low into two lateral fronts. By compensational stacking (Straub et al. 2009), from this moment (minute 10) on, the for-mation of two elongated deposits started at the non-con-ined central deposit lanks, prograding and aggrading until minute 20 (Fig. 13B);
■ hird step: from minute 20 to minute 25 (5/6 of experi-mental time), lateral elongated deposits stopped progra-dation and aggraded, generating two lateral topographic highs (similar to levees morphology) and a topographic low in the middle (incipient channel). Consequently, the two turbidity current fronts started a lateral movement
toward the centre. At this time, an incipient self-channel-ing of the current began, but the low remained divided in two fronts (Fig. 13C);
■ Fourth step: from minute 25 to 30 (6/6 of experimental time), complete self-channelizing of the turbidity cur-rent uniied the low. Partial illing of the central topo-graphic low occurred, forming a very smooth channel and a lobe complex at distal areas (Fig. 13D).
Low-density turbidity
current fans evolution
In LDTC series, deposits evolution was characterized by a continuous and uniform progradation and aggradation along time (Fig. 14), generating a smooth fan-shaped body. LDTC fans evolution presented similar evolution steps and no self-channelizing of the simulated turbidity currents, in which the low remained non-conined during the entire experiment duration. he LDTCEx fan had three times more
Figure 13. Descriptive depositional evolution of simulated high-density turbidity currents fans. (A) First
evolutional step: deposit stage ater 10 min (2/6 of experimental time). (B) Second evolutional step: deposit stage ater 20 min (4/6 of experimental time). (C) Third evolutional step: deposit stage ater 25 min (5/6 of experimental time). (D) Fourth evolutional step: deposit stage ater 30 min (6/6 of experimental time).
The turbidity current enters and advances in the clean tank (slope zone), generating a central
non-confined progradation
of the central
non-confined lobe.
Aggradation of the elongated marginal deposits and lateral displacement toward to the centre, approaching
them (green). The turbidity
current remains divided, but, due to marginal deposits approaching, the current started the
self-channelizing.
Complete self-channelizing
of the turbidity current.
Deposition of lobes on
distal zones (yellow).
Formation of a topographic high in front of the current entry point, due to the central deposit aggradation
and progradation. The
topographic high plugged the turbidity current,
dividing it in two fronts.
Deposition of two elongated marginal deposits (blue) at
the central deposit flanks.
Images of turbidity
current at the
proximal area of the tank (H9).
Interpretativ
e
cross-section.
Schemes of deposit ev
olution according
descriptiv
e analysis
(superior view).
Description of evolution steps.
1250 0 20 40 60 1000 750 500 250 0 1000 750 500 X axis (mm) 250
A B
0 500 750 1000
X axis (mm) 250
A B
0 500 750 1000
X axis (mm) 250
A B
0 500 750 1000
X axis (mm) 250
A B
0
Y axis (mm)
1250 1000 750 500 250 0
Y axis (mm)
Z axis (mm) 0
20 40 60
Z axis (mm)
1250 1000 750 500 250 0
Y axis (mm)
0 20 40 60
Z axis (mm)
1250 1000 750 500 250 0
Y axis (mm)
0 20 40 60
Z axis (mm)
20 cm
A A’
20 cm
20 cm
250 1250
1000 750 500 250 0
60
40
20
0
0 500 750 1000
X axis (mm)
A A’
Z axis (mm)
Y axis (mm)
A D
B
C
Figure 14. Descriptive depositional evolution of simulated low-density turbidity current (LDTC) fans.
(A) Deposit stage ater 10 min (1/3 of experimental time). (B) Deposit stage ater 20 min (2/3 of experimental time). (C) Deposit stage ater 30 min (3/3 of experimental time). (D) Scheme of simulated LDTC fan progradation
(superior view) and aggradation (cross section) during experimental time.
experimental duration, but presented the same depositional
evolution of the LDTC fans. However, the LDTCEx fan
presented higher aggradational and lower progadational behaviour in relation to LDTC fans.
DISCUSSION
The discussion is divided into three parts. Part one discusses the analogy with modern deep-water fans, part two deals with the inluence of the sediment volumetric
concentration on HDTC and LDTC fans morphology, and part three approaches the inluence of the autogenic forces on the simulated deep-water fans morphology.
Comparison with
modern deep-water fans
the average L/W ratio of HDTC and LDTC fans and the L/W ratio of some important deep-water fans of the world (Fig. 15). Two graphic regions with 95% similarity degree (5% to more or less about the average L/W ratio of HDTC and LDTC fans) were created to establish good modern ana-logs. According to the graphic regions, Delgada Fan (USA, California) has the best similarity with the simulated HDTC fans, while the Magdalena Fan (Caribbean Sea, Colombia)
resembles with the LDTC fans and LDTCEx fan.
Beyond the L/W ratio comparison, other geologic parameters of these modern deep-water fans can be linked to reinforce the comparisons in a relative way. Discharge and average sediment load at their feed river mouth is presented in Tab. 8. he sediment concentration average at the feeder river mouth of Delgada Fan is higher than Magdalena
Fan. Moreover, Delgada Fan is from the California
bor-derland, a small-active continental margin (Somme et al.
2009), characterized by the strong longshore drift-feed of
their canyons in a narrow continental shelf (Covault et al.
2007). hese two sedimentological parameters combined have great capacity to generate high-density turbidity cur-rents at continental slope canyons (Piper & Aksu 1987,
Mulder & Syvitski 1995, Mulder et al. 2003), therefore
Delgada Fan is more inclined to be dominated by HDTC than Magdalena Fan, supporting HDTC fans as good ana-logs to Delgada Fan.
In the other hand, Magdalena Fan is located on a mixed (active/passive) narrow continental shelf fed mainly by the Magdalena River mouth, settling its sediment load directly
on the continental slope (Kolla & Buler 1983, Ercilla et al.
3.0
2.0
L/W ratio
1.0
0
HDTC’s average L/W
LDTC’s average L/W
LDTCEx fan L/W
1.23
1.07 1.05
+5% - 1,30
-5% - 1,17 +5% - 1,13
-5% - 1,01 Similarity region of HDTC fans
Similarity region of LDTC fans
Nile
La JollaEbro
MississipiMagdalena
AmazonDelgada
Navy Danube
Rhone
Redondo Var
IndusMonterey
Tyrrhenian Astoria
Congo Hueneme
Bemgal Cap Ferret
Figure 15. Morphological comparison among the simulated and modern deep-water fans: graphic of L/W ratio with the average L/W of high-density turbidity currents (HDTC) and low-density turbidity current (LDTC) fans and L/W of modern submarine fans, showing Delgada Fan into the similarity region of HDTC fans and Magdalena
Fan occupying the similarity region of LDTC fans. (*): The boundaries of the similarity regions were deined by 5% above and below of the average L/W ratio of HDTC and LDTC fans (similarity degree of 95%).
Fan
Average of water discharge at river
mouth (m3/s)*
Sediment load from river (× 106 ton/year)*
Average sediment concentration at river mouth (kg/m3)
Fan legth (km)*
Fan volume (× 103 km3)*
Fan area (× 103 km2)*
Magdalena 7,500 144 0.61 300 180 53
Delgada 22 1.50 2.16 350 50 40
Table 8. Hydrological and sedimentological parameters of the natural fan fed rivers at mouth.
2002). Longshore drift-feed has no documented inluence in the Magdalena Fan. Its low sediment concentration at the river mouth, in relation to the Delgada Fan, suggests that the Magdalena Fan is more likely to be dominated by LDTC than HDTC, although some events of debris-low also occurred (Kolla & Buler 1983). herefore, LDTC fans can be good analogs to Magdalena Fan.
Another experimental result related to the modern and ancient deep-water fans concerns the relief gradient (slope) of
the fans (Fig. 7A). According to Somme et al. (2009), longer
fans have lower gradients. he same relationship was found in the simulated deep-water fans. HDTC fans were longer
and had lower gradients than LDTC and LDTCEx fans.
he comparison between the HDTC lobes and the lobes
of some modern deep-water fans (Prélat et al. 2010) used
the L/W ratio (Fig. 16). he mean of the L/W ratio of the HDTC lobes had the same value as the lobes of Congo (Africa west coast), Kutai (Indonesia) and Niger (Nigeria) Fans, and similar values of Fan 3 (Karoo Basin — ancient) and Golo Fan (France). he lobes of the Amazon Fan have diferent values. hus, we consider that the depositional lobes generated in HDTC experimental series have similarity in terms of L/W ratio with lobes present in many deep-water fans systems around the world.
Despite the simpliied morphology of simulated fans relative to modern fans, mainly in terms of their short and straight (simulated models) relative to the long and sinuous (natural examples) channels of the actual examples, which probably relects a more complex set of sedimentological pro-cesses acting in deep-water environments, it is here assumed that a satisfactory unreasonable efectiveness in terms of both fans and individual lobes geometry was successfully achieved through physical simulation. A large similarity in terms of L/W ratio between simulated and modern deep-water fans, as well as between their individual lobes, points to a good comparison degree.
The influence of the sediment
volumetric concentration of
high-density turbidity current
and low-density turbidity
current on fans morphology
he great disparity presented by the simulated HDTC and LDTC fans in terms of morphology and depositional evolution suggests that the sediment volumetric concentra-tion of the simulated turbidity currents had decisive inluence on the diferent morphologies, despite both low types had the same Newtonian rheological behaviour. he quantitative (L/W ratio) and qualitative (descriptive) analysis led to the observation that the HDTC fans had a diverse morphology of four, well developed, major relief features in the more elon-gated and lower gradient fans (than LDTC fans). he HDTC fans had a complex depositional evolution, with four observed evolutionary steps, characterized by the self-channelizing pro-cess. he LDTC fans had a more smooth morphology than HDTC fans, presenting two smooth relief features in less elongated fans and a simple depositional evolution, with no distinct evolutionary steps or any self-channelizing processes.
High-density lows (more viscous) have more sediment transport capacity than low-density lows (less viscous) when they keep their rheological (Newtonian) and turbulent behaviour along the system (Baas et al. 2004, Manica 2009, Manica 2012, Talling et al. 2012). his is a key point in sup-port of the higher L/W ratio of the HDTC fans in relation to LDTC fans. he simulated turbidity currents generated in the HDTC series transport more sediment in the downlow direction, generating more elongated fans than the LDTC series. Moreover, the HDTC fans and the LDTCEx presented diferent area and length, although both had similar bulk vol-ume. HDTC fans had higher area and length than LDTCEx fan, suggesting that the simulated HDTC bypass more sed-iment to the distal regions in the tank than the low-density lows, which spread over a greater area. Additionally, the posi-tion of the distal fan centroids and the lower fan gradient of HDTC fans compared to the LDTC fans suggest a more progradational and less aggradational evolutionary behavior of the HDTC fans in relation to LDTC fans.
In addition, the lows with high sediment concentration had three times higher sediment input rate compared to the LDTC series. hus, the larger sediment input rate of the HDTC experiments suggests a high demand for the self-adjustment of the system to accommodate these sediments in the tank during the experiments. his may explain the complex depositional evolution and the morphological features of the HDTC fans in relation to the LDTC fans. On the other hand, LDTC fans were generated by lower sediment input rates and, therefore, an easier accommodation of the sediment in the tank bottom, generating a simple depositional evolution and morphology.
Figure 16. Morphological comparison among the simulated high-density turbidity currents lobes and natural depositional lobes.
Fan 3, Karoo basin
HDTC lobes Amazon fanCongo fan
Golo fan Niger fan Kutai basin
A
v
erage of lobes L/W ratio 4
3
2
1
2.0 2.2 2.0
3.6
Another key point to inluence the disparity between HDTC and LDTC fans morphology and depositional evolution may be the bulk volume of the simulated fans. HDTC fans volume was three times greater than LDTC fans, one of the causes of the diferences between the two
exper-imental series. However, the fan generated in the LDTCEx
had the same bulk volume of the HDTC fans and presented similar morphological (L/W ratio, centroid coordinates and smooth circular fan shape deposit), in addition to similar evolutionary behavior to all simulated LDTC fans of exper-imental series. Furthermore, the modern deep-water fan of
the LDTC series fans and LDTCEx fan were similar to the
Magdalena Fan. One efect observed was the higher
dimen-sions of the LDTCEx fan, such as length, width and area,
compared to LDTC fans. herefore, the sediment volume was not the cause of the diferent morphological and evolu-tionary behaviors.
Autogenic controls on the
simulated deep-water fans morphology
Autogenic inluence over the simulated fans morphology is discussed from the statistical analysis of the geometrical parameters and topography. Based on the RSD and S, simu-lated HDTC and LDTC fans had a considerable variability of their geometrical parameters and topography. hese oscil-lations were higher than expected, even considering the low variance of the experimental input parameters in both experimental series. he geometric parameters with higher than expected oscillation in the HDTC fans were length,L/W ratio, centroid Y coordinate and area (Fig. 17), while in the LDTC fans they were width, L/W ratio, centroid Y coordinate and area oscillated more than the input param-eters. In addition, topographic surface presented great S in both series. hus, these over-variations suggest that auto-genic (intrinsic) controls had inluence in the simulated fans morphology. his inluence was attributed to the self-or-ganizing property of sedimentary systems, which tend to adjust for a more eicient energy condition (Catuneanu et al. 2009). herefore, in each experiment, a determinate self-adjust condition may have occurred, resulting in difer-ent geometrical and morphological behaviour.
To investigate how the self-organization acted in the fans construction, it was investigated the morphological units of the HDTC fans and related to their depositional evolution. HDTC fans had a more well-developed morphological units and depositional evolution steps than the simulated LDTC fans and, therefore, led to a clear analysis of the autogenic inluence. he geometrical analysis of the lobe complexes showed two groups in HDTC fans, which difer in terms
of L/W ratio, area and A factor. Group I presented lower
L/W ratios (<1), lower areas and lower A factor than group
II, which had higher L/W ratios (>1), areas and A factor.
he depositional lobes of the two groups also difered in terms of length and width; the lobes of group II had a ten-dency to be larger than lobes of group I. hese four aspects —
L/W ratio, lobe complex area, A factor and lobes
dimen-sions — suggest that the HDTC fans of group II were more eicient in sediment bypassing to distal regions of the tank than group I HDTC fans, creating larger lobe complexes.
his more eicient sediment bypassing of group II was
attributed to the greater depth of the late stage conining
channel as compared to group I. Figure 18 compares the channel depth of a group II fan which had the maximum A factor and lobe complex area (H9) and the group I fan which had the minimum A factor and lobe complex area (H4). he channel of the H9 fan (Figs. 18A and 18B) was two times deeper and wider than H4 fan (Figs. 18C and 18D), suggesting a better low coninement in group II fans through the upper and middle fan to distal regions of the tank relative to group I fans. his more eicient low coninement indicates a lower tendency of channel ill and lateral low avulsion, leading the turbidity current to trans-port a higher quantity of sediments to distal regions in the tank and, consequently, creating larger lobe complexes and lobes. H10 fan channel (Figs. 18E and 18F) was shallower compared with H9 and H4 fans and did not generate lobe complex. herefore, the lobe complexes and lobe dimensions were directly associated with their channel depths which, in turn, were related with the self-channelizing process observed in the HDTC fans depositional evolution. Moreover, this Geometric parameters of fans
Length Width L/W ratio
Area
X Y
Centroid coordinates
Q Cvol D50
HDTC series LDTC series 10
8
6
4
2
0
RSD (%)
Input parameters
RSD: relative standard deviation.
Figure 18. Channel geometry of H9 (A, B), H4 (C, D) and H10 (E, F) fans. The sections analysed were chosen
from visual analysis of the best developed channel morphology on the fan topographical surfaces. Note that the
deepest channel was on the H9 fan, the same fan which presented de highest lobe complex area, while H4 fan had the lowest lobe complex area and shallower channel than H9 fan. H10 fan had the shallowest channel and
did not generate lobe complex.
8
10A A’
0 200 400 600 800
4 6
0 2
Elevation (mm)
Transversal section – X axis (mm)
8
10A A’
0 200 400 600 800
4 6
0 2
Elevation (mm)
Transversal section – X axis (mm)
8
10A A’
0 200 400 600 800
4 6
0 2
Elevation (mm)
Transversal section – X axis (mm) 1,2 mm
184 mm
0,6 mm
90 mm
0,4 mm
131 mm Y = 630 mm
Y = 660 mm
Y = 513 mm
A B
C D
E F
self-channelizing process was interpreted as a way of self-or-ganizing of the simulated deep-water fans systems, demon-strating an efective autogenic control on the depositional process of the experiments.
Previous works (Jerolmack & Paola 2010, Hajek et al.
2010, Wang et al. 2011, Straub &Wang 2013) focused on
the inluence of autogenic depositional controls, in terms of
could build deposits with diferent geometrical dimensions, morphological features and depositional evolution. hus, we interpret from our results that the autogenic controls created stochastic depositional results can be mistaken for the results generated by events in which allogenic controls (oscillating boundary conditions) dominate. his is observed both in architectural elements scale, evidenced by the high statistical variation of the lobe complexes, and in their depositional lobes dimensions (groups I and II), as in the depositional system scale, evidenced by the high RSD for the geometrical dimensions and topography of the simulated fans.
he signiicance of these variations was interpreted by extrapolating the geometrical diferences presented by the simulated HDTC and LDTC fans to their respective mod-ern analogous. For that, the diference between maximum and minimum simulated fan length and area of the two experimental series were applied to the length and area of their deep-water fan analogous. he diference between the maximum and minimum HDTC fans length (H9 fan and H2 fan) was 22% (approximately ¼), which in the Delgada Fan corresponds to 77 km. he maximum and minimum area (H5 fan and H6 fan) was 26%, representing 13 × 103 km2.
In simulated LDTC fans, the diference between the max-imum and minmax-imum length (L5-L7 fans and L9 fan) was 7%, representing 21 km in Magdalena Fan. he maximum and minimum areas (L2-L9 fans and L3 fan) were 19% and represent 10 × 103 km2. Based on this extrapolation,
diferences in the order of tens of kilometres for the fan length and tens of thousands of kilometres for the fan area were observed in both modern analogues. It highlights the potential of the autogenic controls to inluence the modern deep-water fans morphology.
Moreover, according to Prélat et al. (2010), depositional lobes dimensions are controlled by autogenesis, because their dimensions, particularly volume, are similar in the six deep-water fans studied, with diferent sediment supply characteristics. On the other hand, it was found that lobe dimensions had a large variation of their dimensions and shape, in terms of length, width and L/W ratio in systems with the same sediment supply characteristics, suggesting a dimension and shape stochastic behaviour of the depo-sitional lobes.
CONCLUSIONS
his study led to the following conclusions:
■ Autogenic controls inluenced a stochastic morpho-logical behaviour of the simulated fans of the two experimental series, as well in depositional element scale. It is evidenced by the disparity between HDTC
lobes dimensions (length, width and L/W ratio) and lobe complexes dimensions (length, width, L/W ratio, area and A factor). It is comparable to deposi-tional system scale, as observed by the diferences in the simulated HDTC fans dimensions (length, L/W ratio, centroid Y coordinate and area) and LDTC fans dimensions (width, L/W ratio, centroid Y coordinate and area). herefore, from our experimental results, we conclude that the autogenic controls create sto-chastic depositional results which may be confused with results generated by systems in which allogenic controls (oscillating boundary conditions) dominate the depositional processes;
■ Sediment volumetric concentration inluenced the
characteristics of the simulated fans morphology. More concentrated lows (HDTC series — Cvol 15%) generated more elongated, widespread, longer and lower gradient fans than less concentrated lows (LDTC series — Cvol 5%). Also, simulated high-density tur-bidity currents generated more progradational and less aggradational depositional evolution than simulated low-density currents. he hypothesis of the suspen-sion bulk volume to inluence morphological char-acteristics does not support the diferences presented between HDTC and LDTC fans. It is evidenced in the morphology and depositional evolution of LDTCEx fan (same bulk volume of HDTC fans), which had the same L/W ratio, smooth-circular shape and more aggradational depositional evolution fan than LDTC fans. he bulk volume of the suspension inluenced the fan dimensions, so LDTCEx fan had higher length, width and area than LDTC fans;
■ Simulated HDTC fans showed satisfactory analogy with Delgada Fan (California borderland, USA) in terms of L/W ratio and sedimentological characteristics (dominated by HDTC). he simulated LDTC fans and LDTCEx fan presented similarities with Magdalena Fan (Caribbean Sea, Colombia). Depositional lobes of HDTC fans also presented shape similarities, in terms of L/W ratio aver-ages, with lobes of several deep-water fans around the world. herefore, the unreasonable efectiveness of the simulated fans reached a satisfactory degree, support-ing the experimental results extrapolation to modern deep-water systems.