ACPD
9, 6957–6977, 2009Contrasting monsoon study
R. L. Bhawar and P. C. S. Devara
Title Page
Abstract Introduction
Conclusions References
Tables Figures
◭ ◮
◭ ◮
Back Close
Full Screen / Esc
Printer-friendly Version
Interactive Discussion
Atmos. Chem. Phys. Discuss., 9, 6957–6977, 2009 www.atmos-chem-phys-discuss.net/9/6957/2009/ © Author(s) 2009. This work is distributed under the Creative Commons Attribution 3.0 License.
Atmospheric Chemistry and Physics Discussions
This discussion paper is/has been under review for the journalAtmospheric Chemistry
and Physics (ACP). Please refer to the corresponding final paper inACPif available.
Study of successive contrasting
monsoons (2001–2002) in terms of
aerosol variability over a tropical station
Pune, India
R. L. Bhawar1and P. C. S. Devara2
1
DIFA, Universit `a degli Studi della Basilicata, Viale dell’Ateneo Lucano no. 10, 85100 Potenza, Italy
2
Indian Institute of Tropical Meteorology, Dr. Homi Bhabha Road, Pashan, Pune, Maharastra 411 008, India
Received: 1 December 2008 – Accepted: 4 February 2009 – Published: 16 March 2009
Correspondence to: R. L. Bhawar ([email protected])
ACPD
9, 6957–6977, 2009Contrasting monsoon study
R. L. Bhawar and P. C. S. Devara
Title Page
Abstract Introduction
Conclusions References
Tables Figures
◭ ◮
◭ ◮
Back Close
Full Screen / Esc
Printer-friendly Version
Interactive Discussion
Abstract
The present study confirms that aerosols play a major role in cloud formation and affect significantly the precipitation over a regional scale. The study here shows that there is a high variability of aerosol index during a bad monsoon year 2002 indicating an extension of cycle to more than 100 days from a normal 50 day cycle of absorbing and 5
non- absorbing aerosols over a tropical urban station Pune. Pre-monsoon 2002 shows a high loading of coarse mode aerosols (absorbing aerosols) which indicates vertical and horizontal temperature variations in turn affecting the seasonal rainfall at a regional scale. Cloud formation highly depends on aerosol concentration, where surface mete-orological features are essential to initiate the process. The surface temperatures were 10
high during the pre-monsoon of 2002 as compared to 2001. The effect of wind speed
though, complicated to understand, reveal low values in 2002 with high aerosol optical depth and vice versa in 2001.
1 Introduction
The Indian summer monsoon rainfall (ISMR), defined as the cumulative rainfall over 15
continental India during June-July-August (JJA), having important implications for the socio-economic system of the subcontinent. The JJA rainfall in 2002 was only about 78% of the seasonal average (679.2 mm, for the period 1871–2002) (Parthasarathy et al., 1995). This affected the agricultural system by almost a 40% drop in ground-nut production according to Agricultural Journal (http://www.agjournalonline.com) and 20
a 13% reduction in rice production according to the Food and Agriculture Organization of the United Nations (http://www.fao.org). This is one of the highest deficit monsoon rainfall years in the last hundred years.
The tiny particles suspended in the atmosphere known as aerosols play a major
role in the cloud formation processes. Aerosols originate from a variety of
natu-25
ACPD
9, 6957–6977, 2009Contrasting monsoon study
R. L. Bhawar and P. C. S. Devara
Title Page
Abstract Introduction
Conclusions References
Tables Figures
◭ ◮
◭ ◮
Back Close
Full Screen / Esc
Printer-friendly Version
Interactive Discussion
time. They increase the back-scattering of incoming solar radiation and thereby cause surface cooling while absorbing the infrared radiation emitted from the surface and hence results in surface warming. Natural aerosols generally lead to cooling while man-made/anthropogenic aerosols cause warming. Twomey (1977) described that aerosols act as Cloud Condensation Nuclei (CCN) or Ice Nuclei (IN). Their surfaces 5
have the property of wet-ability as they alter the droplet size spectrum, which influ-ences the amount and distribution of precipitation. Clouds and precipitation have long been recognized as important sinks for atmospheric aerosol, with size and solubility-induced selective removal affecting both the aerosol size distribution and chemical na-ture of the aerosol population (Junge, 1963). Connections between the aerosol conver-10
sion/removal processes and precipitation have been studied by numerous investigators (e.g., Changnon, 1980). Perhaps the first to be recognized (and received the most at-tention) is the albedo or “Twomey” effect – the increase in cloud albedo which in turn is due to an increase in aerosol concentration. For a dynamic forcing that creates a cloud with a given vertical extent and liquid water content, an increase in aerosol concen-15
tration going into the cloud can result in the formation of a larger number of smaller droplets as compared to an unperturbed cloud. The end result is an increase in cloud albedo (Twomey, 1974, 1977a).
Although the main component of atmospheric aerosol that is responsible for the gen-eration and maintenance of the hydrological cycle is not yet clear, it is evident that 20
aerosols are effective agents and hence, reliable data as well as, systematic study is needed to understand these complex processes (Devara et al., 2003). Each cloud drop requires an aerosol particle for water vapour to condense upon; clouds could not form otherwise. Moreover, the aerosol optical depth is a measure of radiative forcing at all time and spatial scales, and its mean value at a given location is highly dependent 25
ac-ACPD
9, 6957–6977, 2009Contrasting monsoon study
R. L. Bhawar and P. C. S. Devara
Title Page
Abstract Introduction
Conclusions References
Tables Figures
◭ ◮
◭ ◮
Back Close
Full Screen / Esc
Printer-friendly Version
Interactive Discussion
quired over Pune (Devara et al., 1994). Thus till present, aerosols mostly have been considered as a problem of climate change which reduces the global warming by their radiative properties, and in air-chemistry by intensifying the pollution and having pos-sible impacts on clouds and rainfall. Effects of aerosols on atmospheric hydrological cycle in the Asian monsoon region are also investigated by Lau et al. (2006). Anthro-5
pogenic aerosol emissions may increase cloud cover by up to 5%, resulting in a sub-stantial net cooling of Earth’s atmosphere (Breon, 2006). Aerosols affect precipitation in two ways; the presence of more aerosols leads to formation of smaller cloud droplets resulting in brighter clouds that reflect more solar energy back into space which is the first indirect effect. While numerous smaller cloud droplets tend to reduce precipitation 10
and change the extent of cloud cover (Rosenfeld, 2000).
The contrasting monsoon year is a good opportunity to study the various phenom-ena involved in monsoon dynamics. In the present study, the importance and behavior of aerosols during two consecutive years of active and weak monsoon activity has been highlighted. The focus will be in terms of aerosol composition, optical and phys-15
ical properties, derived from coincident ground-based multi-filter solar radiometer and satellite-borne measurements over a tropical urban station Pune and meteorological conditions.
2 Data deduction
The data used in the present study comprise of a MICROTOPS-II solar radiometer 20
(MTP)-observed aerosol optical depth, Total Ozone Mapping Spectrometer (TOMS)-derived aerosol index (AI) and concurrent meteorological parameters recorded during
two successive contrasting monsoon seasons of 2001 and 2002 over Pune (18.32◦N,
73.51◦
E, 559 m AMSL), India. The cloud effective radius and cloud optical depth de-rived from MODIS sensor also has been utilized to study the indirect effect of aerosols. 25
ACPD
9, 6957–6977, 2009Contrasting monsoon study
R. L. Bhawar and P. C. S. Devara
Title Page
Abstract Introduction
Conclusions References
Tables Figures
◭ ◮
◭ ◮
Back Close
Full Screen / Esc
Printer-friendly Version
Interactive Discussion
columnar: aerosol optical depth (AOD), ozone (TCO) and precipitable water content (TWC) (Morys et al., 2001; Devara et al., 2001). It measures the extinction of solar ra-diation through atmosphere by aerosols against the incident solar rara-diation and gives AOD at 380, 440, 500, 675, 870 and 1020 nm. The MICROTOPS-II-derived AODs at different wavelengths were utilized to calculate the size index (ν) parameter and aerosol 5
loading over the station. The satellite based TOMS sensor has been flown aboard since 1978 on various platforms for monitoring global TCO by studying both incoming solar radiation and back-scattered radiation in the UV-region. Space-borne sensors provide a good temporal and spatial coverage. As suggested by Herman et al. (1997) TOMS data also can be used to derive Aerosol Index (AI).
10
AI=−100[log10(I331/I360)meas−log10(I331/I360)cal]
Where, Imeas is the measured back-scattered radiance andIcal is the calculated radi-ance for a pure Rayleigh atmosphere. The positive AI represents absorbing aerosols while negative AI corresponds to less-absorbing or non-absorbing aerosols. TOMS used the radiance in UV wavelengths as it is advantageous to characterize aerosols 15
over all surface types. MODIS (MODerate resolution Imaging Spectroradiometer) was flown on Terra and Aqua platforms in 1999 and 2002, respectively. It monitors the Earth in 36 discrete bands with a high spatial resolution of 250 m, 500 m and 1 km in different bands. The cloud effective radius derived from MODIS is considered to strengthen the quantification of the aerosol effect on cloud cover (Kaufman et al., 1997).
20
3 Discussion
In addition to the time series of AI for the entire year, both TOMS and MICROTOPS-II
data are also grouped under different months and seasons separately for each year.
The behavior of optical and physical properties of aerosols in conjunction with concur-rent meteorological parameters during 2001 and 2002 is discussed in the sub-sections 25
ACPD
9, 6957–6977, 2009Contrasting monsoon study
R. L. Bhawar and P. C. S. Devara
Title Page
Abstract Introduction
Conclusions References
Tables Figures
◭ ◮
◭ ◮
Back Close
Full Screen / Esc
Printer-friendly Version
Interactive Discussion
4 Variations in aerosol composition
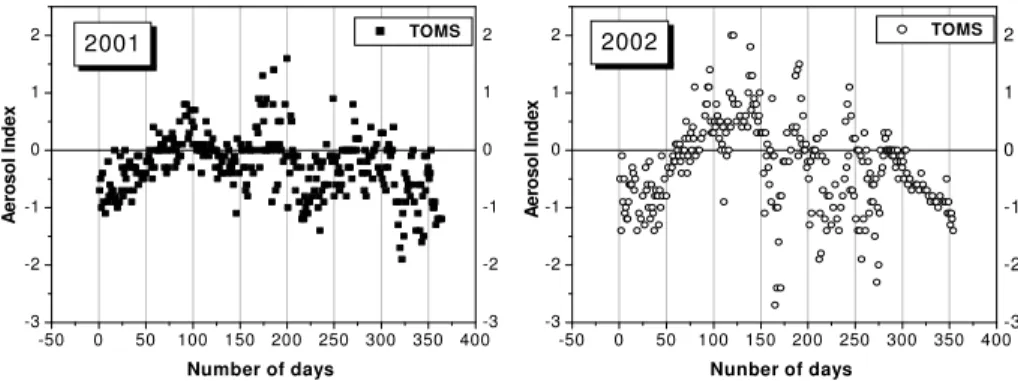
Figure 1 illustrates the time evolution of AI over Pune, a fast growing urban station, during 2001 and 2002. The variations in AI exhibit, by and large, bell-shape with maxi-mum (positive AI) during the pre-monsoon and minimaxi-mum (negative AI) during the winter months for both the years. Broadly, the plot clearly shows the dominance of absorb-5
ing aerosols during the pre-monsoon and less- or non-absorbing aerosols during win-ter. The negative values indicate the non-absorbing aerosols (such as sulphate and sea salt) while positive values indicate absorbing aerosols (such as mineral dust and smoke), and the near-zero values of AI are due to presence of clouds. In 2001 (50 day oscillation) the variation starts with non-absorbing aerosols in winter followed by ab-10
sorbing aerosols during summer, while in monsoon it has a mixed type of situation with near-zero values indicating mostly the presence of clouds. But for 2002 three promi-nent cycles each of more than 100 days are observed; it starts with non-absorbing switching to more absorbing aerosols and back to non-absorbing aerosols. The pres-ence of absorbing aerosols in summer months over Pune is mostly due to the trans-15
port phenomenon from the semi-arid region (Pandithurai et al., 2004). The absorbing aerosols cause the vertical and horizontal temperature variations during pre-monsoon season, which in turn alter seasonal rainfall over the particular region. They also tend to suppress precipitation under certain meteorological conditions. The dust events lead to enhanced heating rates in the lower troposphere (Pandithurai et al., 2008). More-20
over, most important feature that can be seen in the figure is that the variation in AI is significantly large in the year 2002 (drought) as compared to that in 2001 (active monsoon). In order to examine the size distribution of aerosols in 2001 and 2002 the
ACPD
9, 6957–6977, 2009Contrasting monsoon study
R. L. Bhawar and P. C. S. Devara
Title Page
Abstract Introduction
Conclusions References
Tables Figures
◭ ◮
◭ ◮
Back Close
Full Screen / Esc
Printer-friendly Version
Interactive Discussion
5 Variations in aerosol size distribution
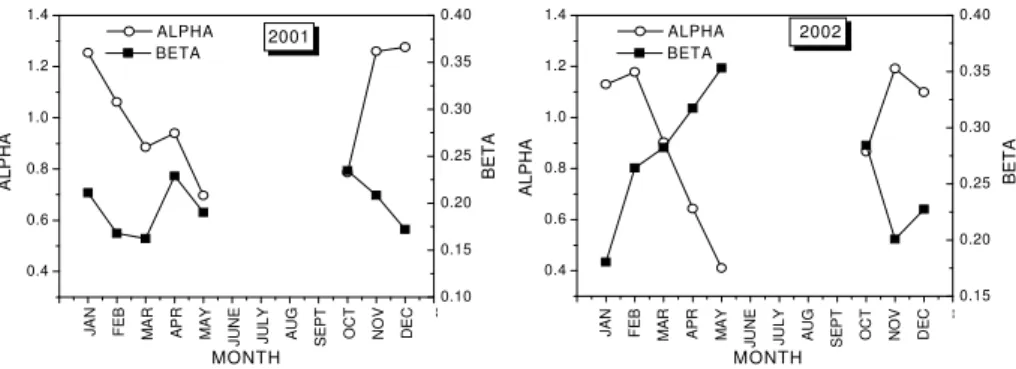
Monthly mean values ofα andβobtained from the relation,τ=βλ−α, whereα is wave-length exponent, while β is Angstrom coefficient are seen plotted in Fig. 2 for both
2001 and 2002. The α value is an indicator of size while β indicates the loading of
aerosols. The parameters α and β were calculated using the spectral distribution of
5
AOD obtained from MICROTOPS-II. The gap in the data during the monsoon months is due to unfavorable sky conditions under which MICROTOPS-II cannot give reliable data due to presence of clouds. Both plots show larger size index, (ν=α+2) values indicating greater concentration of sub-micron aerosol particles during the winter and
smallerν values suggesting coarse-mode particles during the pre-monsoon months.
10
Besides the usual behavior of aerosol loading (larger β value) during pre-monsoon
months and relatively smaller values during winter, larger values ofβ and smaller
val-ues ofα during winter as compared to the pre-monsoon months in certain years are
attributed partly due to intense haze formation resulting from trapping of local
anthro-pogenic aerosols. A significant difference is seen between 2002 and 2001. The value
15
ofαin pre-monsoon is 0.4 for 2002 as compared to 0.7 in 2001, which implies presence of more accumulation-mode particles in 2001 than in 2002 suggesting more loading of coarse-mode aerosols in 2002 than in 2001 during pre-monsoon. Thus more number of accumulation-mode particles; adequate loading of aerosol amount in atmosphere during pre-monsoon triggered a good cloud formation process in 2001 which yielded 20
a good amount of precipitation. In 2002, the situation was exactly opposite with pres-ence of coarse-mode particles and more loading of absorbing aerosols. The interesting finding is that more absorbing aerosols were present in 2002 the water vapor content was also low by almost 0.5 to 1 cm in 2002 than in 2001 obtained from MODIS satellite data. Large number of absorbing aerosols, heat the lower troposphere but cool sur-25
ACPD
9, 6957–6977, 2009Contrasting monsoon study
R. L. Bhawar and P. C. S. Devara
Title Page
Abstract Introduction
Conclusions References
Tables Figures
◭ ◮
◭ ◮
Back Close
Full Screen / Esc
Printer-friendly Version
Interactive Discussion
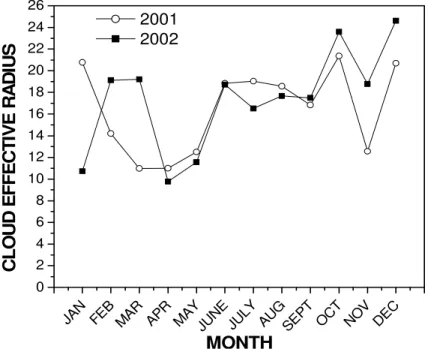
There were three epochs seen in Fig. 3. In 2001 and 2002 the CER goes on in-creasing from pre-monsoon to monsoon months as during the monsoon months the cloud formation starts, with a further decrease of CER in winter months. But the CER in 2002 during the monsoon months is less as compared to 2001 which suggests that the cloud formation was less in 2002 as opposed to 2001. Rather we can say clouds 5
formed but dissipated in less time.
It is observed at Pune, that after the onset of monsoon in June, there is more rain in July and August in the normal years and then intensity decreases in September. It is evident in the CER plot that there is a decrease in CER in 2002 for the July and August months. Larger the CER, more the size of cloud droplet and more chances for rain 10
occurrence, while less CER leads to cloud dissipation and hence less rain. Figure 4 shows monthly mean variation in cloud optical depth (COD) during 2001 and 2002. As suggested by Storelvmo et al. (2006), COD directly correlates with rainfall. In the present study, as the CER increases COD also increases and more COD results in more rainfall and vice-versa. It is distinctly seen from the Fig. 4 that in the month of 15
July, when maximum rainfall occurs in Pune COD was less in 2002 as compared to 2001 and amounts to rainfall of 118 mm in 2001 and 26 mm in 2002. As the processes responsible for these differences have an important taking, of what is going on in the regional atmosphere the local meteorological conditions are also important, which are discussed, below.
20
6 Variations in concurrent meteorological parameters
The normal weather at the experimental site during the pre-monsoon season (March, April, May) is very hot with mostly gusty surface winds and the dust content in the atmosphere is at a maximum. The air flow in the lower troposphere is predominantly westerly during the south-west (SW) monsoon season (June, July, August, Septem-25
ACPD
9, 6957–6977, 2009Contrasting monsoon study
R. L. Bhawar and P. C. S. Devara
Title Page
Abstract Introduction
Conclusions References
Tables Figures
◭ ◮
◭ ◮
Back Close
Full Screen / Esc
Printer-friendly Version
Interactive Discussion
season (December, January, and February). Low-level inversions during the morning and evening hours, and dust haze during the morning hours occur during this season (Devara et al., 2005).
The daytime diurnal variations in temperature range which is difference between
maximum and minimum temperature for the pre-monsoon, post-monsoon and winter 5
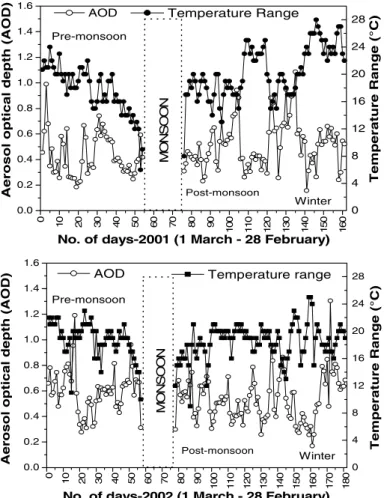
months of 2001 and 2002 are shown plotted in Fig. 5. A significant annual variation in all the above three parameters with maximum AOD in pre-monsoon months and rel-atively minimum in winter months is quite clear from the figure. The high convective activity and frequent occurrence of dust storms are responsible for the higher AODs during the pre-monsoon. Subsequently, the AOD values attain minimum due to cloud-10
scavenging and rain-washout processes during the monsoon and post-monsoon and thereafter they slowly build-up during post-monsoon and winter months (due to haze) and becomes maximum again in summer. The influence of temperature on AOD is quite clear from the figure. Normally, increase in temperature causes lifting of aerosols that effects size distribution and results in higher AOD. The variations in AOD at 380 nm 15
and concurrent surface-level temperature range for 2001 and 2002 seem to follow each other. In the 2001 plot for variations of AOD with temperature range during the
pre-monsoon there is a steep decrease in temperature from 23◦
C to 8◦
C. From the post-monsoon to winter there is again an increase in temperature from 8◦C to 28◦C. Corre-spondingly there are large AOD variations associated with temperature variations. The 20
plot for AOD and temperature range for 2002 shows a drastically different behavior.
There is very less variation in temperature range between 16◦C to 24◦C throughout
the monsoon, post-monsoon and winter. The high value of temperature in the pre-monsoon supports the presence of absorbing aerosols from the AI values of TOMS. The temperature is high during 2002 compared to 2001, and AOD also shows a rise in 25
2002 than in 2001. The data gaps during the south-west monsoon (June–September) in the plot are due to unfavourable sky conditions, and many times due to rain during that period.
pre-ACPD
9, 6957–6977, 2009Contrasting monsoon study
R. L. Bhawar and P. C. S. Devara
Title Page
Abstract Introduction
Conclusions References
Tables Figures
◭ ◮
◭ ◮
Back Close
Full Screen / Esc
Printer-friendly Version
Interactive Discussion
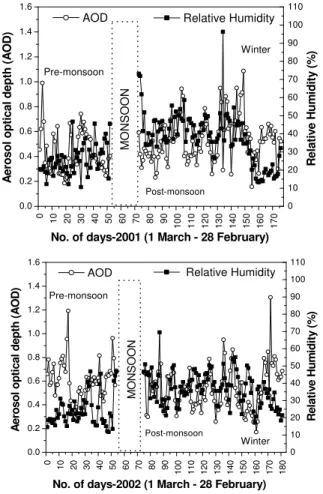
monsoon, post-monsoon and winter seasons of 2001 and 2002 are depicted in Fig. 6. Condensation of water vapor takes place on the aerosols with increasing relative hu-midity and evaporation of water vapor present on the aerosols takes place with de-creasing relative humidity. In general, increase in relative humidity leads to particle growth and an associated increase in AOD. Thus the aerosol particles grow as relative 5
humidity increases and shrink as relative humidity decreases. But the rate of growth in response to increase in relative humidity is not equal to rate of shrink in response to decrease in relative humidity.
Due to growth of particle the surface area increases and in turn reflects in high AOD. As the relative humidity increases the AOD also increase for hygroscopic aerosols, 10
which are observed mostly during March and April months of 2001. In 2001 plot, for AOD and surface relative humidity there is a rise of relative humidity from 20% to about 60% in pre-monsoon and post-monsoon while it drops down to 20% in winter. In 2002, the surface relative humidity during pre-monsoon is between 20% and 30% with a high aerosol loading, while in post-monsoon and winter it varies between 35% and 50%. 15
During winter months the relative humidity is less and AOD shows an increase which is due to the presence of haze in atmosphere.
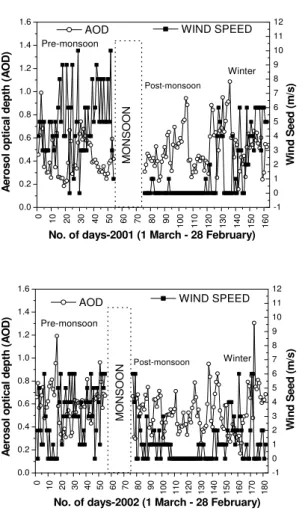
Figure 7 displays the daily mean variations in concurrent AOD and surface wind speed during pre-monsoon, post-monsoon and winter months of 2001 and 2002. The influence of wind speed on aerosol optical depth in the whole atmospheric column is 20
complex (Platt and Patterson, 1986; Villevalde et al., 1994; Smirnov et al., 1995; Moor-thy et al., 1997; Kusmierczyk-Michulec et al., 1999). The correlation between wind speed and aerosols also depends on the size of aerosols. Different wind speed affects different size of particles (Smirnov et al., 2003). Overall comparison of surface wind speed for pre-monsoon of 2001 and 2002 shows higher surface wind speed values in 25
ACPD
9, 6957–6977, 2009Contrasting monsoon study
R. L. Bhawar and P. C. S. Devara
Title Page
Abstract Introduction
Conclusions References
Tables Figures
◭ ◮
◭ ◮
Back Close
Full Screen / Esc
Printer-friendly Version
Interactive Discussion
between aerosol concentration and wind speed are relatively high in lower altitudes, indicating that the effect of wind speed on aerosol concentration is more significant at lower altitudes (Parameshwaren et al., 1995). Whenever the wind speed is high the AOD value is low and whenever wind speed is low AOD is high. Thus high wind speed values are associated with removal of aerosols and low wind speed with addi-5
tion of aerosols in both the years. Thus compared to 2001, 2002 was associated with slightly more aerosol loading. In 2001 pre-monsoon though the surface wind speeds are high the AOD is not as high as expected which indicates the removal of aerosols from the experimental site. While in the post-monsoon and winter there is a build up of aerosol loading with low surface wind speed values indicating inflow of aerosols from 10
the neighboring areas. There is an opposite correlation between AOD and wind speed in 2002 same as seen in 2001. In 2002 pre-monsoon wind speed is not as high as it was in 2001 but AOD is high as compared to 2001. There is also high aerosol loading throughout post-monsoon and winter months.
7 Conclusions
15
The role of aerosols was considered in the hydrological cycle but not studied in detail; this study proves the importance of aerosols. The present study proves the importance of aerosols in the hydrological cycle on a regional scale over a tropical station, Pune, India. The cycle of absorbing and non- absorbing aerosols during a normal monsoon is of about 50 days but during a weak monsoon the cycle extends to over more than 100 20
days as observed from this study. Large variation in the aerosol index values during
2002 than in 2001. As estimated from the angstrom coefficient more aerosol loading
of coarse mode particles in 2002 as compared to 2001. The temperature also shows an increase in 2002 indicating warmer atmosphere due to absorbing aerosols. Thus, resulting in less CER which in turn indicated less cloud formation or early dissipation 25
of clouds and giving less precipitation.
ACPD
9, 6957–6977, 2009Contrasting monsoon study
R. L. Bhawar and P. C. S. Devara
Title Page
Abstract Introduction
Conclusions References
Tables Figures
◭ ◮
◭ ◮
Back Close
Full Screen / Esc
Printer-friendly Version
Interactive Discussion
Pune, India. Thanks are also due to the Members of the IITM Lidar and Radiation Group for their cooperation and Paolo Di Girolamo for encouraging me to submit the paper.
References
Breon, F.: How do aerosols affect cloudiness and climate?, Science, 313, 623–624, 2006.
Changnon, S. A.: More on the La Porte anomaly: a review, B. Am. Meteorol. Soc., 61, 702–711,
5
1980.
Devara, P. C. S., Raj, P. E., Sharma, S., and Pandithurai, G.: Lidar-observed long-term varia-tions in urban aerosol characteristics and their connection with meteorological parameters, Int. J. Climatol., 14, 581–591,1994.
Devara, P. C. S., Maheskumar, R. S., Raj, P. E., Dani, K. K., and Sonbawne, S. M.: Some
10
features of column aerosol optical depth, ozone and precipitable water content observed over land during the INDOEX-IFP99, Meteorol. Z., 10, 123–130, 2001.
Devara, P. C. S., Raj, P. E., Pandithurai, G., Dani, K. K., and Maheskumar, R. S.: Relation-ship between lidar-based observations of aerosol content and monsoon precipitation over a tropical station, Pune, India, Meteorol. Appl., 10, 253–262, 2003.
15
Devara, P. C. S., Saha, S. K., Raj, P. E., Sonbawne, S. M., Dani, K. K., Tiwari, Y. K., and Maheskumar, R. S.: A four-year climatology of total column tropical urban aerosol, ozone and water vapor distributions over Pune, India, Aerosol Air Qual. Res., 5, 103–114, 2005. Herman, J. R., Bhartia, P. K., Torres, O., Hsu, C., Seftor, C., and Celarier, E.: Global distribution
of UV- absorbing aerosol from Nimbus 7/TOMS data, J. Geophys. Res., 102(D14), 16911–
20
16922, 1997.
Junge, C. E.: Air Chemistry and Radioactivity, Academic Press, New York, 1963.
Kaufman, Y. J., Tanre, D., Remer, L. A., Vermote, E., Chu, A., and Holben, B. N.: Operational remote sensing of tropospheric aerosol over land from EOS moderate resolution imaging Spectroradiometer, J. Geophys. Res., 102, 17051–17067, 1997.
25
Kaufman, Y. J., Wald, A. E., Remer, L.A., Bo-Cai Gao, Rong-Rong Li, Flynn, L.: The MODIS 2.1-µm channel-correlation with visible reflectance for use in remote sensing of aerosol, IEEE T. Geosci. Remote, 35, 1286–98, 1997.
ACPD
9, 6957–6977, 2009Contrasting monsoon study
R. L. Bhawar and P. C. S. Devara
Title Page
Abstract Introduction
Conclusions References
Tables Figures
◭ ◮
◭ ◮
Back Close
Full Screen / Esc
Printer-friendly Version
Interactive Discussion
wide-field of-view sensor bands: extinction measurements in a marine summer atmosphere over the Baltic Sea, J. Geophys. Res., 104, 14293–14307, 1999.
Lau, K. M., Kim, M. K., and Kim, K. M.: Asian monsoon anomalies induced by aerosol direct
effects – the role of the Tibetan Plateau, Clim. Dynam., 26, 855-864,
doi:10.1007/s00382-006-01 14-2, 2006.
5
Moorthy, K. K., Satheesh, S. K., and Murthy, B. V. K.: Investigations of marine aerosols over the tropical Indian ocean, J. Geophys. Res., 102, 18827–18842, 1997.
Morys, M., Mims Ii, F. M., Hagerup, S., Anderson, S. E., Baker, A., and Walkup, T.: Design, cal-ibration, and performance of MICROTOPS-II handheld ozone monitor and sun photometer, J. Geophys. Res., 106, 14573–14582, 2001.
10
Pandithurai, G., Pinker, R. T., Takamura, T., and Devara, P. C. S.: Aerosol radiative forcing over an urban station in India and its comparison with INDOEX estimates, Geophys. Res. Lett., 31, L12107, doi:10.1029/2004GL019702, 2004.
Pandithurai, G., Dipu, S., Dani, K. K., Tiwari, S., Bisht, D. S., Devara, P. C. S., and Pinker, R. T.: Aerosol radiative forcing during dust events over New Delhi, India, J. Geophys. Res., 113,
15
D13209, doi:10.1029/2008JD009804, 2008.
Parameshwaran, K., Vijayakumar, G., Krishna Murthy, B. V., and Krishna Moorthy, K.: Effect
of wind speed on mixing region aerosol concentrations at a tropical coastal station, J. Appl. Meteorol., 34, 1392–1397, 1995.
Parthasarathy, B., Munot, A. A., and Kothawale, D. R.: All India monthly and seasonal rainfall
20
series: 1871–1993, Theor. Appl. Climatol., 49, 217–224, 1995.
Platt, C. M. R. and Patterson, G. R.: The interpretation of baseline atmospheric turbidity mea-surements at Cape Grim, Tasmania, J. Atmos. Chem., 4, 187–197, 1986.
Ramanathan, V., Crutzen, P. J., Lelieveld, J., et al.: Indian Ocean Experiment: An integrated
analysis of the climate forcing and effects of the great Indo-Asian haze, J. Geophys. Res.,
25
106(D22), 28371–28398, 2001.
Rosenfeld, D.: Suppression of rain and snow by urban and industrial air pollution, Science, 287, 1793–1796, 2000.
Smirnov, A., Villevalde, Y., O’Neill, N. T., Royer, A., and Tarussov, A.: Aerosol optical depth over the oceans: analysis in terms of synoptic air mass types, J. Geophys. Res., 100, 16639–
30
16650, 1995.
Smirnov, A., Holben, B. N., Eck, T. F., Dubovik, O., and Slutsker, I.: Effect of wind speed on
ACPD
9, 6957–6977, 2009Contrasting monsoon study
R. L. Bhawar and P. C. S. Devara
Title Page
Abstract Introduction
Conclusions References
Tables Figures
◭ ◮
◭ ◮
Back Close
Full Screen / Esc
Printer-friendly Version
Interactive Discussion
doi:10.1009/2003JD003879, 2003.
Storelvmo, T., Kristjansson, J. E., Ghan, S. J., Kirkevag, A., and Seland, O.: Predict-ing cloud droplet number concentration in CAM-Oslo, J. Geophys. Res., 111, D24208, doi:10.1029/2005JD006300, 2006.
Twomey, S.: Atmospheric Aerosols, Elsevier Publications, MA, USA, 1977.
5
Twomey S.: Pollution and planetary albedo, Atmos. Environ., 8, 1251–1256, 1974.
Twomey, S.: The influence of pollution on the shortwave albedo of clouds, J. Atmos. Sci., 34, 1149–1152, 1977a.
Villevalde, Y. V., Smirno, A. V., O’Neill, N. T., Smyshlyaev, S. P., and Yakavlev, V. V.: Measure-ment of aerosol optical depth in the Pacific Ocean and the North Atlantic, J. Geophys. Res.,
10
ACPD
9, 6957–6977, 2009Contrasting monsoon study
R. L. Bhawar and P. C. S. Devara
Title Page
Abstract Introduction
Conclusions References
Tables Figures
◭ ◮
◭ ◮
Back Close
Full Screen / Esc
Printer-friendly Version
Interactive Discussion -50 0 50 100 150 200 250 300 350 400
-3 -2 -1 0 1 2
-3 -2 -1 0 1 2
2001
A
e
ro
s
o
l
In
d
e
x
Number of days
TOMS
-50 0 50 100 150 200 250 300 350 400 -3
-2 -1 0 1 2
-3 -2 -1 0 1 2
2002
A
e
ro
s
o
l
In
d
e
x
Nunber of days
TOMS
ACPD
9, 6957–6977, 2009Contrasting monsoon study
R. L. Bhawar and P. C. S. Devara
Title Page Abstract Introduction Conclusions References Tables Figures ◭ ◮ ◭ ◮ Back Close
Full Screen / Esc
Printer-friendly Version Interactive Discussion J A N F E B M A R A P R M A Y J U N E J U L Y A U G S E P T O C T N O V D E C --0.4 0.6 0.8 1.0 1.2 1.4 0.10 0.15 0.20 0.25 0.30 0.35 0.40 A L P H A MONTH ALPHA 2001 B E T A BETA J A N F E B M A R A P R M A Y J U N E J U L Y A U G S E P T O C T N O V D E C --0.4 0.6 0.8 1.0 1.2 1.4 0.15 0.20 0.25 0.30 0.35 0.40 2002 B E T A A L P H A MONTH ALPHA BETA
ACPD
9, 6957–6977, 2009Contrasting monsoon study
R. L. Bhawar and P. C. S. Devara
Title Page
Abstract Introduction
Conclusions References
Tables Figures
◭ ◮
◭ ◮
Back Close
Full Screen / Esc
Printer-friendly Version
Interactive Discussion JA
N FE
B MA
R AP
R MA
Y JU
NE JU
LY AU
G SE
PT OC
T NO
V DE
C
0 2 4 6 8 10 12 14 16 18 20 22 24 26
C
L
O
U
D
E
F
F
E
C
T
IV
E
R
A
D
IU
S
MONTH
2001 2002
ACPD
9, 6957–6977, 2009Contrasting monsoon study
R. L. Bhawar and P. C. S. Devara
Title Page
Abstract Introduction
Conclusions References
Tables Figures
◭ ◮
◭ ◮
Back Close
Full Screen / Esc
Printer-friendly Version
Interactive Discussion
Jan Feb Mar Apr May Jun Jul Aug Sep Oct Nov Dec
-2 0 2 4 6 8 10 12 14 16 18 20 22 24
C
O
L
U
D
O
P
T
IC
A
L
D
E
P
T
H
MONTH 2001
2002
ACPD
9, 6957–6977, 2009Contrasting monsoon study
R. L. Bhawar and P. C. S. Devara
Title Page
Abstract Introduction
Conclusions References
Tables Figures
◭ ◮
◭ ◮
Back Close
Full Screen / Esc
Printer-friendly Version
Interactive Discussion
0 10 20 30 40 50 60 70 80 90
100 110 120 130 140 150 160
0.0 0.2 0.4 0.6 0.8 1.0 1.2 1.4 1.6
0 4 8 12 16 20 24 28
Winter
Post-monsoon
Pre-monsoon
MO
N
S
O
O
N
Temperature Range (°C)
Aerosol optical depth (AOD)
No. of days-2001 (1 March - 28 February)
AOD Temperature Range
0
10 20 30 40 50 60 70 80 90 100 110 120 130 140 150 160 170 180
0.0 0.2 0.4 0.6 0.8 1.0 1.2 1.4 1.6
0 4 8 12 16 20 24 28
Winter
Post-monsoon
Pre-monsoon
MO
N
S
O
O
N
Aerosol optical depth (AOD)
No. of days-2002 (1 March - 28 February)
Temperature Range (°C)
AOD Temperature range
ACPD
9, 6957–6977, 2009Contrasting monsoon study
R. L. Bhawar and P. C. S. Devara
Title Page Abstract Introduction Conclusions References Tables Figures ◭ ◮ ◭ ◮ Back Close
Full Screen / Esc
Printer-friendly Version Interactive Discussion 0 1 0 2 0 3 0 4 0 5 0 6 0 7 0 8 0 9 0 1 0 0 1 1 0 1 2 0 1 3 0 1 4 0 1 5 0 1 6 0 1 7 0 1 8 0 0.0 0.2 0.4 0.6 0.8 1.0 1.2 1.4 1.6 0 10 20 30 40 50 60 70 80 90 100 110 Winter Post-monsoon Pre-monsoon R e la ti v e H u m id it y ( % ) M O N S O O N
No. of days-2002 (1 March - 28 February)
A e ro s o l o p ti c a l d e p th ( A O D )
AOD Relative Humidity
0 10 20 30 40 50 60 70 80 90
1 0 0 1 1 0 1 2 0 1 3 0 1 4 0 1 5 0 1 6 0 1 7 0 0.0 0.2 0.4 0.6 0.8 1.0 1.2 1.4 1.6 0 10 20 30 40 50 60 70 80 90 100 110 M O N S O O N AOD Winter Post-monsoon Pre-monsoon A e ro s o l o p ti c a l d e p th ( A O D )
No. of days-2001 (1 March - 28 February)
R e la ti v e H u m id it y ( % ) Relative Humidity
ACPD
9, 6957–6977, 2009Contrasting monsoon study
R. L. Bhawar and P. C. S. Devara
Title Page Abstract Introduction Conclusions References Tables Figures ◭ ◮ ◭ ◮ Back Close
Full Screen / Esc
Printer-friendly Version Interactive Discussion 0 1 0 2 0 3 0 4 0 5 0 6 0 7 0 8 0 9 0 1 0 0 1 1 0 1 2 0 1 3 0 1 4 0 1 5 0 1 6 0 0.0 0.2 0.4 0.6 0.8 1.0 1.2 1.4 1.6 -1 0 1 2 3 4 5 6 7 8 9 10 11 12 Winter Post-monsoon Pre-monsoon M O N S O O N
No. of days-2001 (1 March - 28 February) AOD W in d S e e d ( m /s ) A e ro s o l o p ti c a l d e p th ( A O D ) WIND SPEED
0 10 20 30 40 50 60 70 80 90
1 0 0 1 1 0 1 2 0 1 3 0 1 4 0 1 5 0 1 6 0 1 7 0 1 8 0 0.0 0.2 0.4 0.6 0.8 1.0 1.2 1.4 1.6 -1 0 1 2 3 4 5 6 7 8 9 10 11 12 Winter Post-monsoon Pre-monsoon M O N S O O N A e ro s o l o p ti c a l d e p th ( A O D )
No. of days-2002 (1 March - 28 February)
W in d S e e d ( m /s )
AOD WIND SPEED