ACPD
5, 12775–12814, 2005Transient evolution of the global aerosol system from 1860 to
2100
P. Stier et al.
Title Page
Abstract Introduction
Conclusions References
Tables Figures
◭ ◮
◭ ◮
Back Close
Full Screen / Esc
Print Version Interactive Discussion
EGU
Atmos. Chem. Phys. Discuss., 5, 12775–12814, 2005 www.atmos-chem-phys.org/acpd/5/12775/
SRef-ID: 1680-7375/acpd/2005-5-12775 European Geosciences Union
Atmospheric Chemistry and Physics Discussions
The evolution of the global aerosol
system in a transient climate simulation
from 1860 to 2100
P. Stier1,*, J. Feichter1, E. Roeckner1, S. Kloster1, and M. Esch1
1
The Atmosphere in the Earth System, Max Planck Institute for Meteorology, Hamburg, Germany
*
now at: Environmental Science and Engineering, California Institute of Technology, Pasadena, USA
Received: 4 November 2005 – Accepted: 17 November 2005 – Published: 14 December 2005 Correspondence to: P. Stier ([email protected])
ACPD
5, 12775–12814, 2005Transient evolution of the global aerosol system from 1860 to
2100
P. Stier et al.
Title Page
Abstract Introduction
Conclusions References
Tables Figures
◭ ◮
◭ ◮
Back Close
Full Screen / Esc
Print Version Interactive Discussion
EGU
Abstract
The evolution of the global aerosol system from 1860 to 2100 is investigated through a transient atmosphere-ocean General Circulation Model climate simulation with in-teractively coupled atmospheric aerosol and oceanic biogeochemistry modules. The microphysical aerosol module HAM incorporates the major global aerosol cycles with
5
prognostic treatment of their composition, size-distribution, and mixing state. Based on an SRES A1B emission scenario, the global mean sulfate burden is projected to peak in 2020 while black carbon and particulate organic matter show a lagged peak around 2070. From present day to future conditions the anthropogenic aerosol burden shifts generally from the northern high-latitudes to the developing low-latitude source regions
10
with impacts on regional climate. Atmospheric residence- and aging-times show sig-nificant alterations under varying climatic and pollution conditions. Concurrently, the aerosol mixing-state changes with an increasing aerosol mass fraction residing in the internally mixed accumulation mode. The associated increase in black carbon causes a more than threefold increase of its co-single scattering albedo from 1860 to 2100.
Mid-15
visible aerosol optical depth increases from pre-industrial times, predominantly from the aerosol fine fraction, peaks at 0.26 around the sulfate peak in 2020 and maintains a high level thereafter, due to the continuing increase in carbonaceous aerosols. The global mean anthropogenic top of the atmosphere clear-sky short-wave direct aerosol
radiative perturbation intensifies to−1.1 W m−2around 2020 and weakens after 2050
20
to−0.6 W m−2, owing to an increase in atmospheric absorption. The demonstrated
ACPD
5, 12775–12814, 2005Transient evolution of the global aerosol system from 1860 to
2100
P. Stier et al.
Title Page
Abstract Introduction
Conclusions References
Tables Figures
◭ ◮
◭ ◮
Back Close
Full Screen / Esc
Print Version Interactive Discussion
EGU
1. Introduction
The importance of atmospheric aerosols for the earth system has become well estab-lished. Aerosol particles influence the global radiation budget directly, by scattering and absorption (Angstr ¨om˚ , 1962; McCormic and Ludwig, 1967) as well as indirectly by the modification of cloud properties (Twomey,1974;Graßl,1975;Twomey,1977;
5
Albrecht,1989;Hansen et al.,1997;Lohmann,2002), with feedbacks to the hydrolog-ical cycle (Roeckner et al., 1999; Liepert et al., 2004). In addition, aerosols link the biogeochemical cycles of the atmosphere, the ocean, and the land surfaces acting as micro-nutrients for the marine (Martin and Fitzwater,1988;Johnson et al.,1997) and terrestrial (Swap et al.,1992;Okin et al.,2004) biosphere. However, aerosol deposition
10
can also have detrimental environmental effects, such as acidification with impacts on
aquatic and terrestrial ecosystems (e.g.Likens and Bohrmann,1974).
Assessments of the role of aerosols in the earth system and in particular of their climatic impact require the knowledge of the state of the global aerosol system for past and present conditions as well as for future scenarios.
15
However, while observations provide a wide range of information about the present day global aerosol system, they are not sufficient for an assessment of the aerosol cli-matic effects. Direct observations of the global aerosol system provide detailed insights into the aerosol system, but are representative of limited spatial and temporal scales. Remote sensing data from ground-based lidar and sun-photometers provides valuable
20
information but suffers from similar sampling issues. Up to now, operational remote
sensing data from space only provides integral aerosol properties and the retrievals rely on a-priori information about the aerosol system and internal aerosol models. While present-day satellite observations allow estimates of the total aerosol radiative effects
over the oceans (e.g.Zhang et al.,2005), fundamental assumptions have to be made
25
ACPD
5, 12775–12814, 2005Transient evolution of the global aerosol system from 1860 to
2100
P. Stier et al.
Title Page
Abstract Introduction
Conclusions References
Tables Figures
◭ ◮
◭ ◮
Back Close
Full Screen / Esc
Print Version Interactive Discussion
EGU
(Christopher and Zhang,2004).
Global aerosol models can contribute to increase the understanding about the com-plex global aerosol system for past, present, and future conditions. Furthermore, they permit to identify the effects of specific aerosol components and aerosol sources, nat-ural or anthropogenic, on the global climate system.
5
In early transient coupled atmosphere-ocean global circulation model (AOGCM) cli-mate simulations, the radiative impact of aerosols has been neglected. Later, some aerosol components or their radiative properties have been prescribed from aerosol climatologies (Tanre et al.,1984;Koepke et al.,1997) in century scale AOGCM simula-tions (e.g.Roeckner et al.,1992). Prognostic sulfur cycle schemes have been added to
10
some more recent simulations, mainly with atmospheric GCMs coupled to mixed layer oceans (e.g.Kiehl et al.,2000). The consideration of prognostic sulfur cycle schemes
in coupled AOGCM climate simulations remains the exception (Roeckner et al.,1999;
Johns et al., 2003). However, the importance of other anthropogenic aerosol com-ponents, in particular of carbonaceous aerosols, has received considerable attention
15
(e.g.Penner et al.,2001;Menon et al.,2002;Jacobson, 2002) and their relative im-portance is projected to increase according to recent emission scenarios (e.g. SRES: Nakicenovic et al., 2000). While, according to the widely used SRES A1B scenario,
anthropogenic SO2emissions, as the main sulfate precursor, are projected to peak in
the year 2020, the emissions of the carbonaceous aerosols are expected to increase
20
up to the year 2100. Therefore, the limitation to sulfate aerosols in most previous tran-sient AOGCM climate simulations is likely to draw an incomplete picture, in particular with respect to future climate projections.
Here we present results from a transient climate simulation from 1860 to 2100 with an evolving earth system model consisting of interactively coupled atmosphere and ocean
25
GCMs with embedded atmospheric aerosol cycles and ocean biogeochemistry. In ad-dition to the traad-ditional physical coupling of the atmosphere and ocean models, also the atmospheric and oceanic biogeochemical cycles are coupled interactively. The
ACPD
5, 12775–12814, 2005Transient evolution of the global aerosol system from 1860 to
2100
P. Stier et al.
Title Page
Abstract Introduction
Conclusions References
Tables Figures
◭ ◮
◭ ◮
Back Close
Full Screen / Esc
Print Version Interactive Discussion
EGU
of the major global aerosol components with prognostic treatment of their microphysi-cal state and interactions. The aerosol components considered are sulfate (SU), black carbon (BC), particulate organic matter (POM), sea salt (SS), and mineral dust (DU). Aerosol composition, size-distribution, and mixing-state are prognostic. Natural emis-sions of mineral dust, sea salt, and dimethyl-sulfide (DMS) are calculated interactively.
5
Anthropogenic aerosol and aerosol-precursor emissions are prescribed based on the SRES A1B scenario.
The focus of this study is to analyse the transient evolution of the simulated global aerosol system from 1860 to 2100. Other aspects of the results, such as the regional
climate impact of carbonaceous aerosols (Roeckner et al., 20051; henceforth: R2005)
10
or the interactive DMS cycle (Kloster et al., 20052; henceforth: K2005), are addressed in accompanying publications.
Section2describes the setup of the earth system model. The analysis of the
simu-lated aerosol evolution from 1860 to 2100 is presented in Sect.3. Section4concludes
the discussion.
15
2. Model description
In this study, we use a sub-model of the emerging Max Planck Institute – Earth Sys-tem Model (MPI-ESM), consisting of the following interactively coupled models: the
atmospheric general circulation model ECHAM5 (Roeckner et al., 2003), the ocean
general circulation model MPI-OM (Marsland et al., 2003), the atmospheric aerosol
20
module HAM (Stier et al.,2005a), and the ocean biogeochemistry module HAMOCC5
1
Roeckner, E., Stier, P., Feichter, J., Kloster, S., and Esch, M.: Impact of carbonaceous aerosol forcing on regional climate change, Max Planck Institute for Meteorology, Hamburg, Germany, submitted, 2005.
2
ACPD
5, 12775–12814, 2005Transient evolution of the global aerosol system from 1860 to
2100
P. Stier et al.
Title Page
Abstract Introduction
Conclusions References
Tables Figures
◭ ◮
◭ ◮
Back Close
Full Screen / Esc
Print Version Interactive Discussion
EGU
(Maier-Reimer et al.,2005). The atmospheric and oceanic biogeochemical cycles are coupled by accounting for deposition of mineral dust and subsequent iron dissolution as micro-nutrient for the ocean biogeochemistry and by emitting DMS produced by phytoplankton from the ocean surface to the atmosphere. A detailed description and
evaluation of the coupled ECHAM5 – HAM system is given inStier et al.(2005a) and
5
the coupled ECHAM5 – HAM – MPI-OM – HAMOCC5 system is evaluated inKloster
et al. (2005).
2.1. The atmosphere GCM ECHAM5
The atmospheric GCM ECHAM5 (Roeckner et al.,2003) is the fifth-generation climate
model developed at the Max Planck Institute for Meteorology. ECHAM5 solves
prog-10
nostic equations for vorticity, divergence, surface pressure and temperature expressed in terms of spherical harmonics with a triangular truncation. Non-linear processes and the physical parameterisations are solved on a corresponding Gaussian grid. Water vapour, cloud liquid water, cloud ice and trace components are transported in
grid-point space with a flux form semi-Lagrangian transport scheme (Lin and Rood,1996).
15
ECHAM5 contains a microphysical cloud scheme (Lohmann and Roeckner,1996) with
prognostic equations for cloud liquid water and ice. Cloud cover is predicted with a prognostic-statistical scheme solving equations for the distribution moments of total
water (Tompkins,2002). Convective clouds and convective transport are based on the
mass-flux scheme ofTiedtke (1989) with modifications byNordeng(1994). The solar
20
radiation scheme (Fouquart and Bonnel,1980) has 4 spectral bands, 1 for the visible
and ultra-violet, and 3 for the near-infrared. The long-wave radiation scheme (Mlawer
et al.,1997;Morcrette et al.,1998) has 16 spectral bands. A resolution of horizontally
T63 (corresponding to 1.8◦) with 19 vertical levels has been applied in the coupled
model setup.
ACPD
5, 12775–12814, 2005Transient evolution of the global aerosol system from 1860 to
2100
P. Stier et al.
Title Page
Abstract Introduction
Conclusions References
Tables Figures
◭ ◮
◭ ◮
Back Close
Full Screen / Esc
Print Version Interactive Discussion
EGU
2.2. The aerosol module HAM
The microphysical aerosol module HAM (Stier et al.,2005a) predicts the evolution of
an ensemble of seven interacting internally- and externally-mixed log-normal aerosol modes. In the current setup, the components sulfate, black carbon, particulate organic matter, sea salt, and mineral dust are included. The aerosol mixing state is prognosed
5
within the possible mixing-state configurations illustrated in Table1. The modes are
composed either of compounds with no or low solubility, henceforth denoted as insol-uble mode, or by an internal mixture of insolinsol-uble and solinsol-uble compounds, henceforth denoted as soluble mode. The main components of HAM are the microphysical core M7 (Vignati et al., 2004), an emission module, a sulfur chemistry scheme (Feichter
10
et al., 1996), a deposition module, and a module to calculate the aerosol radiative
properties.
The microphysical core M7 calculates the coagulation among the modes, the con-densation of gas-phase sulfuric acid on the aerosol surface, the binary nucleation of sulfate, and the water uptake. Sulfate is assumed to occur semi-neutralised in form
15
of ammonium bisulfate (Adams et al.,1999). The aerosol radiative properties as well
as the sink processes dry deposition, sedimentation, and wet deposition are parame-terised in dependence of mode size and composition. The aerosol radiative properties are passed to the ECHAM5 radiation scheme.
Emissions of mineral dust are calculated online in dependence of the ECHAM5 wind
20
speed and hydrological parameters (Tegen et al.,2002,2004). Preferential source
ar-eas and the vegetation cover are assumed constant, taken fromTegen et al.(2002).
Freshly emitted dust is assumed insoluble. Sea salt emissions are parameterised
fol-lowing Schulz et al. (2004). Emissions of DMS are calculated interactively from the
simulated DMS seawater concentrations of the HAMOCC5 ocean biogeochemistry,
25
applying the air-sea exchange formulation of Wannikhof (1992). The emissions of
biogenic terrestrial DMS, POM from secondary biogenic sources, and volcanic SO2
ACPD
5, 12775–12814, 2005Transient evolution of the global aerosol system from 1860 to
2100
P. Stier et al.
Title Page
Abstract Introduction
Conclusions References
Tables Figures
◭ ◮
◭ ◮
Back Close
Full Screen / Esc
Print Version Interactive Discussion
EGU
(http://nansen.ipsl.jussieu.fr/AEROCOM/) emission inventory (Dentener et al., 20053). The emission size-distributions of BC and POM follow the AEROCOM recommenda-tions (seeStier et al.,2005a) as well as the assumption that 2.5% of all SO2emissions are emitted in form of primary sulfate. The applied scenario of anthropogenic emis-sions is described in Sect.2.6.
5
2.3. Aerosol-cloud coupling
The standard ECHAM5 cloud scheme has been extended by a prognostic equation for
the cloud droplet number concentration (CDNC) (Lohmann et al.,1999). Nucleation
of cloud droplets is parameterised semi-empirically in terms of the aerosol number size distribution and vertical velocity (Lin and Leaitch,1997). Sub-grid scale vertical
10
velocity is derived from the turbulent kinetic energy (Lohmann and K ¨archer, 2002).
CDNC sink processes are parameterised in analogy to those formulated in ECHAM5 for the in-cloud liquid water content. The cloud radiative properties depend on the
droplet effective radius, which is calculated from the liquid water content and CDNC.
These co-determine also the auto-conversion rate followingKhairoutdinov and Kogan
15
(2000). Thus, this setup accounts for both the first and second indirect aerosol effects. The semi-direct aerosol effects are implicitly included by the coupling of the aerosols and the ECHAM5 radiation scheme.
2.4. The ocean GCM MPI-OM
The ocean GCM MPI-OM (Marsland et al.,2003) is based on the primitive equations for
20
a hydrostatic Boussinesq fluid with a free surface. The bottom topography is resolved
3
Dentener, F., Wilson, J., Marelli, L., Putaud, J.-P., Bond, T., Hoelzemann, J., Kinne, S., Generoso, S., Textor, C., Schulz, M., van der Werf, G., Gong, S., Ginoux, P., Cofala, J., Boucher, O., Ito, A., and Penner, J.: AEROCOM – aerosol emission data-sets recommendations for years 2000 and 1750, Atmos. Chem. Phys. Discuss., submitted, 2005; data available from
ACPD
5, 12775–12814, 2005Transient evolution of the global aerosol system from 1860 to
2100
P. Stier et al.
Title Page
Abstract Introduction
Conclusions References
Tables Figures
◭ ◮
◭ ◮
Back Close
Full Screen / Esc
Print Version Interactive Discussion
EGU
by means of partial grid cells. The poles of the curvilinear grid are shifted to land ar-eas over Greenland and Antarctica. Parameterised processes include along-isopycnal diffusion, horizontal tracer mixing by advection with unresolved eddies, vertical eddy mixing, near-surface wind stirring, convective overturning, and slope convection. Con-centration and thickness of sea ice are calculated by means of a dynamic and
ther-5
modynamic sea ice model. In the coupled AOGCM setup (Jungclaus et al., 2005),
the ocean passes to the atmosphere the sea surface temperature, sea ice concentra-tion, sea ice thickness, snow depth on ice, and the ocean surface velocities. Using these boundary values, the atmosphere model accumulates the forcing fluxes during the coupling time step of one day. The daily mean fluxes are then passed to the ocean.
10
A horizontal resolution of 1.5◦ and a vertical discretisation on 40 Z-levels is applied in the coupled model setup. No flux adjustment is employed.
2.5. The ocean biogeochemistry module HAMOCC5
The Hamburg oceanic carbon cycle model (Maier-Reimer et al.,2005) is coupled
on-line to the circulation and diffusion of the MPI-OM. The embedded ecosystem model
15
is based on nutrients, phytoplankton, zooplankton, and detritus (NPZD-type), as
de-scribed bySix and Maier-Reimer(1996). In addition, new elements such as nitrogen,
dissolved iron, and dust are accounted for and new processes like denitrification and nitrogen-fixation, formation of calcium carbonate and opaline shells, DMS production and consumption processes, dissolved iron uptake and release by biogenic particles,
20
as well as dust deposition and sinking are implemented. Iron is released into the ocean surface from the dust deposition flux of the HAM aerosol module, assuming a dust iron content of 3.5%. The DMS production is parameterised in terms of the degradation of phytoplankton by senescence and grazing processes. DMS sink processes are con-sumption by bacteria, chemical oxidation, and the flux to the atmosphere, passed as
25
ACPD
5, 12775–12814, 2005Transient evolution of the global aerosol system from 1860 to
2100
P. Stier et al.
Title Page
Abstract Introduction
Conclusions References
Tables Figures
◭ ◮
◭ ◮
Back Close
Full Screen / Esc
Print Version Interactive Discussion
EGU
2.6. Simulation setup
The experimental design follows the standard procedure in coupled atmosphere-ocean climate simulations. From a pre-industrial control experiment “20th century” integra-tions are started and complemented from the year 2000 on by a future scenario sim-ulation based on SRES A1B. Two 20th century ensemble realisations have been
per-5
formed. Here we present results for 1860 to 2000 from the first realization together with the 2001 to 2100 A1B scenario run that was initialised from the second realisation.
In the control simulation, the concentrations of well-mixed greenhouse gases are fixed at their 1860 values (CO2=286.2 ppmv, CH4=805.6 ppbv, N2O=276.7 pptv, CFC-11*=12.5 pptv; CFC-12=0., where CFC-11* accounts for the radiative effect of minor
10
species, including a small contribution from natural sources) and ozone is prescribed as in ECHAM5 (Roeckner et al.,2003).
The 20th century run is initialised from a balanced state of the control run. Well-mixed greenhouse gases are prescribed annually according to observations (smoothly fitted to ice core data, direct observations, and SRES values for the year 2000).
15
Monthly stratospheric and tropospheric ozone concentrations are prescribed as two-dimensional (latitude, height) distributions (Kiehl et al., 1999). Optical depths of vol-canic aerosols above the tropopause level are prescribed annually in four latitude
bands based on an updated dataset (http://www.giss.nasa.gov/data/strataer/) of Sato
et al. (1993). Variations in solar irradiance are specified according to Solanki and
20
Krivova (2003).
We periodically apply monthly mean year 2000 offline oxidant fields (OH, H2O2, NO2, O3) for the sulfur chemistry scheme, as used inStier et al.(2005a). Pham et al.(2005) investigated the effect of changes in the oxidation fields from 2000 to 2100 on the global
sulfate distribution based on the SRES A2 scenario. They showed that the effect on
25
the global mean sulfate burden is less than 1% and on regional surface concentrations about 5%, justifying this simplification.
combus-ACPD
5, 12775–12814, 2005Transient evolution of the global aerosol system from 1860 to
2100
P. Stier et al.
Title Page
Abstract Introduction
Conclusions References
Tables Figures
◭ ◮
◭ ◮
Back Close
Full Screen / Esc
Print Version Interactive Discussion
EGU
tion, domestic fuel-wood consumption, agricultural waste burning, and forest fires are prescribed based on the Japanese National Institute for Environmental Studies (NIES) emission inventory for the SRES A1B scenario (T. Nozawa et al., personal
communi-cation, 2004). We derived emissions of SO2from vegetation fire sources and of POM
from the BC emissions by assuming source specific emission ratios: SO2/BC=1.28,
5
POM/BC of 1.4 (fossil fuel), 5.6 (domestic and agricultural), and 11 (vegetation fires)
(F. Dentener, personal communication). The fossil fuel emissions of SO2 and BC are
prescribed annually, whilst BC emissions from vegetation fires, domestic fuel-wood consumption, and agricultural waste burning are prescribed monthly. It has to be pointed out that even for present day emission inventories, based on largely well
de-10
termined fuel use data, significant uncertainties exist. These uncertainties are
partic-ularly large for the carbonaceous compounds so that present day inventories differ by
as much as a factor of two for fossil fuel use (e.g.Schaap et al.,2004) and are even more uncertain for biomass burning emissions. These uncertainties propagate into the future emission scenarios and further add to their uncertainties regarding population,
15
technological, and legislative developments.
3. Results
3.1. Emissions
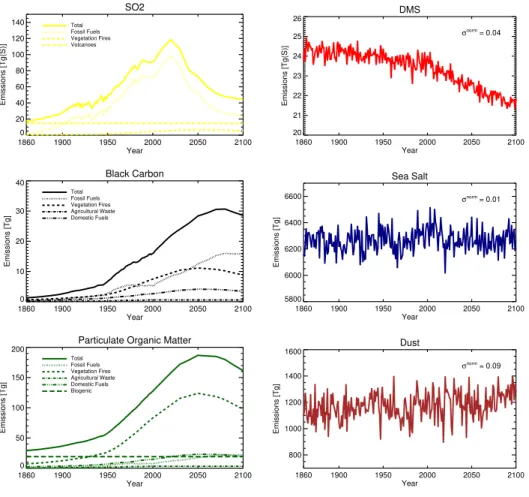
The global annual total aerosol and aerosol precursor emissions from 1860 to 2100 are displayed in Fig.1. Emissions of SO2, dominated by fossil fuel use, peak with 120 Tg
20
around year 2020 and decrease to 45 Tg in the year 2100. Contrary, dominated by the contribution from vegetation fires, the POM emissions peak with about 190 Tg in the year 2050 and decrease to values around 160 Tg in the year 2100. As the contribution from fossil fuels is projected to increase up to the year 2080, the BC emissions show a lagged peak reaching values of 30 Tg around year 2070 and only a small decrease to
25
ACPD
5, 12775–12814, 2005Transient evolution of the global aerosol system from 1860 to
2100
P. Stier et al.
Title Page
Abstract Introduction
Conclusions References
Tables Figures
◭ ◮
◭ ◮
Back Close
Full Screen / Esc
Print Version Interactive Discussion
EGU
The trends of the interactively calculated natural emissions are significantly smaller as distinct trends can only be expected as result of significant alterations of the cli-matological state. The inter-annual variability is analysed in terms of the normalised standard deviationσnorm=σ(E)/E¯, whereEis the annual emission flux and the overbar denotes the integration-period mean.
5
Although the global annual mean wind speed increases (not shown), the wind-driven emissions of DMS constantly decrease, in total by about 10% from the years 1860 to 2100. This reduction can be attributed an enhanced stratification of the oceanic mixed layer in a warmer climate and will be discussed in an accompanying publication (K20052). The inter-annual variability lies atσnorm=0.04. The sea salt emissions show
10
no significant trend throughout the simulation period and a small inter-annual variability (σnorm=0.01). Mineral dust emissions, however, show a distinct inter-annual variability (σnorm=0.09) and an increase of about 10% towards the end of the integration period. It has to be pointed out that the dust emissions are calculated assuming fixed preferential source areas and year 2000 vegetation cover. Therefore, the simulated century scale
15
variability is likely to be a lower estimate.
The evolution of the global distribution of the emissions of sulfur, black carbon, and particulate organic matter is illustrated in Fig.2. Shown are the totals and distribution of the global annual aerosol and precursor emissions averaged over 30-year periods. It is clearly discernible that from the 1861–1890 to the 1961–1990 period the dominant
20
emission increase took place at the east coast of the US, in Central Europe and also in China. Contrary, from 1961–1990 to 2021–2050 the US and European emissions are projected to decrease and significant enhancements are expected in the low latitude regions South America, Central and South Africa, and South Asia.
3.2. Atmospheric aerosol burdens
25
ACPD
5, 12775–12814, 2005Transient evolution of the global aerosol system from 1860 to
2100
P. Stier et al.
Title Page
Abstract Introduction
Conclusions References
Tables Figures
◭ ◮
◭ ◮
Back Close
Full Screen / Esc
Print Version Interactive Discussion
EGU
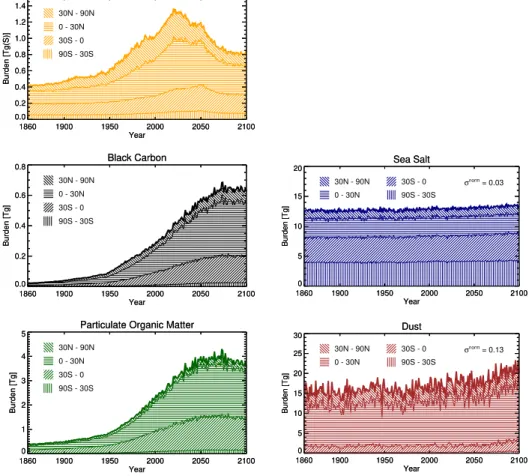
and 2021–2050 in Fig.3. Resembling the emission changes, the SU aerosol burden
increases particularly in the northern hemispheric source regions from the 1861–1890 to the 1961–1990 period. With increasing emissions also the export from the sources regions increases, particularly from Europe to the Mediterranean and northern Africa. To the 2021–2050 period, the high latitude emissions are projected to decrease and
5
high values of the burden are largely confined to low latitude regions. For BC and POM the contribution of the low-latitude emissions increases throughout the integra-tion period. With decreasing high-latitude BC and POM emissions from 1961–1990 to 2021–2050, the low-latitude atmospheric aerosol burden is projected to dominate for the future conditions.
10
The temporal evolution of the atmospheric aerosol burden is shown as total and
separated for four equal area latitude bands in Fig. 4. As the aerosol residence-time
is short, aerosols do not accumulate and the trends in the global annual mean aerosol burdens to a first order resemble the trends in the aerosol emissions with a peak of the SU aerosol burden centred around the year 2020, maximum values of POM burden
15
around 2050, and a maximum of BC around 2070. Most prominently for BC and POM, but to a minor degree also for SU, the dominant aerosol increase occurs at low lati-tudes. This can be attributed to the fact that a significant part of the projected emission increase is from tropical vegetation fires and from increased fossil fuel usage in devel-oping countries. For sea salt the total aerosol burden and meridional distribution shows
20
only minor variations. The increase in the dust burden, discernible from the year 2000
onwards, is most pronounced in the 0◦ to 30◦N band. A more detailed analysis (not
shown) reveals that the dominant changes in the dust emissions occur in the northern African source regions with a decrease in the central-north African source regions, in-cluding the Bodele Depression, and an increase in the Saharan north-western African
25
con-ACPD
5, 12775–12814, 2005Transient evolution of the global aerosol system from 1860 to
2100
P. Stier et al.
Title Page
Abstract Introduction
Conclusions References
Tables Figures
◭ ◮
◭ ◮
Back Close
Full Screen / Esc
Print Version Interactive Discussion
EGU
ditions can partly be attributed to an alteration of the monsoon regimes owing to an increase in atmospheric absorption due to increased carbonaceous emissions from vegetation fires (see R2005).
3.3. Atmospheric residence-times
As many greenhouse gases have long and approximately constant atmospheric
5
residence-times, the discussion about pollutant mitigation is generally expressed in terms of emission scenarios, implicitly assuming that the atmospheric burden is di-rectly linked to the global total amount of emissions. For the short lived aerosols,
how-ever, the atmospheric residence-time (τ) is not necessarily constant and depends on
the time and point of emission, chemical, thermodynamical and microphysical
transfor-10
mations (“aging”), and on the meteorological conditions along the aerosol trajectories (Graf et al., 1997; Barth and Church,1999; Stier et al., 2005b). Figure 5 shows the evolution of the component residence-times throughout the integration period. It is clearly discernible that the residence-time shows non-negligible variations for all com-ponents. The interpretation of this complex evolution of the atmospheric
residence-15
times involves a number of competing processes and interactions.
For SU, τ decreases from about 4.5 days at pre-industrial times to about 4 days
around 1950. Thereafter, in particular with the distinct shift to low-latitude source
re-gions after 2025 and high burdens in the arid subtropical rere-gions (Figs. 2, 3, 4), τ
increases, reaching about 5.5 days around 2050, and remains relatively stable
after-20
wards.
For BC,τ decreases from 6.5 days in 1860 to around 5 days in 1960 and increases
thereafter to to 8 days in 2100. The initial decrease in the residence-time is contradic-tory to the increasing importance of low latitude emissions (c.f. Figs.2, 4). However, for the initially emitted insoluble BC microphysical aging processes play an important
25
role. From Fig. 6, depicting the evolution of the microphysical aging-time, i.e. the
timescale of transformation from the insoluble to the soluble modes (seeStier et al.,
ACPD
5, 12775–12814, 2005Transient evolution of the global aerosol system from 1860 to
2100
P. Stier et al.
Title Page
Abstract Introduction
Conclusions References
Tables Figures
◭ ◮
◭ ◮
Back Close
Full Screen / Esc
Print Version Interactive Discussion
EGU
to 1950. As a consequence, the mass fraction of BC residing in the efficiently
scav-enged internally-mixed accumulation mode soluble increases (Fig. 7), explaining the
initial decrease in the BC residence-time. From about 1960 onwards, the increase in the residence-time indicates that the further enhanced aging to the peak of the sul-fate burden in 2020 is outweighed by the shift to low latitude emissions, with a large
5
contribution of dry-season vegetation fire emissions.
For POM, after a slow increase from about 4.5 days in 1860 to 5.5 days around 1960,
τincreases more rapidly to 8.5 days in the year 2100, closely tracking the evolution for BC. This is a result of the increasing relative importance of the low-latitude dry-season vegetation fire emissions, from which BC and POM are co-emitted.
10
Interestingly, the residence-time of SS also increases by about 6% from 1860 to 2100. Changes in the surface winds, with a poleward shift of the mid-latitude tropo-spheric westerlies (see R2005) cause a poleward shift of the SS emissions. This shift is particularly pronounced in the southern latitudes. Associated is a small but continu-ous shift of the sinks from wet deposition to turbulent dry deposition and sedimentation
15
(not shown). As the high latitude regions are dominated by ice clouds with a slightly reduced scavenging efficiency (c.f.Stier et al.,2005a) this could explain the increase in the SS residence-time.
For DU, τ increases from 2000 to 2100 continuously from about 5 to 6 days. This
is caused by the north-western shift of the dominant African sources into more arid
20
regions and supported by an associated shift of the sinks from wet deposition to sed-imentation. The enhanced microphysical aging under more polluted conditions,
indi-cated by decreased aging-times (Fig.6) and the associated enhanced mass fraction in
the soluble coarse mode (Fig.7), that potentially reducesτappears to be a second or-der effect. Nonetheless, it could explain the relative stable residence-times from 1860
25
ACPD
5, 12775–12814, 2005Transient evolution of the global aerosol system from 1860 to
2100
P. Stier et al.
Title Page
Abstract Introduction
Conclusions References
Tables Figures
◭ ◮
◭ ◮
Back Close
Full Screen / Esc
Print Version Interactive Discussion
EGU
that the mixing state is not constant for different levels of emissions and therefore not under different climatic regimes. The application of the microphysical aerosol module in a transient climate simulation allows to investigate the evolution of previously imposed parameters from prognostic variables.
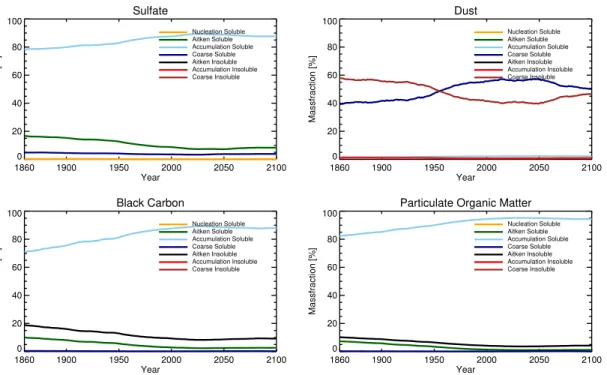
The evolution of the global mean aerosol component mass partitioning among the
5
seven aerosol modes of HAM (Table 1) from 1860–2100 is shown in Fig. 7. For the
anthropogenically relevant species SU, BC, and POM it is evident that under the higher polluted conditions their mass shifts from the Aitken modes to the radiatively important accumulation mode. For DU, a larger mass fraction is aged to the soluble modes under more polluted conditions, consistent with the evolution of the microphysical aging-time
10
shown in Fig.6. The soluble mass fraction of DU decreases with the decay of the SU
and POM burdens.
The disproportionate emission changes of the different aerosol components and
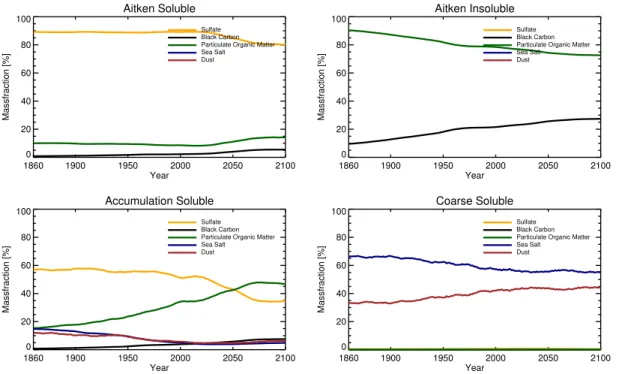
pre-cursors (Sect.3.1) imply alterations of the composition of internally mixed modes. The simulated evolution of the composition of the internally mixed modes of HAM is
dis-15
played in Fig.8. Sulfate is, with a relatively constant mass-fraction of 90%, the domi-nant component of the soluble Aitken mode from 1860 to around 2020. Thereafter, the sulfate fraction decreases to 80% in 2100 as the carbonaceous contribution increases. For the Aitken mode insoluble, the mass fraction of POM gradually decreases from 90% in 1860 to 70% in 2100, balanced by an increase in BC. This is largely a
conse-20
quence of the increasing emission ratio of BC to POM. For the coarse mode soluble the mass fraction of DU increases from about 35% to 45% balanced by a decrease in sea salt, attributable to enhanced microphysical aging of dust and a relative increase in the total DU burden.
The evolution of the radiatively important internally-mixed accumulation mode
solu-25
de-ACPD
5, 12775–12814, 2005Transient evolution of the global aerosol system from 1860 to
2100
P. Stier et al.
Title Page
Abstract Introduction
Conclusions References
Tables Figures
◭ ◮
◭ ◮
Back Close
Full Screen / Esc
Print Version Interactive Discussion
EGU
creases constantly. This decrease is enhanced after the sulfate peak in the year 2020 so that POM becomes the dominant component in the accumulation mode soluble af-ter 2050. The mass fraction of BC increases constantly from 0% in 1860 to around 7% in 2100.
These changes in the composition of the internally mixed modes, with a relative
5
increase in the carbonaceous aerosols, have distinct effects on their interactively cal-culated radiative properties. Here we focus on the internally-mixed accumulation mode soluble as it dominates the anthropogenic contribution to the aerosol radiative effects.
The effect of the increasing importance of the carbonaceous aerosols is nicely
demon-strated by the evolution of the global mean optical depth weighted co-single scattering
10
albedo (CO-SSA) at a wavelength of 550 nm depicted in Fig.9. The CO-SSA, as a
measure of the absorption efficiency, increases constantly from 0.02 in 1860 to 0.04
in 2020. This is a consequence of the increase in the carbonaceous mass fraction, particularly of BC, with higher imaginary parts of the refractive indices (seeStier et al., 2005a). With the decline of the projected sulfate emissions in 2020 the increase in the
15
CO-SSA is further enhanced, reaching a plateau of more than 0.07 in the year 2070.
In summary, the projected changes in the aerosol emissions distinctively affect the
aerosol mixing-state and the composition of the internally mixed modes on the global scale. Consequently, their radiative properties are altered with a significant enhance-ment of the absorption efficiency, owing to the increased contribution of carbonaceous
20
aerosols throughout the integration period.
Changes in the atmospheric aerosol burden and composition affect the aerosol
op-tical depth (AOD), i.e. the column integrated aerosol extinction. The evolution of the global mean total tropospheric aerosol optical depth, fine mode optical depth (Aitken and accumulation modes), coarse mode optical depth, and the absorption optical depth
25
at 550 nm is shown in Fig.10. Total AOD increases from a pre-industrial level of 0.15
to 0.26 in year 2020. The relatively high pre-industrial levels of AOD are largely at-tributable to higher dust emissions in the free climate mode applied in the coupled
Timm-ACPD
5, 12775–12814, 2005Transient evolution of the global aerosol system from 1860 to
2100
P. Stier et al.
Title Page
Abstract Introduction
Conclusions References
Tables Figures
◭ ◮
◭ ◮
Back Close
Full Screen / Esc
Print Version Interactive Discussion
EGU
reck and Schulz (2004) for more details. However, the impact on the anthropogenic
aerosol effects can be assumed small, as indicated by the small anthropogenic
com-ponent mass fractions in the coarse modes, dominating the dust contribution. The decrease in the SU contribution after 2020 is partly compensated by the increase in
POM so that AOD decreases only weakly and levels off to 0.23 in the year 2100. It
5
is interesting to note that the dominant increase in total AOD can be attributed to an increase in the fine mode AOD confirming the assumption that anthropogenic aerosols
predominantly affect the fine mode aerosol optical depth. However, these results do
not support the reverse, i.e. that the fine mode optical depth is a direct measure of the anthropogenic aerosol radiative effects. In fact, more than a third of the simulated fine
10
mode optical depth for the year 2000 is of natural origin, indicated by the values at the beginning of the integration period.
The evolution of the absorption aerosol optical depth (AAOD), i.e. the column inte-grated aerosol extinction owing to absorption (Fig.10), shows a distinct increase from pre-industrial levels of around 0.001 and levels offaround 0.01 in the year 2070. This
15
increase is dominated by the increase in the fine mode AAOD attributable to the in-crease in the total BC burden (linear Pearson’s correlation coefficientr=0.999). The small increase in coarse mode AAOD can be attributed to the increase in the DU bur-den (r=0.995).
The development of the aerosol distribution and radiative properties determines their
20
direct effects on the global radiation balance. Figure 11 shows the evolution of the
simulated global mean total aerosol short-wave clear-sky direct radiative perturbation (DARP), together with the prescribed aerosol optical depth owing to volcanic aerosols in the stratosphere. DARP is defined here as the deviation of the clear-sky net short wave radiation at the top of the atmosphere from the 1860–1870 mean. For
techni-25
cal reasons, areas with a change in surface albedo larger than 0.03 as well as sea-ice covered regions are masked out. Superimposed to the anthropogenic trends are
distinct DARPs from volcanic eruptions, reaching values of around −4 Wm−2 for the
anthro-ACPD
5, 12775–12814, 2005Transient evolution of the global aerosol system from 1860 to
2100
P. Stier et al.
Title Page
Abstract Introduction
Conclusions References
Tables Figures
◭ ◮
◭ ◮
Back Close
Full Screen / Esc
Print Version Interactive Discussion
EGU
pogenic AOD, the negative DARP intensifies, reaches−0.8 Wm−2around 2000, peaks
with about−1.1 Wm−2 around 2020 and remains relatively stable up to 2050, largely
because the continued increase in POM outweighs the decrease in SU after 2020. Al-though AOD remains at a higher level than in 2000 thereafter, DARP weakens, reaching
−0.6 Wm−2 in 2100. This can be attributed to an increase in atmospheric absorption
5
owing to the BC increase (Fig.10). It is interesting to note that the combination of vol-canic and anthropogenic aerosol perturbations between about 1950 and 1970 causes a distinct negative DARP of up to−2 Wm−2. This negative radiative perturbation
con-tributes to mask out the effect of increased greenhouse gas emissions on the global
temperature. In combination with the stagnation and even reversal of the increase of
10
the solar irradiance after about 1930–1940 (Solanki and Krivova, 2003; Krivova and
Solanki,2004), this explains the well simulated small trend in global surface
temper-atures between 1950 and 1970 (see Fig. 1 in R2005) despite the increasing positive greenhouse gas forcing.
4. Conclusions
15
The evolution of the global aerosol system from 1860 to 2100 is investigated through a transient atmosphere-ocean GCM climate simulation with interactively coupled at-mospheric aerosol and oceanic biogeochemistry modules. The microphysical aerosol module HAM incorporates the major global aerosol components sulfate, black carbon, particulate organic matter, sea salt, and mineral dust with prognostic treatment of their
20
composition, size-distribution, and mixing state.
The atmosphere and ocean GCMs are coupled interactively, employing no flux cor-rection. In addition, also the atmospheric and oceanic biogeochemical cycles are coupled interactively by accounting for the deposition of mineral dust acting as micro-nutrient for a prognostic ocean biogeochemistry scheme and by emitting
biogeochemi-25
ACPD
5, 12775–12814, 2005Transient evolution of the global aerosol system from 1860 to
2100
P. Stier et al.
Title Page
Abstract Introduction
Conclusions References
Tables Figures
◭ ◮
◭ ◮
Back Close
Full Screen / Esc
Print Version Interactive Discussion
EGU
and precursor emissions are prescribed based on the Japanese National Institute for Environmental Studies emission inventory from 1860 to 2100. From pre-industrial to present day times greenhouse gases, volcanic stratospheric AOD, and solar variability are prescribed according to observations. For the 2000 to 2100 period, greenhouse gas concentrations as well as aerosol and precursor emissions are based on the SRES
5
A1B scenario.
From pre-industrial times to 2020 the global mean sulfate aerosol burden is projected to increase from 0.4 Tg(S) to 1.3 Tg(S) and thereafter to decrease to 0.8 Tg(S) in 2100. Aerosol burdens of BC and POM are increasing up to around 2070 peaking with bur-dens of 0.7 Tg and 4 Tg and show a small decrease thereafter. The burbur-dens of natural
10
sea salt and mineral dust also increase, however at a significantly slower rate. It has to be pointed out that the variability and the trend in the emissions of mineral dust and natural secondary organics represents a lower estimate due to the assumption of a fixed vegetation cover and the neglect of climate-vegetation feedbacks.
Regionally, the prognosed emissions and consequently the simulated aerosol burden
15
show inhomogeneous trends. From present day to future conditions the anthropogenic aerosol burden shifts generally from the northern high-latitudes to the developing low-latitude source regions. The resulting spatially inhomogeneous radiative perturbations are a driving force for regional climate change.
The projected increase in low-latitude carbonaceous aerosols and the associated
20
increase in the atmospheric absorption cause an enhancement of local monsoon regimes, particularly pronounced over Central Africa (see R2005). The associated changes in the flow pattern and the increase in precipitation and soil moisture shifts emission regimes and the atmospheric burden of mineral dust northward. Such cou-plings of the global aerosol cycles, acting in addition to the coupling by microphysical
25
processes (Stier et al.,2005b), will be further enhanced when climate-vegetation feed-backs are taken into account.
at-ACPD
5, 12775–12814, 2005Transient evolution of the global aerosol system from 1860 to
2100
P. Stier et al.
Title Page
Abstract Introduction
Conclusions References
Tables Figures
◭ ◮
◭ ◮
Back Close
Full Screen / Esc
Print Version Interactive Discussion
EGU
mospheric aerosol burden and therefore the aerosol radiative effects cannot be scaled
by global annual mean emission data. The evolution of the aerosol burden is rather the result of complex interactions of aerosol microphysics, formation pathways, the point of emission, and the meteorological conditions along the aerosol trajectories. For ex-ample, a given sulfate radiative perturbation in the year 2000, scaled to the year 2100
5
by the change of SO2 emissions, would be biased low by a factor of τ2000/τ2100 =
4.3 days/5.6 days=0.8 solely due to the neglect of the longer residence-time in 2100
(assuming constant sulfate yield from SO2 emissions and constant aerosol radiative
properties).
In previous climate simulations, the microphysical aging-time of BC, POM, and DU, if
10
considered, has been prescribed as constant. Here we show that it varies by as much as a factor of two during the integration, with enhanced aging under polluted conditions, peaking around the year 2020.
The projected inhomogeneous changes in the aerosol and precursor emissions dis-tinctively affect the aerosol mixing-state and the composition of the internally mixed
15
modes. With increasing levels of anthropogenic pollution, the fraction of SU, BC, and POM residing in the radiatively important internally mixed accumulation mode in-creases, owing to enhanced microphysical interactions. Under the predicted emission changes, the global mean composition of the internally mixed accumulation mode is altered with a steady increase in the contribution of carbonaceous aerosols. These
20
composition changes are reflected in the aerosol radiative properties. The increasing fraction of carbonaceous aerosols in the internally-mixed accumulation mode causes a more than threefold increase in its co-single scattering albedo, and therefore absorp-tion efficiency, from 1860 to 2100. These findings are in contradiction to the traditional approach of assuming constant radiative properties for each internally mixed mode.
25
They further indicate that the aerosol radiative effects are altered by microphysical in-teractions of the different aerosol cycles.
there-ACPD
5, 12775–12814, 2005Transient evolution of the global aerosol system from 1860 to
2100
P. Stier et al.
Title Page
Abstract Introduction
Conclusions References
Tables Figures
◭ ◮
◭ ◮
Back Close
Full Screen / Esc
Print Version Interactive Discussion
EGU
after, AOD shows only a weak decrease as the continuing increase in carbonaceous aerosol is compensating. The anthropogenic enhancement of AOD is attributable to an increase in fine mode AOD. However, more than a third of the simulated global mean fine mode optical depth of the year 2000 is already present under natural conditions, contradicting the assumption that all fine mode AOD is attributable to anthropogenic
ac-5
tivities. This introduces a significant uncertainty to remote sensing derived estimates of the anthropogenic contribution to the aerosol radiative effects. An integrated approach is required, combining the strengths of remote sensing and global modelling, to reduce the remaining large uncertainties.
The simulated anthropogenic top of the atmosphere clear-sky short-wave direct
10
aerosol radiative perturbation intensifies from pre-industrial times, reaching about
−1.1 Wm−2 around 2020. Although AOD remains at a relative high level after 2050,
DARP weakens to −0.6 Wm−2, attributable to an increase in atmospheric absorption
owing to the continued increase in the BC burden. The onset of the anthropogenic negative DARP in combination with increasing volcanic activity between about 1950
15
and 1970 contribute to the well simulated observed small trend in global surface tem-peratures during that period, despite increasing greenhouse gas forcing.
To recapitulate, our results from a transient coupled AOGCM climate simulation from 1860 to 2100 with an embedded microphysical aerosol module show distinct alter-ations of the aerosol system on global and regional scales over the integration period.
20
Aerosol residence-times, aging-times, size, composition, and mixing-state undergo non-negligible variations. As a consequence, their radiative properties and effects and ultimately their climatic impact cannot be estimated solely based on changes of the global mean emissions.
Large uncertainties, in particular with respect to the future evolution of the aerosol
25
ACPD
5, 12775–12814, 2005Transient evolution of the global aerosol system from 1860 to
2100
P. Stier et al.
Title Page
Abstract Introduction
Conclusions References
Tables Figures
◭ ◮
◭ ◮
Back Close
Full Screen / Esc
Print Version Interactive Discussion
EGU
developments. So one key outcome of this study are the demonstrated modifications of aerosol parameters that have previously been assumed constant – under one possible realisation of greenhouse gas, aerosol, and aerosol precursor emissions.
Additional feedbacks of the aerosol cycles with other compartments of the earth system, such as aerosol effects on vegetation via fertilisation and solar dimming, the
5
effect of changing vegetation on the surface emissions of dust and organic matter, as
well as feedbacks with the atmospheric chemistry are also likely to affect the evolution of the aerosol system and will be subject of future research activities.
Acknowledgements. This research was supported by the German Ministry for Education and Research (BMBF) under the DEKLIM Project and by the European Community under the EN-10
SEMBLES Project. The simulations were performed on the NEC SX-6 supercomputer of the German High Performance Computing Centre for Climate- and Earth System Research in Ham-burg. Review comments by S. Kinne and D. Banse greatly improved this manuscript. We would also like to thank I. Fischer-Bruns for helpful discussions and M. Werner (MPI-Biogeochemistry, Jena) for his support with the dust source. The continuous support of our colleagues L. Korn-15
blueh, U. Schulzweida, U. Schlese, and R. Brokopf was greatly appreciated.
References
Adams, P. J., Seinfeld, J. H., and Koch, D. M.: Global concentrations of tropospheric sulfate, nitrate, and ammonium aerosol simulated in a general circulation model, J. Geophys. Res., 104, 13 791–13 824, 1999. 12781
20
Albrecht, B. A.: Aerosols, cloud microphysics, and fractional cloudiness, Science, 245, 1227– 1230, 1989. 12777
˚
Angstr ¨om, A.: Atmospheric turbidity, global illumination and planetary albedo of the earth, Tellus, 14, 435–450, 1962. 12777
Barth, M. C. and Church, A. T.: Regional and global distributions and lifetimes of sulfate 25
aerosols from Mexico City and southeast China, J. Geophys. Res., 104, 30 231–30 240, doi:10.1029/1999JD900809, 1999. 12788
ACPD
5, 12775–12814, 2005Transient evolution of the global aerosol system from 1860 to
2100
P. Stier et al.
Title Page
Abstract Introduction
Conclusions References
Tables Figures
◭ ◮
◭ ◮
Back Close
Full Screen / Esc
Print Version Interactive Discussion
EGU
Strategies for identifying anthropogenic forcing from Terra satellite measurements, Geophys. Res. Lett., 31, L18101, doi:10.1029/2004GL020510, 2004. 12778
Feichter, J., Kjellstr ¨om, E., Rodhe, H., Dentener, F., Lelieveld, J., and Roelofs, G.-J.: Simulation of the tropospheric sulfur cycle in a global climate model, Atmos. Environ., 30, 1693–1707, 1996. 12781
5
Fouquart, Y. and Bonnel, B.: Computations of solar heating of the earth’s atmosphere: A new parameterization, Beitr. Phys. Atmos., 53, 35–62, 1980. 12780
Graf, H.-F., Feichter, J., and Langmann, B.: Volcanic sulfur emissions: Estimates of source strength and its contribution to the global sulfate distribution, J. Geophys. Res., 102, 10 727– 10 738, 1997. 12788
10
Graßl, H.: Albedo reduction and radiative heating of clouds by absorbing aerosol particles, Contributions Atmospheric Physics, 48, 199–210, 1975. 12777
Hansen, J., Sato, M., and Ruedy, R.: Radiative forcing and climate response, J. Geophys. Res., 102, 6831–6864, 1997. 12777
Jacobson, M. Z.: Control of fossil-fuel particulate black carbon and organic matter, possi-15
bly the most effective method of slowing global warming, J. Geophys. Res., 107, 4410, doi:10.1029/2001JD001376, 2002. 12778
Johns, T. C., Gregory, J. M., Ingram, W. J., Johnson, C. E., Jones, A., Lowe, J. A., Mitchell, J. F. B., Roberts, D. L., Sexton, D. M. H., Stevenson, D. S., Tett, S. F. B., and Woodage, M. J.: Anthropogenic climate change for 1860 to 2100 simulated with the HadCM3 model under up-20
dated emissions scenarios, Clim. Dyn., 20, 583–612, doi:10.1007/s00382-002-0296-y, 2003.
12778
Johnson, K., Gordon, R., and Coale, K.: What controls dissolved iron concentrations in the world ocean?, Marine Chemistry, 57, 137–161, 1997. 12777
Jungclaus, J., Botzet, M., Haak, H., Keenlyside, N., Luo, J., Latif, M., Marotzke, J., Mikola-25
jewicz, U., and Roeckner, E.: Ocean circulation and tropical variability in the coupled model ECHAM5/MPI-OM, J. Clim., in press, 2005. 12783
Khairoutdinov, M. and Kogan, Y.: A New Cloud Physics Parameterization in a Large-Eddy Simulation Model of Marine Stratocumulus, Mon. Wea. Rev., 128, 229–243, 2000. 12782
Kiehl, J., Schneider, T., Rasch, P., Barth, M., and Wong, J.: Radiative forcing due to sulfate 30
aerosols from simulations with the National Center For Atmospheric Research Community Climate Model, version 3, J. Geophys. Res., 105, 1441–1457, 2000. 12778
ocean-ACPD
5, 12775–12814, 2005Transient evolution of the global aerosol system from 1860 to
2100
P. Stier et al.
Title Page
Abstract Introduction
Conclusions References
Tables Figures
◭ ◮
◭ ◮
Back Close
Full Screen / Esc
Print Version Interactive Discussion
EGU
atmosphere system – A global model study, Biogeosciences Discuss., 2, 1067–1126, 2005,
SRef-ID: 1810-6285/bgd/2005-2-1067. 12780
Koepke, P., Hess, M., Schult, I., and Shettle, E.: Global Aerosol Data Set, Report 243, Max Planck Institute for Meteorology, Hamburg, ISSN 0937-1060, 1997. 12778
Krivova, N. and Solanki, S.: Solar variability and global warming: a statistical comparison since 5
1850, Adv. Space Res., 34, 361–364, 2004. 12793
Liepert, B. G., Feichter, J., Lohmann, U., and Roeckner, E.: Can aerosols spin down the water cycle in a warmer and moister world?, Geophys. Res. Lett., 31, L06207, doi:10.1029/2003GL019060, 2004. 12777
Likens, G. E. and Bohrmann, F. H.: Acid rain: a serious regional environmental problem, Sci-10
ence, New Series, 184, 1176–1179, 1974. 12777
Lin, H. and Leaitch, R.: Development of an in-cloud aerosol activation parameterization for climate modelling, in: WMO Workshop on measurement of cloud properties for forcasts of weather, pp. 328–335, World Meteorological Organization, Geneva, 1997. 12782
Lin, S. J. and Rood, R. B.: Multidimensional flux form semi-Lagrangian transport, Mon. Wea. 15
Rev., 124, 2046–2068, 1996. 12780
Lohmann, U.: A glaciation indirect aerosol effect caused by soot aerosols, Geophys. Res. Lett., 29, 1052, doi:10.1029/2001GL014357, 2002. 12777
Lohmann, U. and K ¨archer, B.: First interactive simulations of cirrus clouds formed by homo-geneous freezing in the ECHAM general circulation model, J. Geophys. Res., 107, 4105, 20
doi:10.1029/2001JD000767, 2002. 12782
Lohmann, U. and Roeckner, E.: Design and performance of a new cloud microphysics scheme developed for the ECHAM4 general circulation model, Clim. Dyn., 12, 557–572, 1996. 12780
Lohmann, U., Feichter, J., Chuang, C. C., and Penner, J. E.: Predicting the number of cloud droplets in the ECHAM-GCM, J. Geophys. Res., 104, 9169–9198, 1999. 12782
25
Maier-Reimer, E., Kriest, I., Segschneider, J., and Wetzel, P.: The HAMburg Ocean Carbon Cycle Model HAMOCC5.1 – Technical description release 1.1, Reports on Earth System Science 14, Max Planck Institute for Meteorology, Hamburg, Germany, available fromhttp:
//www.mpimet.mpg.de, 2005. 12780,12783
Marsland, S. J., Haak, H., Jungclaus, J. H., Latif, M., and R ¨oske, F.: The Max-Planck-Institute 30
global ocean/sea ice model with orthogonal curvilinear coordinates, Ocean Modelling, 5, 91–127, 2003. 12779,12782
ACPD
5, 12775–12814, 2005Transient evolution of the global aerosol system from 1860 to
2100
P. Stier et al.
Title Page
Abstract Introduction
Conclusions References
Tables Figures
◭ ◮
◭ ◮
Back Close
Full Screen / Esc
Print Version Interactive Discussion
EGU
Pacific subarctic, Nature, 331, 341–343, 1988. 12777
McCormic, R. A. and Ludwig, J. H.: Climate modifications by atmospheric aerosols, Science, 156, 1358–1359, 1967. 12777
Menon, S., Hansen, J., Nazarenko, L., and Luo, Y.: Climate effects of black carbon aerosols in China and India, Science, 297, 2250–2253, 2002. 12778
5
Mlawer, E. J., Taubman, S. J., Brown, P. D., Iacono, M. J., and Clough, S. A.: Radiative transfer for inhomogeneous atmospheres: RRTM, a validated correlated-k model for the longwave, J. Geophys. Res., 102, 16 663–16 682, 1997. 12780
Morcrette, J.-J., Clough, S. A., Mlawer, E. J., and Iacono, M. J.: Impact of a validated radia-tive transfer scheme, RRTM, on the ECMWF model climate and 10-day forecasts, ECMWF, 10
Reading, UK, technical memorandum 252 edn., 1998. 12780
Nakicenovic, N., Alcamo, J., Davis, G., de Vries, H., Fenhann, J., Gaffin, S., Gregory, K., Grubler, A., Jung, T., Kram, T., Rovere, E. L., Michaelis, L., Mori, S., Morita, T., Papper, W., Pitcher, H., Price, L., Riahi, K., Roehrl, A., Rogner, H.-H., Sankovski, A., Schlesinger, M., Shukla, P., Smith, S., Swart, R., van Rooijen, S., Victor, N., and Dadi, Z.: Special Report on 15
Emissions Scenarios, Intergovernmental Panel on Climate Change, Cambridge University Press, Cambridge, UK, 599 pp., 2000. 12778
Nordeng, T. E.: Extended versions of the convective parameterization scheme at ECMWF and their impact on the mean and transient activity of the model in the tropics, ECMWF, Reading, UK, technical memorandum edn., 1994. 12780
20
Okin, G., Mahowald, N., Chadwick, O., and Artaxo, P.: Impact of desert dust on the biogeo-chemistry of phosphorus in terrestrial ecosystems, Global Biogeochem. Cycles, 18, GB2005, doi:10.1029/2003GB002145, 2004. 12777
Penner, J. E., Andreae, M., Annegarn, H., Barrie, L., Feichter, J., Hegg, D., Jayaraman, A., Leaitch, R., Murphy, D., Nganga, J., and Pitari, G.: Climate change 2001: the scientific 25
basis, chap. Aerosols, their direct and indirect effects, pp. 298–248, Cambridge University Press, 2001. 12778
Pham, M., Boucher, O., and Hauglustaine, D.: Changes in atmospheric sulfur burdens and con-centrations and resulting radiatve forcings under IPCC SRES emission scenarios for 1990– 2100, J. Geophys. Res., 110, D06112, doi:10.1029/2004JD005125, 2005. 12784
30
ACPD
5, 12775–12814, 2005Transient evolution of the global aerosol system from 1860 to
2100
P. Stier et al.
Title Page
Abstract Introduction
Conclusions References
Tables Figures
◭ ◮
◭ ◮
Back Close
Full Screen / Esc
Print Version Interactive Discussion
EGU
resolution, MPI-Report 93, Max Planck Institute for Meteorology, Hamburg, Germany, 1992.
12778
Roeckner, E., Bengtsson, L., Feichter, J., Lelieveld, J., and Rodhe, H.: Transient climate change simulations with a coupled atmosphere-ocean GCM including the tropospheric sulfur cycle, J. Clim., 12, 3004–3032, 1999. 12777,12778
5
Roeckner, E., Baeuml, G., Bonventura, L., Brokopf, R., Esch, M., Giorgetta, M., Hagemann, S., Kirchner, I., Kornblueh, L., Manzini, E., Rhodin, A., Schlese, U., Schulzweida, U., and Tompkins, A.: The atmospheric general circulation model ECHAM5. PART I: Model descrip-tion, Report 349, Max Planck Institute for Meteorology, Hamburg, Germany, available from
http://www.mpimet.mpg.de, 2003. 12779,12780,12784
10
Sato, M., Hansen, J., McCormick, M., and Pollack, J.: Stratospheric aerosol optical depht 1850–1990, J. Geophys. Res., 98, 22 987–22 994, 1993. 12784
Schaap, M., Van Der Gon, H. A. C. D., Dentener, F. J., Visschedijk, A. J. H., Van Loon, M., ten Brink, H. M., Putaud, J.-P., Guillaume, B., Liousse, C., and Builtjes, P. J. H.: Anthropogenic black carbon and fine aerosol distribution over Europe, J. Geophys. Res., 109, D18207, 15
doi:10.1029/2003JD004330, 2004. 12785
Schulz, M., de Leeuw, G., and Balkanski, Y.: Emission of atmospheric trace compounds, chap. Sea-salt aerosol source functions and emissions, pp. 333–359, Ed. Kluwer, 2004. 12781
Six, K. D. and Maier-Reimer, E.: Effects of plankton dynamics on seasonal carbon fluxes in an ocean general circulation model, Global Biogeochem. Cycles, 10, 559–583, 1996. 12783
20
Solanki, S. and Krivova, N.: Can solar variability explain global warming since 1970?, J. Geo-phys. Res., 108, 1200, doi:10.1029/2002JA009753, 2003. 12784,12793
Stier, P., Feichter, J., Kinne, S., Kloster, S., Vignati, E., Wilson, J., Ganzeveld, L., Tegen, I., Werner, M., Schulz, M., Balkanski, Y., Boucher, O., Minikin, A., and Petzold, A.: The aerosol-climate model ECHAM5-HAM, Atmos. Chem. Phys., 5, 1125–1165, 2005a,
25
SRef-ID: 1680-7324/acp/2005-5-1125. 12778,12779,12780,12781,12782,12784,12788,
12789,12791,12803
Stier, P., Feichter, J., Kloster, S., Vignati, E., and Wilson, J.: Emission-induced nonlinearities in the global aerosol system – Results from the ECHAM5-HAM aerosol-climate model, J. Clim., in press, 2005b. 12788,12794
30
Swap, R., Garstang, M., Greco, S., Talbot, R., and Kallberg, P.: Saharan dust in the amazon basin, Tellus B, 44, 133–149, 1992. 12777
ACPD
5, 12775–12814, 2005Transient evolution of the global aerosol system from 1860 to
2100
P. Stier et al.
Title Page
Abstract Introduction
Conclusions References
Tables Figures
◭ ◮
◭ ◮
Back Close
Full Screen / Esc
Print Version Interactive Discussion
EGU
of the introduction of an advanced aerosol-radiation interaction in the ECMWF low resolution global model, pp. 133–177, A. Deepak Publ., Hampton, Va., 1984. 12778
Tegen, I., Harrison, S. P., Kohfeld, K., Prentice, I. C., Coe, M., and Heimann, M.: Impact of vegetation and preferential source areas on global dust aerosol: Results from a model study, J. Geophys. Res., 107, 4576–4597, 2002. 12781
5
Tegen, I., Werner, M., Harrison, S. P., and Kohfeld, K. E.: Relative importance of climate and land use in determining present and future global soil dust emission, Geophys. Res. Lett., 31, L05105, doi:10.1029/2003GL019216, 2004. 12781
Tiedtke, M.: A comprehensive mass flux scheme for cumulus parameterization in large scale models, Mon. Wea. Rev., 117, 1779–1800, 1989. 12780
10
Timmreck, C. and Schulz, M.: Significant dust simulation differences in nudged and cli-matological operation mode of the AGCM ECHAM, J. Geophys. Res., 109, D13202, doi:10.1029/2003JD004381, 2004. 12791
Tompkins, A.: A prognostic parameterization for the subgrid-scale variability of water vapor and clouds in large-scale models and its use to diagnose cloud cover, J. Atmos. Sci., 59, 15
1917–1942, 2002. 12780
Twomey, S.: Pollution and the planetary albedo, Atmos. Environ., 8, 1251–1256, 1974. 12777
Twomey, S.: The influence of pollution on the shortwave albedo of clouds, J. Atmos. Sci., 34, 1149–1152, 1977. 12777
Vignati, E., Wilson, J., and Stier, P.: M7: a size resolved aerosol mixture module for the use in 20
global aerosol models, J. Geophys. Res., 109, D22202, doi:10.1029/2003JD004485, 2004.
12781
Wannikhof, R.: Relationship between wind speed and gas exchange over the ocean, J. Geo-phys. Res., 97, 7373–7382, 1992. 12781
Zhang, J., Christopher, S., Remer, L., and Kaufman, Y.: shortwave aerosol radiative forcing 25
ACPD
5, 12775–12814, 2005Transient evolution of the global aerosol system from 1860 to
2100
P. Stier et al.
Title Page
Abstract Introduction
Conclusions References
Tables Figures
◭ ◮
◭ ◮
Back Close
Full Screen / Esc
Print Version Interactive Discussion
EGU
Table 1. The modal structure of HAM. Ni denotes the aerosol number of the mode i and Mji denotes the mass of compound j∈{SU, BC, P OM, SS, DU} in modei. The ranges for the number median radius ¯rgive the respective mode boundaries (c.f.Stier et al.,2005a).
Modes Soluble/Mixed Insoluble
¯
r [µm] Nucleation
¯
r≤0.005 N1, MSU1
Aitken
0.005<r¯≤0.05 N2, M2SU, MBC2 , MP OM2 N5, MBC5 , MP OM5 Accumulation
0.05<r¯≤0.5 N3, M
SU
3 , M
BC
3 , M
P OM
3 , M
SS
3 , M
DU
3 N6, M
DU
6
Coarse
0.5<r¯ N4, MSU4 , M
BC
4 , M
P OM
4 , M
SS
4 , M
DU
ACPD
5, 12775–12814, 2005Transient evolution of the global aerosol system from 1860 to
2100
P. Stier et al.
Title Page Abstract Introduction Conclusions References Tables Figures ◭ ◮ ◭ ◮ Back Close
Full Screen / Esc
Print Version Interactive Discussion
EGU
SO2
1860 1900 1950 2000 2050 2100 Year 0 20 40 60 80 100 120 140 Emissions [Tg(S)] Total Fossil Fuels Vegetation Fires Volcanoes DMS
1860 1900 1950 2000 2050 2100 Year 20 21 22 23 24 25 26 Emissions [Tg(S)]
σnorm = 0.04
Black Carbon
1860 1900 1950 2000 2050 2100 Year 0 10 20 30 40 Emissions [Tg] Total Fossil Fuels Vegetation Fires Agricultural Waste Domestic Fuels Sea Salt
1860 1900 1950 2000 2050 2100 Year 5800 6000 6200 6400 6600 Emissions [Tg]
σnorm = 0.01
Particulate Organic Matter
1860 1900 1950 2000 2050 2100 Year 0 50 100 150 200 Emissions [Tg] Total Fossil Fuels Vegetation Fires Agricultural Waste Domestic Fuels Biogenic Dust
1860 1900 1950 2000 2050 2100 Year 800 1000 1200 1400 1600 Emissions [Tg]
σnorm = 0.09