Processing of Feature Selectivity in Cortical
Networks with Specific Connectivity
Sadra Sadeh1,2¤*, Claudia Clopath2, Stefan Rotter1
1Bernstein Center Freiburg & Faculty of Biology, University of Freiburg, Feiburg, Germany,2Bioengineering Department, Imperial College London, London, UK
¤ Current Address: Department of Neuroscience, Physiology & Pharmacology, University College London, Gower Street, London WC1E6BT, United Kingdom
Abstract
Although non-specific at the onset of eye opening, networks in rodent visual cortex attain a non-random structure after eye opening, with a specific bias for connections between neu-rons of similar preferred orientations. As orientation selectivity is already present at eye opening, it remains unclear how this specificity in network wiring contributes to feature se-lectivity. Using large-scale inhibition-dominated spiking networks as a model, we show that feature-specific connectivity leads to a linear amplification of feedforward tuning, consistent with recent electrophysiological single-neuron recordings in rodent neocortex. Our results show that optimal amplification is achieved at an intermediate regime of specific connectivi-ty. In this configuration a moderate increase of pairwise correlations is observed, consistent with recent experimental findings. Furthermore, we observed that feature-specific connec-tivity leads to the emergence of orientation-selective reverberating acconnec-tivity, and entails pat-tern completion in network responses. Our theoretical analysis provides a mechanistic understanding of subnetworks’responses to visual stimuli, and casts light on the regime of operation of sensory cortices in the presence of specific connectivity.
Introduction
Cortical neurons in early sensory areas are driven by inputs from a combination of feedforward and recurrent sources that eventually determine the selectivity of neuronal responses. In pri-mary visual cortex (V1) of mammals, for instance, initiated by the seminal observations of ori-entation selective (OS) neurons by Hubel and Wiesel [1,2], the contribution of feedforward and recurrent mechanisms has been thoroughly investigated [3–5]. Theoretical arguments were developed that the cortical recurrent network could be responsible for the emergence of orientation selectivity [6–8]. The results of inactivation experiments, on the other hand, have demonstrated that the thalamic input to cortical neurons are selective for orientation, even in absence of cortical interactions [9,10].
The contribution of cortical recurrent networks to orientation selectivity has recently been reconsidered, in light of new experimental findings in rodents [11–13]. Given the salt-and-a11111
OPEN ACCESS
Citation:Sadeh S, Clopath C, Rotter S (2015) Processing of Feature Selectivity in Cortical Networks with Specific Connectivity. PLoS ONE 10(6): e0127547. doi:10.1371/journal.pone.0127547
Academic Editor:Huibert D. Mansvelder, Neuroscience Campus Amsterdam, VU University, NETHERLANDS
Received:February 27, 2015
Accepted:April 7, 2015
Published:June 17, 2015
Copyright:© 2015 Sadeh et al. This is an open access article distributed under the terms of the Creative Commons Attribution License, which permits unrestricted use, distribution, and reproduction in any medium, provided the original author and source are credited.
Data Availability Statement:All relevant data are within the paper and its Supporting Information files.
Funding:Funding by the German Ministry of Education and Research (BMBF, grant BFNT 01GQ0830) and the German Research Foundation (DFG, grant EXC 1086) is gratefully acknowledged. The funders had no role in study design, data collection and analysis, decision to publish, or preparation of the manuscript.
pepper arrangement of neuronal selectivities and absence of feature maps in rodent visual cor-tex [12], new questions have been raised with regard to specificity of recurrent connections [14]. Can orientation selectivity emerge in networks with random connectivity? Is feature-spe-cific (FS) connectivity of the recurrent connections needed at all to obtain orientation selectivi-ty in neuronal responses? It has in fact been reported that local cortical networks in rodent visual cortex of animals with visual experience have a non-random structure, with a higher probability of a synaptic connection between neurons of similar as compared to dissimilar pre-ferred orientations [15–17]. Although orientation selective responses do exist, connectivity is random at eye opening, and FS connectivity only develops later [18,19]. We hypothesized that the appearance of FS connectivity, for example induced by a Hebbian learning rule [18,20], may therefore be responsible for the further enhancement and amplification of OS.
Consistent with this idea, it has recently been suggested by a number of studies that intra-cortical excitation can induce a linear amplification of the thalamic input [21–23]. The recur-rent input has been reported to have the same feature specificity as the feedforward thalamic input, but with a larger (almost two-fold) amplitude. In addition, a moderate degree of pairwise correlations has also been demonstrated in mouse primary visual cortex [24]. It has been ar-gued that this is a signature of functional organization of the circuitry, in absence of a smooth orientation map. Furthermore, a link between spontaneous and evoked activity has recently been documented in rodent visual cortex [25]. The spatial organization of stimulus-driven and spontaneous ensembles are very similar in mouse, reminiscent of previous reports in cat visual cortex [26,27].
In order to gain some mechanistic understanding of these different, maybe separate effects, we used a large-scale modelling approach. We studied to which degree adding FS connections to an otherwise randomly wired recurrent network can account for these observations (namely, linear amplification of the thalamic input, emergence of pairwise correlations, and link between spontaneous and evoked activity). We found that FS connectivity between excitatory neurons does indeed lead to an amplification of the specific stimulus component, as a result of identical-ly tuned input from within the network, and fulidentical-ly consistent with recent experiments [21–23]. This amplification is further accompanied by moderate to large pairwise correlations in the network [24,28,29], depending on the operating regime determined by the strength of FS con-nectivity. The operating regime also affects the link between spontaneous and evoked activity in the network.
Our large-scale network model elucidates the mechanisms underlying the phenomena emerging as a result of FS connectivity, and casts lights on the operating regime of cortical net-works with specific connectivity. Moreover, it predicts rather unexpected functional properties of visual cortex networks as a result of FS connectivity. First, we observed that reverberating ac-tivity emerged within the subnetwork of active neurons preferring a similar orientation. Sec-ond, the network with FS connectivity was capable of pattern completion upon partial activation of feedforward input fibers. Our computational study of these emergent properties sheds light on their underlying network mechanisms.
Materials and Methods
Neuronal network. Our model consists of a recurrent network ofN= 5 000 leaky integrate-and-fire (LIF) neurons, of whichf= 80% are excitatory and 20% are inhibitory [30]. The sub-threshold dynamics of the membrane potential,Vi(t), of neuroniis described by the leaky-inte-grator equation
The current,Ii(t), represents the total input to the neuron, the integration of which is governed by the leak resistance,R, and the membrane time constant,τ= 20 ms. When the voltage reaches the threshold atVth= 20 mV, a spike is generated and transmitted to all postsynaptic neurons, and the membrane potential is reset to the resting potential atV0= 0 mV. It remains at this level for short absolute refractory period,tref= 2 ms, during which all synaptic currents are shunted.
Network connectivity. Each neuron receives input fromexc= 20% of the excitatory popu-lation andinh= 50% of the inhibitory population, sampled randomly. Inhibitory synapses are
arranged to beg= 8 times more effective than the excitatory ones [31,32], thus our networks are highly inhibition-dominated. This feature is motivated by dense connectivity of inhibitory neurons observed in different cortices [16,33,34], and functional reports for dominance of in-hibition in the cortex [35,36]. Postsynaptic currents are modeled asδ-functions, where the
total current is delivered instantaneously to the postsynaptic neuron after each spike. Synaptic coupling is measured by the amplitude of the resulting postsynaptic potential (PSP),J=RI. The strength of connections made by excitatory neurons in the local network isJexc= 0.2 mV; as a result,Jinh=−gJexc=−1.6 mV. Both excitatory and inhibitory PSPs decay exponentially with the membrane time constantτ, once activated.
In addition to input from local networks, neurons receive a background input from non-local recurrent sources. Each neuron receives an input from 5 000 non-non-local excitatory neurons with spontaneous firing rates of 1 spike/s, modeled as a stationary Poisson process. Synapses from non-local inputs have the same strength as local excitatory synapses, i.e.Jexc= 0.2 mV. Synaptic transmission delays are fixed at 1.5 ms throughout.
We implement feature specific (FS) connectivity in the network by changing the weights of already existing connections between neurons accordingly. The weight of a connection be-tween thejth presynaptic neuron and theith postsynaptic neuron,wij, is modulated by a factor that depends on the cosine of the angular difference between the respective input preferred ori-entations of the two neurons
Dwij¼wij½1þmFScosð2ðy i y
jÞÞ:
The parameterμFSdescribes the degree of FS modulation of the connectivity (FS Mod), with
μFS= 0 corresponding to no modulation (no FS connectivity) andμFS= 1 corresponding to the
case with the strongest possible modulation (zero weight for orthogonal POs).
Network stimulation. When the visual stimulus, i.e. an oriented elongated bar, is presented, feedforward input from the lateral geniculate nucleus (LGN) drives cortical neurons. The feed-forward (thalamic) input to each neuron comprises an input fromNlgn= 50 LGN cells, each with a baseline firing rate ofrlgn= 20 spikes/s, using a synapse of strengthJlgn= 1 mV. This amounts to a baseline firing ratesb=Nlgn×rlgn= 1 kHz of the input to each neuron. The total input depends on the orientation of the stimulus,θ, and the preferred orientation (PO) of the neuron,θ, according to a cosine function
sðy;yÞ ¼sb½1þmcosð2ðy y ÞÞ:
The parameterμis the modulation of the input tuning, which is set toμexc= 20% for excitatory
neurons andμexc= 0% for inhibitory neurons in our simulations. Similar to the non-local
Orientation selectivity. To quantify orientation selectivity (as in e.g.Fig 1), we compute the Preferred Orientation and the Orientation Selectivity Index, OSI, of each neuron from its out-put tuning curve,r(θ), obtained in numerical simulations. We first compute the circular mean [37] of the firing rate measured at each orientation,
R¼
P
yrðyÞexpð2iyÞ P
yrðyÞ
:
The output preferred orientation is then extracted as the angle of the resultant, arg(R), and the length of it,jRj, yields a global measure of orientation selectivity, OSI [38].
To each output tuning curve,r(θ), we fit a von Mises function:
rvMðyÞ ¼aþbexp½kcosð2ðy ÞÞ 1;
using a nonlinear least squares method.
From the best fitting function, the tuning width is extracted as
TW¼12arccos 1þ1
klog
1þ expð 2kÞ 2
:
For each output tuning curve,r(θ), we also compute the baseline (zeroth Fourier, F0) and the modulation (second Fourier, F2) component. The baseline is obtained from the mean of the tuning curve over all orientations, and the modulation is obtained from the second Fourier component of the tuning curve.
Pairwise correlations. Pairwise correlations (inFig 2FandS4 Fig) are computed from sin-gle-neuron spike counts in small bins. For a pair of neurons with spike count vectorsniandnj
(computed from 15 s total simulation time), the correlation is obtained as the correlation coef-ficient of the respective spike counts
CCij¼rni;nj ¼
covðni;njÞ
sn isnj
¼
E½ðn
i mniÞðnj mnjÞ sn
isnj
whereμandσdenote vector of the means and standard deviations of the spike counts. Pairwise correlations are also computed, in the same fashion, for longer bins (the dashed line inFig 2Fand panels D–F inS4 Fig). This is computed from spike counts of neurons for 200 trials of 500 ms duration each. All neurons with firing rates higher than 1 spikes/s are con-sidered in this analysis. The correlation coefficient computed here is similar to computing noise correlations as the product of z-scores between a pair summed across all trials (see e.g. [24]).
Linear gains. The spectrum of eigenvalues of the weight matrix shown inS3 Figis normal-ized according to the linearnormal-ized input-output gain,z, for individual neurons: Each synaptic weight is replaced by an effective weightJeff=zJ. This gain is obtained by linearizing the mean response rate of a LIF neuron [39]
r¼fðm;sÞ ¼ trefþt
ffiffiffi p
p Z V~th ~
V0 eu2
ð1þerfðuÞÞdu
" # 1
;
whereμandσare mean and standard deviation of the currentfluctuation input to the neuron, respectively,V~th ¼ ðVth mÞ=sandV~0¼ ðV0 mÞ=s, and erf is the error function.
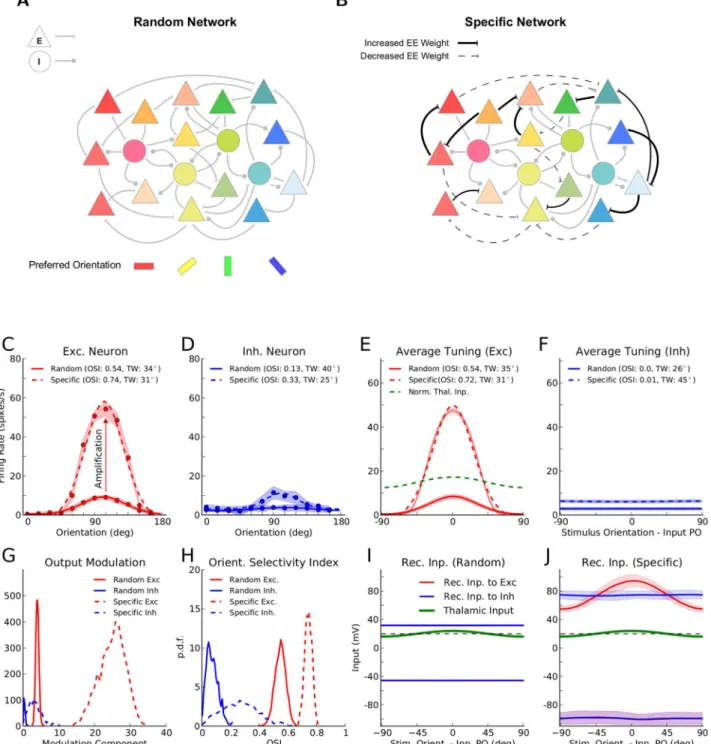
Fig 1. Orientation selectivity in networks with random or specific patterns of connectivity.(A) Random networks: connectivity between neurons is independent of the preferred orientation (PO; color coded) of the lumped feedforward input to each neuron. Triangles: excitatory neurons, circles: inhibitory neurons. (B) Networks with specific excitatory to excitatory (EE) connections: the weight of synapses between excitatory neurons is increased or decreased, if the two neurons have similar or dissimilar (close to orthogonal) input POs, respectively. (C) Tuning curve of a sample excitatory neuron with and without FS connectivity. For each orientation, the mean (circles)±one standard deviation (shading) of the firing rate over 5 trials (1.5 s each) are plotted. The tuning width (TW) is extracted from a fit (seeMaterials and Methods) to the tuning curve (solid: random network, dashed: network with specific connectivity). The orientation selectivity index [38], OSI = 1−Circular Variance, is computed from the actual data points. (D) Same as (C) for a sample inhibitory neuron. (E)
correlations, mean and variance of the input can be written as [40]
mb ¼ t½JlgnsbþJexcrbNðexcf inhgð1 fÞÞ;
s2
b ¼ t½J
2
lgnsbþJ
2
excrbNðexcf þinhg
2
ð1 fÞÞ:
Here,rbis the mean neuronalfiring rate when all neurons are driven by the same baseline inputsbwithout any modulationrb=f(μb,σb). We compute this rate numerically by solving the
respective self-consistency equations [40].
To obtain the linear gain we consider a small perturbation the input,δs, and compute the
re-sulting output perturbation,δr,
dr¼fðmðsbþdsÞ;sðsbþdsÞÞ fðmðsbÞ;sðsbÞÞ:
network. The OSI and TW are computed from the fit (solid: random network, dashed: specific network). (F) Same as (E) for the inhibitory population. (G) Distribution of the modulation component (second Fourier component, F2) of output tuning curves, for random (solid line) and for specific (dashed line) networks, respectively. (H) Distribution of the OSI for the population of excitatory (red) and inhibitory (blue) neurons, in random (solid line) and in specific (dashed line) networks, respectively. (I) Mean (solid line)±standard deviation (shading) of recurrent inputs in the network with random connectivity, obtained from sample excitatory (red) and inhibitory (blue) neurons (50 each). (J) Same as (I) for a network with FS connectivity.
doi:10.1371/journal.pone.0127547.g001
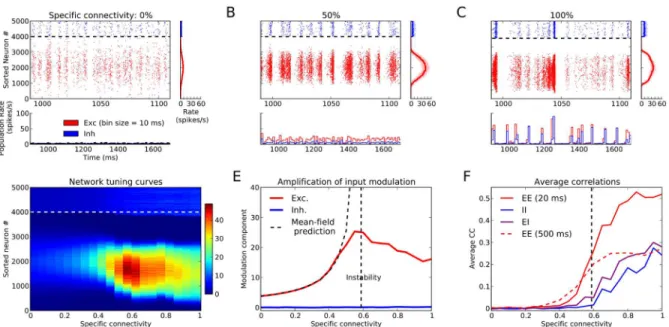
Fig 2. Tuning amplification in networks with different degrees of specific connectivity.(A–C) Raster plot of activity for networks with different specific connectivity in response to a stimulus withθ= 90°. Excitatory (red dots) and inhibitory (blue dots) neurons are sorted according to their input preferred orientation, respectively. The panels below each raster plot show the population firing rate of the corresponding networks, computed from the total spike counts in bins of size 10 ms. The panels on the right indicate the time-averaged firing rate of each neuron, extracted from 15 s of activity (“network tuning curve”). Shading: firing rate of all neurons, solid line: moving average using a window of width of 20 neurons. (D) Network tuning curves (color coded) for 20 different networks with specific connectivity (μFS) between 0% and 100%. (E) Modulation (second Fourier, F2) components of average tuning curves in (D) for excitatory (red) and inhibitory (blue) neurons. The vertical dashed line indicates the critical value for the specific connectivityμFSat which the network
becomes dynamically unstable. The dashed curve is a prediction for the amplification of output modulation derived from mean-field theory (seeMaterials and Methods). (F) Average pairwise correlations for networks with different degrees of specific connectivity. Pearson correlation coefficients (CC) of spike counts for bins of size 20 ms are computed for all pairs of randomly sampled neurons (100 excitatory and 100 inhibitory neurons). The average CC is plotted separately for excitatory-excitatory (EE, red), inhibitory-inhibitory (II, blue), and excitatory-inhibitory (EI, purple) correlations. Correlation coefficients for larger or smaller bin sizes show the same overall trend (S4 Fig). Average EE noise correlations for a very large bin size (500 s) are shown by the dashed line here (seeMaterials and Methods, for details).
The linear gain is then given byJlgnz=δr/δs. InS3 Fig,zswas obtained from choosingδsof the
same size as the input modulation,δ
s=sm=μsb.
Stability criterion for networks with specific connectivity. We aim to determine when the eigenvalues responsible for the modulation component in the input (here, the eigenvalues with the most positive real parts, seeS3B Fig) become unstable. The modulation eigenvalue,λm, is a
result of feature specific recurrent synaptic connectivity in the network. If neurons are sorted according to their preferred orientations, the weight matrix,W, can be approximated as a cir-culant matrix (for the network with all-to-all connectivity,Wis a circulant; here, for our ran-dom networks, we approximate the matrix as a circulant matrix corrupted with noise). In the mean-field approximation, therefore, the operation ofWon an input vector,s
r ¼Ws
can be written in terms of a convolution
r ¼ws;
wherewis thefirst row ofW. The convolution corresponds to a product in the Fourier domain ^
r ¼w^^s:
We are interested here in the second Fourier component, which is an eigenmode of the net-work, and therefore write
rm¼wmsm¼lmsm:
The modulation of the output is now a product of two modulations: a modulation in the cosine input is multiplied by the modulation component of the cosine connectivity.
We can therefore computeλ
mas the modulation component of the cosine tuning of each
row of the weight matrix. The parameterμFSdetermines the degree of modulation, and given
the parameters of network, the resultant value can be computed as
lm¼12mFSfNexczJexc;
if only the excitatory connections are specific (S3B Fig). A dynamic instability sets in for the criticalm
FSfor which Re(λm) = 1, and we obtain
m FS¼
2
fNexczJexc :
This is the vertical dashed line indicated inFig 2E.
The output activity of the network in response to input stimuli is obtained by considering the fullN-dimensional dynamics of neuronal firing rates. Assuming linear operation of the net-work, the linear rate equation in the stationary state leads to the following stimulus-response relation
r¼ ð1 WÞ 1s:
The network operatorA= (1−W)−1is obtained by applying an analytic function to the weight matrixW, and hence the corresponding modulation eigenvalue ofA,l0m, can be obtained by applying the same analytic function
l0m¼ ð1 lmÞ 1:
operation is linear. Output modulation is therefore amplified by the network with FS connec-tivity, relative to its baseline value,r0
m, in absence of FS connectivity, according to rm
r0
m
¼ 1
1 1
2mFSfNexczJexc
:
The dashed curve inFig 2Eis derived from this relation. To some extent, it explains the non-linear dependency of the amplification gain on the connectivity parameter.
Results
Intracortical amplification of feedforward tuning
Using large-scale simulations of inhibition-dominated cortical networks, we studied the dy-namic consequences of adding specificity to recurrent connections. Concretely, we considered enhanced connectivity between neurons with similar preferred orientations (Fig1A,1B). We found that such specific recurrent synaptic interactions between excitatory neurons indeed generally amplify the tuned output responses (Fig1C–1H). This is beyond the orientation se-lectivity that can already arise in random networks in absence of specific interactions [31,41,
42] (S1 Fig). Such an enhancement of orientation selectivity has in fact been reported develop-mentally after eye opening in experimental studies [18,43]
Consistent with recent experimental findings [21–23], the excitatory recurrent input to ex-citatory neurons from within the network has a similar tuning as the feedforward input, only with a larger amplitude (Fig 1JandS2 Fig). Such tuned recurrent inputs are conspicuously lacking in random networks (Fig 1I). Also, recurrent excitatory input to inhibitory neurons, and recurrent inhibitory input to both excitatory and inhibitory neurons are on average un-tuned (Fig 1J), as we have not implemented specific connectivity in those connections. In both random and specific cases (Fig1Iand1J, respectively), however, the untuned components of feedforward and recurrent contributions cancel each other, and only the tuned component can trigger output spikes.
Regimes of intracortical amplification
We next asked how the properties of orientation selectivity depend on FS connectivity. It might be expected that orientation selectivity is enhanced as FS connections are enhanced. We therefore systematically increased the strength of FS connectivity in our networks, while keep-ing all the other parameters includkeep-ing the structure of connectivity the same (Fig 2).
Sample spiking activity, population responses and network tuning curves for three networks (from random to highly specific) are shown in Fig2A–2C, respectively. Network tuning curves extracted from all simulated networks covering a range of FS connectivity are shown inFig 2D. The tuning of output tuning curves is quantified by their respective modulation (second Fou-rier, F2) components. This is shown inFig 2E, separately for excitatory and inhibitory neurons, respectively.
Surprisingly, our results show a non-monotonic dependence of tuning amplification on FS connectivity, where intermediate levels of specificity lead to the strongest amplification (Fig2D
and2E). Further mathematical analysis revealed that the reason for this non-monotonic de-pendence is the emerging instability of the eigenmode associated with modulation (see Materi-als and MethodsandS3 Fig; hereafter, we refer to this kind of instability as“spectral
Note that neurons are never reaching their maximal firing rate, which is 500 spikes/s given the refractory period of 2 ms for the neuron model used here. In fact, we never observed run-away firing rates in our networks. Therefore, a saturation nonlinearity is not the reason for the apparent stability of the system. Instead, nonlinear recurrent interactions in the network are re-sponsible for this stabilization.
An explanation of this network operation can be provided as follows. When the modulation components of output tuning curves are comparable to their baseline components on average, very limited rectification occurs in the network, and the input-output transformation of tuning curves is mainly linear (see [32] for details). When the modulation component becomes too large, a rectifying nonlinearity sets in for very low firing rates. As a result of this nonlinearity, our cosine input tuning curves are not transformed to cosine output tuning curves, because the linearity of network operation is violated. Now the orthogonality of baseline and modulation components, which holds in the linear regime of operation [31], is not effective any more. As a consequence, the modulation component cannot be amplified by the network beyond any bound: for very large output modulations, the negative part of the cosine tuning curve is recti-fied and hence it obtains a non-zero mean value. This now leads to a projection over the com-mon-mode of the network, which is in turn suppressed in inhibition-dominated networks [31]; this means that the output rectified modulation becomes suppressed by the strong negative feedback which was only acting on the uniform mode (the baseline component of the input) before (for a similar observation, see [32]). This in effect yields a suppressive mechanism which controls the amplification of modulation for very large values and hence nonlinearly stabilizes the network. This is also the reason for the discrepancy of the linear prediction and the actual amplification close to the critical value of FS connectivity, already before entering the region with spectral instability.
In the regimes where the nonlinear mechanisms are not dominant, our theoretical analysis fully explains how feedforward and recurrent parameters interact in generating the output se-lectivity. According to this analysis, the output modulation in the absence of recurrent specific-ity (r0
m) is amplified by feature-specific connections by a factor of
1
1 12mFSfNexczJexc(seeMethods).
HereμFSis the strength of feature-specific connectivity (ranging from 0 for random
connectivi-ty to 1 for the maximally specific network),Nis the total number of neurons in the network andfis the fraction of excitatory neurons,Jexcis the absolute weight of excitatory connections andzis the linearized gain of leaky integrate-and-fire neurons about the baseline operating point of the network.
Already from here, several questions about the amplification of orientation selectivity in our networks can be answered: first, what is important for this amplification is the product of re-current excitation (fNexc) and its feature-specificity (μFS). That is, the same degree of
feature-specific connectivity in a more weakly (strongly) connected network leads to a smaller (larger) amplification. Furthermore, the total amplification obviously depends on how tuned the feed-forward input is, as the recurrent specificity is only multiplying the output tuning existing in the non-specific case, which is in turn directly affected by the tuning of the feedforward input (see [31,41,42]).
It can also be asked how this amplification scales with network size, especially for infinitely large networks. To answer this, we can evaluate the critical value of feature-specificity at which the network becomes spectrally unstable:m
FS¼ 2
fNexczJexc. Let usfirst assume that the linear gain,
z, is 1, which would be the case for perfect integrate-and-fire neurons [32]. For infinitely large networks,N! 1, if the weights are not rescaled and the connection probability is the same, m
To avoid that, rescaling the connection probability or synaptic weights becomes necessary. Another solution is to balance the specific excitatory connectivity with specific inhibitory con-nections. However, there is no biological evidence so far for orientation-specific connectivity of inhibitory neurons, as they are reported to densely connect to their local neighborhood [16], which, in rodents, comprises neurons with heterogeneous preferred orientations. Another so-lution, which is consistent with unselective inhibitory connections, is that inhibitory neurons are not balancing the specific input to the neurons, but affecting the linear gains,z. This way, it is possible that a stronger inhibitory feedback, presumably as a result of synaptic plasticity of inhibitory-excitatory connections, decreasesz, which in turn increases them
FSand stabilizes the network in response to modulated inputs. For networks of leaky integrate-and-fire neurons, in particular,zcan be computed [44]; it is therefore possible to compute the exact dependence of them
FSgiven any combination of parameters for the network.
Pairwise correlations in the network
Amplification of orientation selectivity in FS networks is accompanied by an increase in pair-wise correlations. Unlike the amplification itself, however, this increase has a monotonic de-pendence on FS connectivity, and correlations increase in the network as FS connectivity becomes stronger (Fig 2FandS4 Fig).
Notably, the largest correlations arise in the spectrally unstable regime (Fig 2F). For spec-trally stable networks, average correlations are rather weak, consistent with an asynchronous-irregular (AI) state of network activity [40]. Population responses deviate more from AI-type network activity, however, in the spectrally unstable regime, and they approach a highly syn-chronous state, characterized by very large temporal fluctuations of the population activity (Fig 2C). Emergence of large correlations indeed starts when networks approach the edge of spectral stability, as has been demonstrated and analyzed before [45].
The regime of recurrent amplification can therefore be summarized in terms of three re-gimes of (a) low, (b) medium and (c) high FS connectivity: (a) shows very little tuning amplifi-cation and close-to-zero pairwise correlations; (b) exhibits maximum amplifiamplifi-cation and a mild degree of correlations (noise correlation close to 0.1); (c) entails a decreasing amplification, while at the same time pairwise correlations still increase.
Spontaneous and evoked patterns of activity
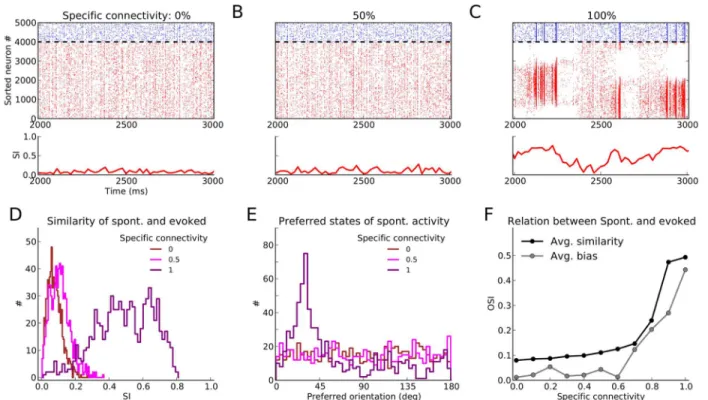
We then asked the question of how spontaneous patterns of activity are influenced by FS con-nectivity (Fig 3). Inspecting the raster plots of activity in the three regimes of low, medium and high FS connectivity (Fig3A–3C) reveals that the most structured pattern of spontaneous ac-tivity is observed in the regime of high FS connecac-tivity. Temporal patterns of spontaneous pop-ulation activity show structured activity, reminiscent of the patterns evoked by an oriented stimulus.
To quantify the similarity between spontaneous and evoked activity patterns, we computed a similarity index (SI) in bins of width 20 ms (Fig3A–3C, lower panels). The most similar re-sponses are again observed in the spectrally unstable regime (Fig 3C). This spontaneous activa-tion of evoked responses in absence of a specific stimulus exhibits slow transiactiva-tions between different preferred orientations (i.e. different points on the line attractor of the network; see [46] for similar observations).
as compared to the random network (Fig 3D). However, in contrast to the spectrally stable net-works with uniform distributions of preferred orientations, the spectrally unstable network does not represent all orientations uniformly in its spontaneous activity. Some orientation-se-lective responses are over-represented, which is a result of the specific realization of the ran-dom connectivity matrix, reflected by the eigenvalue spectrum of the weight matrix (see
S3B Fig).
A bias for certain preferred orientations in spontaneous activity can be quantified by the se-lectivity index of the distribution of preferred orientations, shown inFig 3E. A flat distribution with no bias whatsoever would return 0, whereas a distribution of spontaneous activity concen-trated in a single preferred orientation would return 1. All networks in the spectrally stable re-gime have a uniform distribution of preferred orientations, while transition to instability renders the spontaneous activity of networks more biased towards specific evoked states as FS connectivity increases (Fig 3F, gray line). Thus, the increase in the SI of population activity for these networks (Fig 3F, black line) comes at the price of not visiting all states with the same fre-quency. In the intermediate regime, however, the SI of spontaneous activity is increasing, while the bias remains at low levels.
Fig 3. Spontaneous activity patterns.(A–C) Raster plot of spontaneous activity for networks with different degrees of specific connectivity. The similarity between spontaneous activity and patterns of activity evoked by oriented stimuli is quantified by a similarity index (SI). It is taken as the magnitude of the complex numberRsp
¼
P jr
sp
j expð2iyjÞ P
jr
sp
j
, wherersp
j is the averagefiring rate of excitatory neuronjin bins of size 20 ms, andy
jis the input preferred orientation of the neuron. Other conventions are as inFig 2. (D) Distribution of SI of spontaneous activity extracted from a simulation of duration 30 s for three networks shown in (A–C). (E) The angle ofRspindicates the preferred orientation of the population activity in each time window. The distribution of this“spontaneous”tuning of population activity is plotted here for the three networks shown in (A–C). (F) The average SI of spontaneous activity, computed from distributions as in (D), is plotted for 11 networks ranging from completely random to highly feature-specific (black dots). To quantify the bias in the preferred orientation of the population activity in each network, the selectivity of the distributions of preferred orientations as in (E) are computed (Avg. bias, gray). It is computed as 1
−Circular Variance of the distribution in (E).
Emergence of reverberating activity and pattern completion
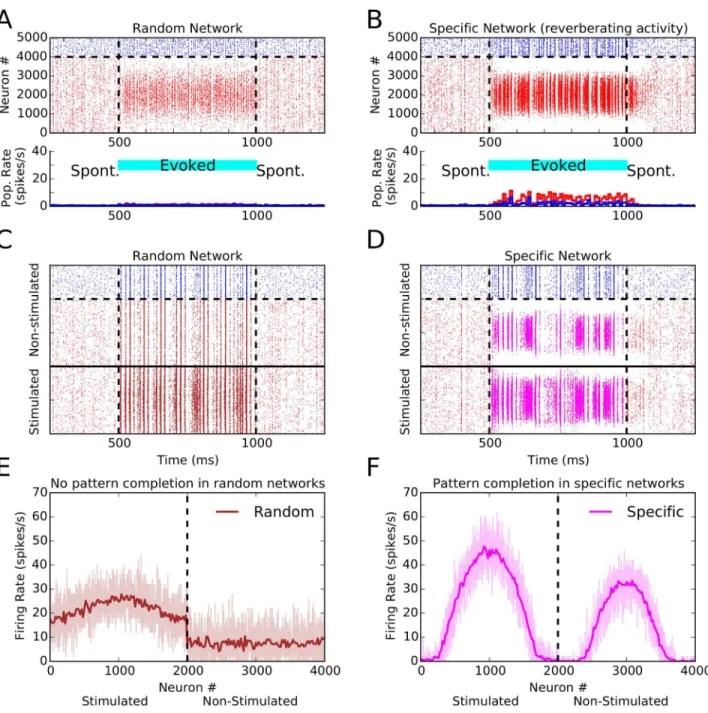
We focused so far on how FS connectivity can lead to different regimes of tuning amplification, activity correlation, and spontaneous activation of specific activity patterns. However, addi-tional funcaddi-tional properties can result from FS connectivity. In particular, we observed the emergence of reverberating activity, and pattern completion (Fig 4).
First, we observed that upon turning off an oriented stimulus networks with FS connectivity can show persistent activation for a brief period of time (50–100 ms;Fig 4B). As a result of fea-ture-specific connectivity, some reverberation of activity emerges between neurons with pre-ferred orientations close to the orientation of the stimulus. Such network-based short-term memory is lacking in the random network, and the evoked response quickly vanishes as soon as the oriented stimulus is turned off (Fig 4A).
Second, the network with FS connectivity was capable of pattern completion. Specifically, if only a fraction of excitatory neurons was stimulated with an oriented stimulus, the network with specific connectivity was capable of activating the non-stimulated neurons, with a similar pattern compared to that obtained by direct stimulation (Fig4D,4F). In a random network, there are no such spontaneous patterns to begin with (Fig4C,4E).
Discussion
Using numerical simulation and computational analysis of large-scale spiking networks, our study demonstrated how the refinement of connectivity during development contributes to the processing of orientation selectivity in cortical networks. It provided a mechanistic link be-tween FS connectivity and processing of orientation selectivity in a biologically realistic net-work model, fully consistent with recent experimental findings in the rodent visual cortex [21,
22]. Our mean field and spectral radius analysis could in fact provide a computational account of orientation selectivity in realistic model cortical networks operating in different regimes of FS connectivity.
An important feature of our networks was the dominance of inhibition in recurrent connec-tivity. This yields a selective suppression of the common-mode, which leads to an enhancement of output selectivity and contrast invariance of output tuning curves [31]. Inhibition also deter-mines the effective linear neuronal gains in the networks, as the operating point about which the system is linearized is determined by the fixed point of the network (resulted from balance of excitation and inhibition) in response to the homogeneous input [44]. The inhibition-domi-nance of connectivity, in turn, leads to the balanced state in terms of network dynamics, where the net excitatory input to a single neuron is more than its threshold and only a comparable negative feedback from the network keeps the membrane potential below threshold and allows the neuron to operate in a fluctuation-driven regime of activity (as it is shown inFig 1andS1
andS2Figs).
Fig 4. Reverberating activity and pattern completion in networks with specific connectivity.(A) Raster plot of a random network with non-specific stimulation (“spontaneous activity), and in response to a stimulus of orientation 90° (evoked activity) applied from 500 ms to 1000 ms (cyan bar). The bottom panel shows population firing rates computed in bins of size 25 ms. Excitatory neurons are red, inhibitory neurons are blue. (B) Same as (A), for a network with specific connectivity (specificity 50%). (C, D) Same as (A, B), but only a fraction of excitatory neurons is stimulated. The excitatory population is split into two halves, and only the first half (neurons below the solid line) sees the oriented stimulus; the remaining neurons receive only background input. (E, F) Network tuning curves (similar toFig 2) extracted from the spiking activity of stimulated and non-stimulated excitatory neurons during the evoked state, for random and specific networks, respectively. In the random network, the non-stimulated fraction shows non-selective activity. In the network with FS connectivity, however, both stimulated and non-stimulated population show orientation selective responses.
instability of the AI state, just before the eigenmode corresponding to the modulation compo-nent would become linearly unstable (cf. [47]). In contrast to the conclusion of [47], therefore, our results suggest the stable AI state as a more suitable regime for sensory processing.
In this optimal regime, we observed a moderate increase of correlations (Fig 2FandS4 Fig), despite the network being spectrally stable. A comparable level of noise correlations has in fact been reported recently in mouse visual cortex [24]. This result is also consistent with larger pairwise correlations reported recently in supra- and infra-granular layers of monkey primary visual cortex [28,29], assuming that FS connectivity is emerging in those layers as a result of Hebbian learning. We therefore hypothesize that the emergence of pairwise correlations might be considered as a signature of FS connectivity to the degree to which it implies reaching the edge of spectral stability [45]. In light of this hypothesis, it will be interesting to see whether the close-to-zero correlations in the input layers of monkey V1 [28,29] reflect the lack of FS con-nectivity in those layers. Also, as FS concon-nectivity is not present at eye opening in mice [18], we predict that only very low pairwise correlations should be observed at this stage, with moderate correlations appearing only later during development, coinciding with the emergence of FS connectivity [16–19].
Note that, although correlations are observed in the activity of our networks, they were not necessary, and not detrimental, for the emergence of tuning amplification in the linear regime. In fact, the mean-field theory employed here was developed under the assumption that neu-rons receive uncorrelated spike trains (seeMethods and Materials). This theory was neverthe-less generating an excellent approximation of the mean amplification of the network, and the transition to spectral instability (Fig 2E). The success of our model, therefore, shows that mech-anisms underlying the amplification of feedforward tuning in the linear regime do not include correlations across neurons; tuning amplification and correlations both emerge as a result of network dynamics, but they do not seem to be linked together causally.
As opposed to the low or moderate degree of correlations in the regimes of stable dynamics, relatively large pairwise correlations were observed in the spectrally unstable regime (Fig 2F). That is, in presence of FS connectivity, the amplification gain of the network decreases, and pairwise correlations simultaneously increase. The former effect decreases the signal-to-noise ratio, and the latter effect compromises the decoding of sensory information [48]. In contrast, the regime with low FS connectivity shows only very small pairwise correlations. This enhances the stimulus encoding, but limits the network in amplifying the sensory signal. The intermedi-ate regime appears to provide a useful trade-off between information content of the population code and signal-to-noise ratio.
A similar trade-off can be reported for the patterns of spontaneous activity (Fig 3F). Net-works with very large FS showed the most selective spontaneous patterns, resembling the evoked responses of the network best. This was, however, compromised by a non-uniform re-presentation of orientation patterns in the spontaneous activity (see [44] for a similar observa-tion). The intermediate regime, in contrast, showed only a moderate enhancement of
selectivity of spontaneous patterns, but without introducing a bias toward a specific preferred state (Fig 3F). Another advantage of the intermediate regime is the fast switching between dif-ferent states, in contrast to the very slow time scale of transitions between network states in the spectrally unstable regime (see also [46]).
together by chance in a random network, the spontaneously active subnetworks would become feature-specific in networks with FS connectivity. Now, a pronounced functional map of orien-tation selectivity determines co-active ensembles in spontaneous activity and makes them simi-lar to the evoked ones.
A biologically more realistic version of our model should also account for two further fea-tures. First, we neglected heterogeneity in synaptic connections, as the number and strength of synapses were the same for all networks, and only the strength of synapses was modified based on FS of pre- and post-synaptic neurons. A more biologically realistic network with neous connectivity (including heterogeneity in the number and strength of synapses, heteroge-neity in FS connectivity, and heterogeheteroge-neity in the balance of excitation and inhibition) leads to more realistic responses. However, our main findings here also hold under such conditions, and do not change qualitatively (results not shown). Second, we only studied networks in which only the excitatory population underwent a change in synaptic connectivity. It is possi-ble, however, that during development, excitatory to inhibitory or inhibitory to excitatory con-nections also change. Potentiation of inhibition as a result of such a plasticity may well ensure the stability of the modulation eigenmode, preventing the network from entering the spectrally unstable regime. As a result of potentiation of inhibitory connections the firing rate of excitato-ry neurons can also decrease. This might lead to moderate firing rates which seem to be more compatible with experimental results in rodents. It remains, therefore, an interesting topic for further studies how concomitant changes in the weights of excitatory and inhibitory connec-tions affect network dynamics and neuronal tuning curves.
In our networks here with FS excitatory connections, we also found two further emergent properties. First, we observed pattern completion in our networks: when only half of the excit-atory population was stimulated, networks with FS connectivity responded as if the whole stim-ulus pattern was present. We also observed an emergence of reverberating activity as a result of specific connectivity, where orientation selective population activity persisted for a few tens of millisecond after removal of the visual stimulus. Such a persistent activity has indeed been re-ported in cats [50], with time constants very similar to those reported here. It is therefore inter-esting to see whether a similar effect exists in mouse visual cortex. As feature-specific
connectivity is absent at eye opening, the prediction is again that reverberating activity only emerges later during development, as soon as a significant degree of FS connectivity is estab-lished [18]. It is also tempting to speculate about the biological function of this reverberating activity. It might be crucial for creating association in time, and instrumental to solve the prob-lem of temporal feature-binding. Using analytical and computational tools, we therefore pro-vide a very-much needed framework to understand the role of FS connectivity in visual processing in particular, and sensory processing in general.
Supporting Information
has the same mean value as the output tuning curve. (E) Mean (black line) ± standard deviation (gray shading) of output tuning curves, computed from the entire neuron population. The green curve is again the normalized input tuning curve, and the dashed lines indicate the aver-age firing rate for excitatory (red) and inhibitory (blue) populations. OSI and TW are comput-ed from the fit (dottcomput-ed black line). (F) Distribution of the zeroth (F0, baseline) and the second (F2, modulation) Fourier components of output tuning curves in the network. (G, H) Distribu-tion of OSI and TW for the populaDistribu-tion of excitatory (red) and inhibitory (blue) neurons, re-spectively. The TW distribution is only plotted for neurons with less than 10% error of fit (see
Materials and Methods). The distribution of this error is shown in the inset in (H). (I) Distribu-tion of the difference between input and output preferred orientaDistribu-tions,ΔPO= Output PO −Input PO, for excitatory (red) and inhibitory (blue) populations. (J) Excitatory (red) and in-hibitory (blue) recurrent input to a sample neuron with input preferred orientation,θ= 0° in response to a stimulus of orientationθ= 0°. A sample trace is shown for 200 ms of stimulation, with the distribution for the whole recording time (5 trials of 1.5 s duration) indicated on the right. (K) Temporal mean (circles) and standard deviation (bars) of the input for sample excit-atory (red) and inhibitory (blue) neurons with different POs (indicated on the x-axis). (L) Input tuning curves for the sample neuron shown in (A). Mean and standard deviation (over time) of excitatory (red) and inhibitory (blue) recurrent inputs to the neuron are shown for dif-ferent stimulus orientations. The feedforward input is shown for comparison (green). (M) Input tuning curves for 50 excitatory (red) and 50 inhibitory (blue) sample neurons with differ-ent input POs. Feedforward input is again shown in green.
(TIFF)
S2 Fig. Orientation selectivity in networks with specific connectivity. (A–H)Same as (B–I)
inS1 Fig, respectively, for a network with 50% FS connectivity (μFS= 0.5, seeMaterials and Methodsfor details) within the excitatory population. In (A) and (B), tuning curves of the same excitatory and inhibitory neurons in the random network (Fig1Band1C) are superim-posed for comparison (dashed lines). In (D), average tuning curves are plotted separately for excitatory (red) and inhibitory (blue) neurons. (I–L) Same as (J–M) inS1 Fig, respectively, for
a network with FS connectivity within the excitatory population. (M) Mean (solid line) ± one standard deviation (shading) of recurrent input in the network with random connectivity, ob-tained from 50 excitatory (red) and 50 inhibitory (blue) neurons. (N) Same as (M) for the net-work with FS EE connectivity (μFS= 0.5). (O) Tuning of feedforward input compared to the
tuning of recurrent excitatory input to excitatory neurons. (TIFF)
S3 Fig. Amplification of input modulation in networks with specific connectivity.(A) Ei-genvalue spectrum of the normalized weight matrix for a network with random connectivity. The weight matrix is obtained by linearizing the network dynamics and computing neuronal gains (seeMaterials and Methodsfor further explanation). The large negative eigenvalue, cor-responding to the non-selective mode, is not shown for graphical reasons. It is a result of the in-hibition dominance in our networks, and it is responsible for selective attenuation of the common mode. The eigenvalues with second and the third largest magnitude,λ1andλ2, are
marked by circles in (B) and (C). The black cross denotes the prediction based on our theory (seeMaterials and Methodsfor details). Lower panel: Eigenvectors corresponding to the three largest eigenvalues of the network are plotted versus the input preferred orientation of the cor-responding neurons, separately for excitatory and inhibitory neurons (x-axis). The first eigen-vector has uniform components and corresponds to the large negative eigenvalueλ
0(not
function to the second and the third eigenvectors (versus input PO) are shown by solid lines. The difference in the phase of the two cosines (Δϕ) is indicated in each case.
(TIFF)
S4 Fig. Pairwise correlations in networks with different degrees of specific connectivity.(A) Distribution of pairwise correlations in the network with random connectivity. Pearson corre-lation coefficient, CC, of spike counts for different bin sizes (5, 10, 20 and 50 ms, respectively) are computed for randomly sampled neurons (100 excitatory and 100 inhibitory). CC is plotted separately for excitatory-excitatory (EE, red), inhibitory-inhibitory (II, blue), and excitatory-in-hibitory (EI, purple) correlations. The mean CC is given for each distribution. (B) Same as (A) for networks with an intermediate degree of specific connectivity (50%;μFS= 0.5). At this
de-gree of specific connectivity, the modulation eigenmodes are still stable. (C) Same as (A) for networks with a very high degree of FS connectivity (100%;μFS= 1). The modulation
eigen-modes are unstable for this network. Note that the distributions show qualitatively the same be-havior for different bin sizes. (D–F) Distribution of pairwise correlations for all three networks
for a very large bin size. It is computed from 200 trials of 500 ms spiking activity, and all neu-rons with an average firing rate more than 1 spikes/s are included in this analysis.
(TIFF)
Acknowledgments
We thank the developers of the simulation software NEST (http://www.nest-initiative.org).
Author Contributions
Conceived and designed the experiments: SS CC SR. Performed the experiments: SS. Analyzed the data: SS CC SR. Contributed reagents/materials/analysis tools: SS CC SR. Wrote the paper: SS CC SR.
References
1. Hubel DH, Wiesel TN. Receptive fields, binocular interaction and functional architecture in the cat’s vi-sual cortex. The Journal of Physiology. 1962; 160:106–54. Available from:http://www.ncbi.nlm.nih.gov/ pubmed/14449617. doi:10.1113/jphysiol.1962.sp006837PMID:14449617
2. Hubel DH, Wiesel TN. Receptive fields and functional architecture of monkey striate cortex. The Jour-nal of Physiology. 1968; 195(1):215–243. Available from:http://www.ncbi.nlm.nih.gov/pubmed/ 4966457. doi:10.1113/jphysiol.1968.sp008455PMID:4966457
3. Sompolinsky H, Shapley R. New perspectives on the mechanisms for orientation selectivity. Current Opinion in Neurobiology. 1997; 7(4):514–522. Available from:http://www.ncbi.nlm.nih.gov/pubmed/ 9287203. doi:10.1016/S0959-4388(97)80031-1PMID:9287203
4. Ferster D, Miller KD. Neural mechanisms of orientation selectivity in the visual cortex. Annual Review of Neuroscience. 2000; 23(1):441–471. Available from:http://www.ncbi.nlm.nih.gov/pubmed/10845071. doi:10.1146/annurev.neuro.23.1.441PMID:10845071
5. Priebe NJ, Ferster D. Mechanisms of Neuronal Computation in Mammalian Visual Cortex. Neuron. 2012; 75(2):194–208. Available from:http://www.ncbi.nlm.nih.gov/pubmed/22841306. doi:10.1016/j. neuron.2012.06.011PMID:22841306
6. Ben-Yishai R, Bar-Or RL, Sompolinsky H. Theory of Orientation Tuning in Visual Cortex. Proceedings of the National Academy of Sciences. 1995; 92(9):3844–3848. Available from:http://www.ncbi.nlm.nih. gov/pubmed/7731993. doi:10.1073/pnas.92.9.3844
7. Somers DC, Nelson SB, Sur M. An emergent model of orientation selectivity in cat visual cortical simple cells. The Journal of Neuroscience. 1995; 15(8):5448–5465. Available from:http://www.ncbi.nlm.nih. gov/pubmed/7643194. PMID:7643194
9. Ferster D, Chung S, Wheat H. Orientation selectivity of thalamic input to simple cells of cat visual cor-tex. Nature. 1996; 380(6571):249–252. Available from:http://www.ncbi.nlm.nih.gov/pubmed/8637573. doi:10.1038/380249a0PMID:8637573
10. Chung S, Ferster D. Strength and orientation tuning of the thalamic input to simple cells revealed by electrically evoked cortical suppression. Neuron. 1998; 20(6):1177–1189. Available from:http://www. ncbi.nlm.nih.gov/pubmed/9655505. doi:10.1016/S0896-6273(00)80498-5PMID:9655505
11. Van Hooser SD, Heimel JAF, Chung S, Nelson SB, Toth LJ. Orientation selectivity without orientation maps in visual cortex of a highly visual mammal. The Journal of Neuroscience. 2005 Jan; 25(1):19–28. Available from:http://www.ncbi.nlm.nih.gov/pubmed/15634763. doi:10.1523/JNEUROSCI.4042-04. 2005PMID:15634763
12. Ohki K, Chung S, Ch’ng YH, Kara P, Reid RC. Functional imaging with cellular resolution reveals pre-cise micro-architecture in visual cortex. Nature. 2005; 433(7026):597–603. Available from:http://www. ncbi.nlm.nih.gov/pubmed/15660108. doi:10.1038/nature03274PMID:15660108
13. Niell CM, Stryker MP. Highly selective receptive fields in mouse visual cortex. The Journal of Neurosci-ence. 2008; 28(30):7520–36. Available from:http://www.ncbi.nlm.nih.gov/pubmed/18650330. doi:10. 1523/JNEUROSCI.0623-08.2008PMID:18650330
14. Ohki K, Reid RC. Specificity and randomness in the visual cortex. Current opinion in neurobiology. 2007; 17(4):401–7. Available from:http://www.ncbi.nlm.nih.gov/pubmed/17720489. doi:10.1016/j. conb.2007.07.007PMID:17720489
15. Jia H, Rochefort NL, Chen X, Konnerth A. Dendritic organization of sensory input to cortical neurons in vivo. Nature. 2010; 464(7293):1307–12. Available from:http://www.ncbi.nlm.nih.gov/pubmed/ 20428163. doi:10.1038/nature08947PMID:20428163
16. Hofer SB, Ko H, Pichler B, Vogelstein J, Ros H, Zeng H, et al. Differential connectivity and response dy-namics of excitatory and inhibitory neurons in visual cortex. Nature Neuroscience. 2011; 14(8):1045–
52. Available from:http://www.ncbi.nlm.nih.gov/pubmed/21765421. doi:10.1038/nn.2876PMID: 21765421
17. Ko H, Hofer SB, Pichler B, Buchanan KA, Sjöström PJ, Mrsic-Flogel TD. Functional specificity of local synaptic connections in neocortical networks. Nature. 2011; 473(7345):87–91. Available from:http:// www.ncbi.nlm.nih.gov/pubmed/21478872. doi:10.1038/nature09880PMID:21478872
18. Ko H, Cossell L, Baragli C, Antolik J, Clopath C, Hofer SB, et al. The emergence of functional microcir-cuits in visual cortex. Nature. 2013; 496(7443):96–100. Available from:http://www.ncbi.nlm.nih.gov/ pubmed/23552948. doi:10.1038/nature12015PMID:23552948
19. Ko H, Mrsic-Flogel TD, Hofer SB. Emergence of Feature-Specific Connectivity in Cortical Microcircuits in the Absence of Visual Experience. Journal of Neuroscience. 2014 Jul; 34(29):9812–9816. Available from:http://www.jneurosci.org/content/34/29/9812.short. doi:10.1523/JNEUROSCI.0875-14.2014 PMID:25031418
20. Clopath C, Büsing L, Vasilaki E, Gerstner W. Connectivity reflects coding: a model of voltage-based STDP with homeostasis. Nature Neuroscience. 2010; 13(3):344–52. Available from:http://www.ncbi. nlm.nih.gov/pubmed/20098420. doi:10.1038/nn.2479PMID:20098420
21. Lien AD, Scanziani M. Tuned thalamic excitation is amplified by visual cortical circuits. Nature neurosci-ence. 2013; 16(9):1315–23. Available from:http://www.ncbi.nlm.nih.gov/pubmed/23933748. doi:10. 1038/nn.3488PMID:23933748
22. Li LY, Li YT, Zhou M, Tao HW, Zhang LI. Intracortical multiplication of thalamocortical signals in mouse auditory cortex. Nature neuroscience. 2013; 16(9):1179–81. Available from:http://www.ncbi.nlm.nih. gov/pubmed/23933752. doi:10.1038/nn.3493PMID:23933752
23. Li YT, Ibrahim LA, Liu BH, Zhang LI, Tao HW. Linear transformation of thalamocortical input by intracor-tical excitation. Nature neuroscience. 2013; 16(9):1324–30. Available from:http://www.ncbi.nlm.nih. gov/pubmed/23933750. doi:10.1038/nn.3494PMID:23933750
24. Denman DJ, Contreras D. The Structure of Pairwise Correlation in Mouse Primary Visual Cortex Re-veals Functional Organization in the Absence of an Orientation Map. Cerebral Cortex. 2013;p. bht128–. Available from:http://cercor.oxfordjournals.org/content/early/2013/05/17/cercor.bht128.short. 25. Miller JK, Ayzenshtat I, Carrillo-Reid L, Yuste R. Visual stimuli recruit intrinsically generated cortical
en-sembles. Proceedings of the National Academy of Sciences. 2014 Sep; 111(38):E4053–4061. Avail-able from:http://www.pnas.org/content/111/38/E4053.abstract. doi:10.1073/pnas.1406077111 26. Tsodyks M, Kenet T, Grinvald A, Arieli A. Linking spontaneous activity of single cortical neurons and
the underlying functional architecture. Science. 1999 Dec; 286(5446):1943–6. Available from:http:// www.ncbi.nlm.nih.gov/pubmed/10583955. doi:10.1126/science.286.5446.1943PMID:10583955 27. Kenet T, Bibitchkov D, Tsodyks M, Grinvald A, Arieli A. Spontaneously emerging cortical
28. Hansen BJ, Chelaru MI, Dragoi V. Correlated Variability in Laminar Cortical Circuits. Neuron. 2012; 76 (3):590–602. Available from:http://www.ncbi.nlm.nih.gov/pubmed/23141070. doi:10.1016/j.neuron. 2012.08.029PMID:23141070
29. Smith MA, Jia X, Zandvakili A, Kohn A. Laminar dependence of neuronal correlations in visual cortex. Journal of neurophysiology. 2013; 109(4):940–7. Available from:http://www.ncbi.nlm.nih.gov/pubmed/ 23197461. doi:10.1152/jn.00846.2012PMID:23197461
30. Braitenberg V, Schüz A. Cortex: Statistics and Geometry of Neuronal Connectivity. 81. Springer; 1998.
31. Sadeh S, Cardanobile S, Rotter S. Mean-field analysis of orientation selectivity in inhibition-dominated networks of spiking neurons. SpringerPlus. 2014; 3:148. Available from:http://www.ncbi.nlm.nih.gov/ pubmed/24790806. doi:10.1186/2193-1801-3-148PMID:24790806
32. Sadeh S, Rotter S. Orientation Selectivity in Inhibition-Dominated Networks of Spiking Neurons: Effect of Single Neuron Properties and Network Dynamics. PLoS computational biology. 2015 Jan; 11(1): e1004045. Available from:http://dx.plos.org/10.1371/journal.pcbi.1004045. doi:10.1371/journal.pcbi. 1004045PMID:25569445
33. Fino E, Yuste R. Dense inhibitory connectivity in neocortex. Neuron. 2011; 69(6):1188–203. Available from:http://www.ncbi.nlm.nih.gov/pubmed/21435562. doi:10.1016/j.neuron.2011.02.025PMID: 21435562
34. Packer AM, Yuste R. Dense, unspecific connectivity of neocortical parvalbumin-positive interneurons: a canonical microcircuit for inhibition? The Journal of Neuroscience. 2011; 31(37):13260–71. Available from:http://www.ncbi.nlm.nih.gov/pubmed/21917809. doi:10.1523/JNEUROSCI.3131-11.2011PMID: 21917809
35. Rudolph M, Pospischil M, Timofeev I, Destexhe A. Inhibition determines membrane potential dynamics and controls action potential generation in awake and sleeping cat cortex. The Journal of Neurosci-ence. 2007; 27(20):5280–90. Available from:http://www.ncbi.nlm.nih.gov/pubmed/17507551. doi:10. 1523/JNEUROSCI.4652-06.2007PMID:17507551
36. Haider B, Häusser M, Carandini M. Inhibition dominates sensory responses in the awake cortex. Na-ture. 2013; 493(7430):97–100. Available from:http://www.ncbi.nlm.nih.gov/pubmed/23172139. doi:10. 1038/nature11665PMID:23172139
37. Batschelet E. Circular Statistics in Biology (Mathematics in biology). Academic Press Inc; 1981. 38. Ringach DL, Shapley RM, Hawken MJ. Orientation Selectivity in Macaque V1: Diversity and Laminar
Dependence. The Journal of Neuroscience. 2002; 22(13):5639–5651. Available from:http://www.ncbi. nlm.nih.gov/pubmed/12097515. PMID:12097515
39. Ricciardi LM. Diffusion Processes and Related Topics on Biology. Berlin: Springer-Verlag; 1977. 40. Brunel N. Dynamics of sparsely connected networks of excitatory and inhibitory spiking neurons.
Jour-nal of ComputatioJour-nal Neuroscience. 2000; 8(3):183–208. Available from:http://www.ncbi.nlm.nih.gov/ pubmed/10809012. doi:10.1023/A:1008925309027PMID:10809012
41. Hansel D, van Vreeswijk C. The Mechanism of Orientation Selectivity in Primary Visual Cortex without a Functional Map. The Journal of Neuroscience. 2012; 32(12):4049–4064. Available from:http://www. ncbi.nlm.nih.gov/pubmed/22442071. doi:10.1523/JNEUROSCI.6284-11.2012PMID:22442071 42. Pehlevan C, Sompolinsky H. Selectivity and Sparseness in Randomly Connected Balanced Networks.
PLoS ONE. 2014; 9(2):e89992. Available from:http://www.ncbi.nlm.nih.gov/pubmed/24587172. doi: 10.1371/journal.pone.0089992PMID:24587172
43. Rochefort NL, Narushima M, Grienberger C, Marandi N, Hill DN, Konnerth A. Development of direction selectivity in mouse cortical neurons. Neuron. 2011 Aug; 71(3):425–32. Available from:http://www.cell. com/article/S0896627311005186/fulltext. doi:10.1016/j.neuron.2011.06.013PMID:21835340 44. Sadeh S, Rotter S. Distribution of orientation selectivity in recurrent networks of spiking neurons with
different random topologies. PloS one. 2014 Jan; 9(12):e114237. Available from:http://www.
pubmedcentral.nih.gov/articlerender.fcgi?artid=4254981&tool = pmcentrez&rendertype = abstract. doi: 10.1371/journal.pone.0114237PMID:25469704
45. Pernice V, Staude B, Cardanobile S, Rotter S. Recurrent interactions in spiking networks with arbitrary topology. Physical Review E. 2012 Mar; 85(3 Pt 1):031916. Available from:http://www.ncbi.nlm.nih. gov/pubmed/22587132. doi:10.1103/PhysRevE.85.031916
46. Goldberg JA, Rokni U, Sompolinsky H. Patterns of ongoing activity and the functional architecture of the primary visual cortex. Neuron. 2004 May; 42(3):489–500. Available from:http://www.ncbi.nlm.nih. gov/pubmed/15134644. doi:10.1016/S0896-6273(04)00197-7PMID:15134644
48. Seriès P, Latham PE, Pouget A. Tuning curve sharpening for orientation selectivity: coding efficiency
and the impact of correlations. Nature Neuroscience. 2004; 7(10):1129–35. Available from:http://www. ncbi.nlm.nih.gov/pubmed/15452579. doi:10.1038/nn1321PMID:15452579
49. Cai D, Rangan AV, McLaughlin DW. Architectural and synaptic mechanisms underlying coherent spon-taneous activity in V1. Proceedings of the National Academy of Sciences. 2005 May; 102(16):5868–73. Available from:http://www.pubmedcentral.nih.gov/articlerender.fcgi?artid=556291&tool =
pmcentrez&rendertype = abstract. doi:10.1073/pnas.0501913102