www.biogeosciences.net/12/6915/2015/ doi:10.5194/bg-12-6915-2015
© Author(s) 2015. CC Attribution 3.0 License.
Biodegradability of dissolved organic carbon in permafrost
soils and aquatic systems: a meta-analysis
J. E. Vonk1,2, S. E. Tank3, P. J. Mann4, R. G. M. Spencer5, C. C. Treat6, R. G. Striegl7, B. W. Abbott8, and K. P. Wickland7
1Department of Earth Sciences, Utrecht University, Utrecht, the Netherlands 2Arctic Center, University of Groningen, Groningen, the Netherlands
3Department of Biological Sciences, University of Alberta, Edmonton, Canada 4Department of Geography, Northumbria University, Newcastle Upon Tyne, UK
5Department of Earth, Ocean & Atmospheric Science, Florida State University, Tallahassee, USA
6Earth Systems Research Center, Institute for the Study of Earth, Oceans, and Space, University of New Hampshire,
Durham, USA
7National Research Program, US Geological Survey, Boulder, Colorado, USA
8OSUR-UMR 6553 ECOBIO, Université de Rennes and Centre National de la Recherche Scientifique, Rennes, France
Correspondence to:J. E. Vonk ([email protected])
Received: 30 April 2015 – Published in Biogeosciences Discuss.: 8 June 2015
Revised: 13 November 2015 – Accepted: 19 November 2015 – Published: 3 December 2015
Abstract. As Arctic regions warm and frozen soils thaw, the large organic carbon pool stored in permafrost becomes increasingly vulnerable to decomposition or transport. The transfer of newly mobilized carbon to the atmosphere and its potential influence upon climate change will largely depend on the degradability of carbon delivered to aquatic ecosys-tems. Dissolved organic carbon (DOC) is a key regulator of aquatic metabolism, yet knowledge of the mechanistic con-trols on DOC biodegradability is currently poor due to a scarcity of long-term data sets, limited spatial coverage of available data, and methodological diversity. Here, we per-formed parallel biodegradable DOC (BDOC) experiments at six Arctic sites (16 experiments) using a standardized incuba-tion protocol to examine the effect of methodological differ-ences commonly used in the literature. We also synthesized results from 14 aquatic and soil leachate BDOC studies from across the circum-arctic permafrost region to examine pan-arctic trends in BDOC.
An increasing extent of permafrost across the landscape resulted in higher DOC losses in both soil and aquatic systems. We hypothesize that the unique composition of (yedoma) permafrost-derived DOC combined with limited prior microbial processing due to low soil temperature and relatively short flow path lengths and transport times,
1 Introduction
Boreal and Arctic ecosystems contain more than half of global terrestrial organic carbon (Tarnocai et al., 2009; Hugelius et al., 2014), part of which will be vulnerable to microbial processing and release to the atmosphere by the end of the century (Slater et al., 2013; Schaefer et al., 2014; IPCC, 2013). At high latitudes, ecosystem carbon balance depends largely on aquatic processes (Kling et al., 1992; Striegl et al., 2012; Vonk and Gustafsson, 2013) with lakes, wetlands, rivers, and streams covering more than half of the land surface in many regions (McGuire et al., 2009; Loveland et al., 2000; Lammers et al., 2001; Aufdenkampe et al., 2011; Avis et al., 2011). However, little is known about mechanistic controls on persistence or processing of organic carbon cur-rently flowing through Arctic watersheds (Mann et al., 2012; Wickland et al., 2012), and even less is known about the be-haviour of permafrost-derived organic carbon that is deliv-ered to arctic freshwater and marine ecosystems (Cory et al., 2013; Vonk and Gustafsson, 2013).
Arctic watersheds transport an average of 34 Tg C yr−1 of dissolved organic carbon (DOC) and 6 Tg C yr−1of par-ticulate organic carbon (POC) to the Arctic Ocean (Holmes et al., 2012; McGuire et al., 2009), not including fluxes from coastal erosion. Though no model projections of future circum-arctic hydrologic carbon flux exist, a few recent stud-ies predict that organic carbon loading to the circum-arctic watershed may increase in the future (Abbott et al., 2015; Laudon et al., 2012; Kicklighter et al., 2013). However, ob-served patterns of changes in hydrological carbon loading in permafrost regions are inconsistent, with increases in DOC export from areas with extensive peat deposits (Frey and McClelland, 2009), but decreases in discharge-normalized DOC export in other regions, due to increasing flow path lengths and increased mineralization in soils (McClelland et al., 2007; Petrone et al., 2006; Striegl et al., 2005; Tank et al., 2012). Furthermore, conflicting patterns of DOC biodegrad-ability exist with respect to seasonality and permafrost ex-tent (Kawahigashi et al., 2004; Striegl et al., 2005; Holmes et al., 2008; Balcarczyk et al., 2009; Frey and McClelland 2009; Vonk et al., 2013b; Abbott et al., 2014; Larouche et al., 2015). The scarcity of long-term data as well as a lack of conceptualization of the processes controlling DOC transport and processing represent an important source of uncertainty in the permafrost-regional carbon balance.
In both terrestrial and aquatic ecosystems, much of the overall carbon mineralization takes place in the dissolved form, since part of the DOC is composed of lower molecu-lar weight compounds that can be directly transported across microbial cell membranes (Battin et al., 2008), though partic-ulate matter provides surface area for bacterial attachment in aquatic ecosystems (del Giorgio and Pace, 2008). Biodegrad-able DOC (BDOC), therefore, is a key regulator of ecosys-tem metabolism in general and the rate of permafrost carbon release to the atmosphere specifically (Holmes et al., 2008;
Mann et al., 2012; Wickland et al., 2012; Abbott et al., 2014). While promising proxies of BDOC have been identified, in-cluding optical signatures, molecular characteristics and nu-trient concentrations (Balcarczyk et al., 2009; Wickland et al., 2012; Abbott et al., 2014), BDOC is typically assessed through incubation experiments, representing a simple met-ric of microbial uptake and mineralization. Throughout this study we will use BDOC as a measure of DOC biodegrad-ability. While incubation experiments carried out in the labo-ratory do not necessarily reflect in situ DOC biodegradability due to many differences including temperature, light, and mi-crobial community, they provide a useful relative measure of the reactivity of different types of DOC. Most studies mea-sure BDOC through: (i) production of dissolved inorganic carbon (DIC), (ii) consumption of DOC, or (iii) consump-tion of O2(McDowell et al., 2006). While these methods can
give comparable results, differences in experimental factors can directly influence the quantification of BDOC, includ-ing duration of incubation, temperature, light exposure, type of filtration, and the addition of bacterial inoculum. While this methodological diversity complicates direct comparison of BDOC measurements from across the Arctic permafrost-region, it also represents an opportunity to identify funda-mental controls on DOC processing.
We synthesized results from 14 BDOC studies within the Arctic Ocean watershed representing a total of 551 in-dividual incubations to identify controls and patterns of DOC biodegradability across spatial and temporal scales (Sect. 2.1). Based on findings from these studies we de-veloped a standard incubation method, which we tested on water from soils, streams, and rivers from throughout the permafrost region and across seasons (Sect. 2.2). We ex-amined the role of seasonality, permafrost extent, and incu-bation design (effect of inoculation) on metrics of BDOC and recommend a protocol for future BDOC incubations. A meta-analysis of the combined results of our standard-ized circum-arctic incubations and literature synthesis al-lowed us to identify temporal and landscape-scale patterns in BDOC across Arctic regions. This study represents the first to include both soils (soil leachates) and aquatic systems (streams, lakes, rivers) to explore geographical and seasonal patterns of BDOC in the Arctic.
2 Methods
2.1 Literature synthesis
We gathered and analysed data from permafrost-region BDOC studies that met the following criteria: (1) located in the Arctic Ocean watershed (including the Yukon River wa-tershed); (2) used DIC production (CO2 evasion) or DOC
res-piratory coefficients); and (3) incubation was performed in the dark to avoid autotrophic effects or photodegradation.
A total of 14 studies with experimental data on BDOC were found (Michaelson et al., 1998; Kawahigashi et al., 2004; Wickland et al., 2007, 2012; Holmes et al., 2008; Bal-carczyk et al., 2009; Roehm et al., 2009; Kiikkilä et al., 2011; Mann et al., 2012; Olefeldt et al., 2013a, b; Vonk et al., 2013a, b; Abbott et al., 2014). All time steps from the in-cubations were treated as single data points, thus not just the final DOC loss (e.g. if DOC concentration was measured at days 2, 7, and 14, we included the three points individually). We categorized the data (Table 1 and Fig. 2) by permafrost zone (no permafrost, discontinuous, or continuous), season-ality (day of year), filter pore size (0.22, 0.45, or 0.7 µm), BDOC method (DIC production or DOC loss), incubation time/duration (days), incubation temperature, use of inor-ganic nutrient additions (yes or no), sample agitation during the incubation (yes or no), incubation bottle size (ranging from 40 to 3000 mL), inoculum addition at start of experi-ment (yes or no), and oxygen availability (for soil incuba-tions: oxic or anoxic; all aquatic incubations were performed oxic). When an incubation was performed at “room tempera-ture” we assumed 20◦C. For watersheds crossing permafrost boundaries we chose the spatially dominant permafrost type. We sorted the data into soil leachate and aquatic incubations, with subclasses (for our categorical purposes) for the aquatic data: “lakes”, “streams” (< 250 km2), “large streams” (250
to 25 000 km2), “rivers” (25 000 to 500 000 km2)and “large
rivers” (> 500 000 km2).
2.2 Circum-arctic standardized incubation experiment In June to September of 2013 we performed BDOC experi-ments with leachates from three soil cores (from near Toolik Field Station, Alaska), water from two streams (Richardson Creek, Alaska; Y3, Siberia), and water from three major Arc-tic rivers (Yukon, Mackenzie and Kolyma Rivers; Fig. 1). Soil leachates were performed by adding 500 mL DI water to soil volumes of ca. 2 L, letting this stand for 24 h, and ex-tracting using a pore water sampler measuring total leachate volume extracted. Water samples were collected from the surface in pre-cleaned, pre-rinsed containers and transported (dark and cool) to filtration facilities within 12 h. We devel-oped an incubation methodology adapted for implementation at remote field sites to assure applicability to future work.
We measured DOC loss over time rather than O2 loss
or DIC production, as it did not require specialized sup-plies or instrumentation in the field. All samples were fil-tered through pre-combusted Whatman GF/F filters (nomi-nal pore size 0.7 µm), which are commonly used through-out the literature and can be pre-cleaned through combustion (450◦C > 4 h). We set up triplicate incubations with three dif-ferent treatments to test the effects of bacterial inoculation: (1) no inoculum, (2) 1 % inoculum by volume, (3) 10 % in-oculum by volume. Inocula consisted of 1.2 µm filtered water
(using pre-combusted (450◦C > 4 h) Whatman GF/C filters, 1.2 µm nominal pore size) that was added to sample waters (filtered at 0.7 µm) to the specified ratio.
We added 30 mL aliquots of sample into pre-combusted (550◦C > 4 h) 40 mL glass incubation vials and stored them at 20◦C in the dark, with no nutrient amendment. To ensure oxic conditions we left vial caps loose and shook samples once a day. The incubated samples were re-filtered through 0.7 µm filters (using pre-combusted glass filter tower units with 25 mm GF/F filters or a cleaned syringe filter assembly) to remove flocculation after 0, 2, 7, 14 and 28 days (using separate vials, in triplicate, for each time step). Re-filtration removes the majority of the microbial biomass, resulting in a measured DOC loss including both DOC mineralization and assimilation. Samples were immediately acidified with 30 µL of concentrated HCl (high quality grade; to pH≤2). Acidified sample vials were capped and stored refrigerated in the dark until analysis within 3 months. At the time of analysis, acidified samples were sparged with CO2 free air
for 8 min at 75 mL min−1 and run as non-purgable organic
carbon (NPOC) on either a Shimadzu TOC-V or TOC-L an-alyzer. DOC was calculated as the mean of between three and seven injections and the coefficient of variance was al-ways < 2 %. BDOC is reported in percent loss at time point
x(2, 7, 14 or 28 days) according to:
BDOC(%)T=x=((DOCT=0−DOCT=x) /DOCT=0)
×100 % (1)
2.3 Statistical analyses
We combined the literature meta-analysis of 14 papers (n= 551) with data from our circum-arctic incubation experiment (n=192). Each of the studies identified used different meth-ods for assessing BDOC, complicating and limiting possible analyses. To examine trends across the total data set (n= 743) we performed categorical principle component analy-sis (CATPCA) via optimal scaling. This approach allowed us to compare the effect of multiple variables with mixed measurement levels (scalar, nominal, ordinal). We then per-formed a standard principle component analysis (PCA) us-ing the optimally scaled results to aid in data interpretation. Data normality was assessed using the Shapiro-Wilk test (p> 0.05). The data were normal and did not require
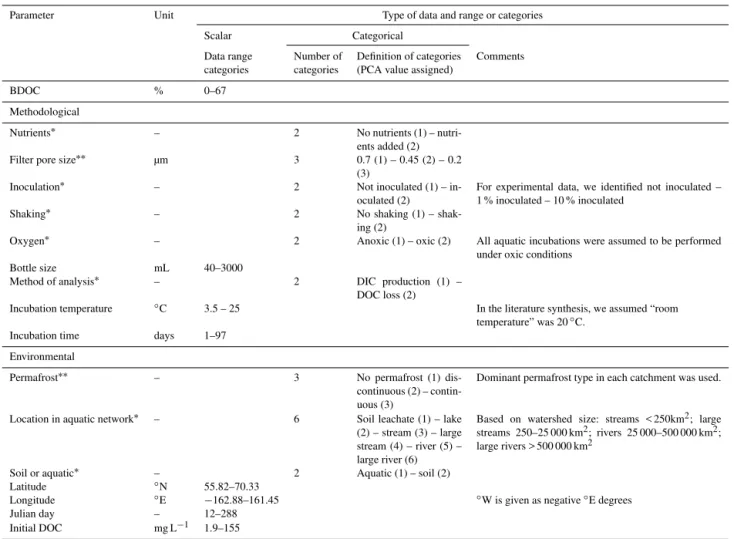
shak-Table 1. List of methodological and environmental parameters we included in our meta-analysis. Variables are classified as scalar (no symbol), nominal (*) and ordinal (**). For scalar parameters we have listed the data range, for categorical (nominal and ordinal) data we have listed the number of categories along with their definition.
Parameter Unit Type of data and range or categories
Scalar Categorical
Data range Number of Definition of categories Comments categories categories (PCA value assigned)
BDOC % 0–67
Methodological
Nutrients∗ – 2 No nutrients (1) –
nutri-ents added (2) Filter pore size∗∗ µm 3 0.7 (1) – 0.45 (2) – 0.2
(3)
Inoculation∗ – 2 Not inoculated (1) – in-oculated (2)
For experimental data, we identified not inoculated – 1 % inoculated – 10 % inoculated
Shaking∗ – 2 No shaking (1) –
shak-ing (2)
Oxygen∗ – 2 Anoxic (1) – oxic (2) All aquatic incubations were assumed to be performed under oxic conditions
Bottle size mL 40–3000
Method of analysis∗ – 2 DIC production (1) – DOC loss (2)
Incubation temperature ◦C 3.5 – 25 In the literature synthesis, we assumed “room temperature” was 20◦C.
Incubation time days 1–97
Environmental
Permafrost∗∗ – 3 No permafrost (1)
dis-continuous (2) – contin-uous (3)
Dominant permafrost type in each catchment was used.
Location in aquatic network∗ – 6 Soil leachate (1) – lake (2) – stream (3) – large stream (4) – river (5) – large river (6)
Based on watershed size: streams < 250km2; large streams 250–25 000 km2; rivers 25 000–500 000 km2; large rivers > 500 000 km2
Soil or aquatic∗ – 2 Aquatic (1) – soil (2) Latitude ◦N 55.82–70.33
Longitude ◦E −162.88–161.45 ◦W is given as negative◦E degrees
Julian day – 12–288
Initial DOC mg L−1 1.9–155
ing, nutrient addition, inoculum, oxygen availability, loca-tion in fluvial network) and ordinal data (filter pore size, and permafrost extent). We considered final rotated PCA correla-tions of > 0.7 as strong, between 0.5 and 0.7 as moderate, and < 0.5 as weak or absent (Quinn and Keough, 2002). Although this approach has drawbacks, in our opinion it proved the most representative methodology given the diverse data set which included repeated measures (i.e. multiple time points) of BDOC (Bradlow et al., 2002). Additionally, we combined data from all studies carried out with incubation tempera-tures between 15–25◦C and with incubation durations be-tween 28–34 days, which represented the most common tem-perature and duration in the meta-analysis, to test for envi-ronmental trends (Figs. 3, 4, 5). Here we tested for differ-ences among means using analysis of variance (ANOVA). All ANOVA, CATPCA, and PCA analyses were conducted in SPSS 22.
3 Results
3.1 Literature synthesis
Soil experiment
Soil literature
Aquatic experiment Aquatic literature
Figure 1.Map of the hydrological network (blue) in the Arctic Ocean watershed (boundary in red) with points showing literature data (blue for aquatic, red for soil) and experimental data (green for aquatic, orange for soil).
3.2 Methodological factors affecting BDOC
To examine the effects of inoculum addition and inocu-lum concentration on BDOC, we compared mean BDOC across our circum-arctic standardized incubation experiment (no inoculum, 1 and 10 % inoculum;n=40 per treatment). Amount of inoculum (1 % or 10 %) had no effect on the pro-portion of BDOC (ANOVA, p> 0.9). As the degree of in-oculation had no clear systematic effect on BDOC loss (see also methodological PCA results; Sect. 3.2.1) we grouped all inoculated data (independent of concentration), and all non-inoculated data during our ANOVA and environmental PCA analyses. In the sections below we examine the patterns present in the combined analysis of aquatic and soil literature results, including our circum-arctic incubation experiments.
3.2.1 Aquatic BDOC
Three principle components together explained 81 % of the variance among all aquatic incubation samples (PC1=46, PC2=23, PC3=12 %; Table 2). The first component did not correlate with BDOC but correlated positively with shak-ing durshak-ing incubation (r=0.97), the method used to measure DOC loss (r=0.91), incubation temperature (r=0.84), and
correlated negatively with bottle size (r= −0.77) and
pres-ence of inoculum (r= −0.51). Component 2 also did not
explain much variation in BDOC, but correlated with filter pore size (r=0.90), nutrient addition (r=0.90), and the use of inoculum (r=0.64). Component 3 explained the great-est proportion of BDOC variance (r= −0.83). Component 3 also closely correlated with incubation time (r= −0.85) and displayed a negative correlation with bottle size (r=0.54). Effect of oxygen availability was not examined in aquatic in-cubations, as all previously published experiments were con-ducted under oxic conditions.
3.2.2 Soil leachate BDOC
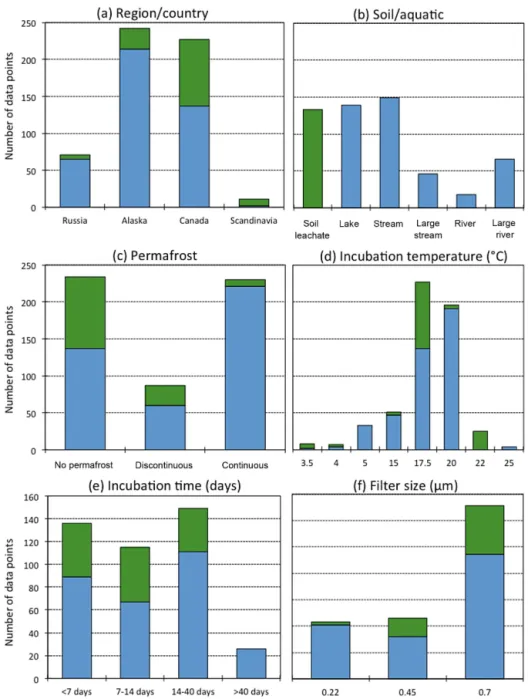
Figure 2.Histograms of environmental and methodological variety reported in the synthesized literature (n=426, see Sect. 2.3), with(a)
region/country,(b)soil leachate and type of aquatic study (categorized as streams (< 250 km2), large streams (> 250 and < 25 000 km2), rivers (> 25 000 and < 500 000 km2)and large rivers (> 500 000 km2)),(c)permafrost zonation,(d)incubation temperature in◦C,(e)incubation time (categorized in < 7 days, 7–14 days, 14–40 days, and > 40 days, and(f)filtration pore size (µm). Green represents soil leachate data, blue represents aquatic data. Theyaxis shows number of data points.
positively correlated to bottle size (r=0.74) and inoculum (r=0.57) and negatively related to temperature (r= −0.66)
and shaking (r= −0.57).
3.3 Environmental factors affecting BDOC
Similar to Sect. 3.2, here we present the statistical results of the fully grouped data set (i.e. inoculated and non-inoculated literature synthesis data, combined with the circum-arctic
in-cubation experiment data), concentrating on how environ-mental variables co-vary with BDOC losses.
3.3.1 Aquatic BDOC
Table 2.Correlations between methodological variables and BDOC for each principle component axis (1, 2, 3) in a structure matrix for aquatic incubations (530 data points) and soil incubations (202 data points). Correlations above 0.7 (in bold) are considered strong, and correlations above 0.5 (italic) as moderate. All aquatic samples were incubated under oxic conditions and so this was excluded from the PCA. Similarly, none of the soil incubations were nutrient-amended so this was excluded from PCA. The parameters are ordered based upon their importance to explaining axis 1. Variables are classified as scalar (no symbol), nominal (*) and ordinal (**).
Aquatic
1 2 3
Shaking∗
0.97 0.07 −0.46
Method C loss∗ 0.91 0.09 −0.30 Temperature 0.84 0.11 −0.18
Bottle size −0.77 0.08 0.54
Filter pore size∗∗ 0.34 0.90
−0.44
Nutrient addition∗ 0.37
0.90 −0.45
Inoculum∗∗ -0.51 0.64 0.32 Incubation time 0.34 0.12 −0.85
BDOC 0.23 0.26 −0.83
% variance explained 46 23 12
Soil
1 2 3
O2availability∗ 0.94 −0.16 −0.06
Method C loss∗ 0.87 −0.30 0.02
BDOC 0.75 0.37 −0.02
Shaking∗ 0.73 −0.05 -0.57 Incubation time 0.06 0.88 −0.13
Filter pore size∗∗
−0.25 0.74 0.25
Bottle size 0.06 0.10 0.74
Temperature −0.05 0.54 −0.66
Inoculum∗ −0.44 0.08 0.57
variance explained 34 21 16
the fluvial network (r=0.95), dominant permafrost type (r=0.94; greater BDOC in continuous permafrost regions, see also Fig. 3a), sample latitude (r=0.93), and initial DOC (r= −0.70). The second component was strongly negatively correlated with BDOC (r= −0.71), and was explained by
sample longitude (r=0.78). The third component did not correlate to BDOC but showed a strong correlation with sam-pling period (Julian day;r=0.95).
3.3.2 Soil leachate BDOC
Two components explained 77 % of the variance in en-vironmental parameters across soil leachate incubations (PC1=55 %, PC2=22 %; Table 3). BDOC was most closely correlated to component 1 (r=0.81), which was as-sociated with latitude (r=0.97) and dominant permafrost type (r=0.96; greater BDOC in continuous permafrost
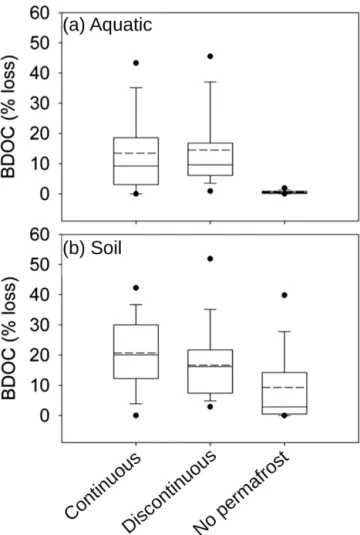
re-Figure 3. (a)Aquatic and(b)soil leachate BDOC data (15–25◦C,
n=205) after 28–34 days incubation across dominant permafrost
type from literature-synthesis and our circum-arctic experiment. The data are shown as 5th to 95th percentiles (points), 25th, 50th, and 75th percentiles (lines), median value (bold line) and mean value (dashed line). The number of data points used are listed below the box plots.
gions; see also Fig. 3b), and initial DOC (r= −0.83). The second component did not correlate with BDOC but was pos-itively correlated to longitude (r=0.79) and sampling period (Julian day;r=0.78).
4 Discussion
4.1 Methodological factors influencing BDOC
stud-Table 3.Correlations between environmental variables and BDOC for each principle component axis in a structural matrix for aquatic incubations (505 data points) and soil incubations (165 data points). Correlations above 0.7 (in bold) are considered strong, and corre-lations above 0.5 (italic) as moderate. The parameters are ordered based upon their importance to explaining factor 1. Variables are classified as scalar (no symbol), nominal (*) and ordinal (**). Lo-cation in stream network, i.e. streams, large streams, rivers and large rivers, is indicated as “network”.
Aquatic
1 2 3
Network∗ 0.95 −0.05 −0.21 Permafrost∗∗
0.94 0.05 −0.06
Latitude 0.93 0.06 −0.07
DOC initial −0.70 −0.11 0.47
Longitude 0.41 0.78 0.12
BDOC 0.51 −0.71 −0.05
Julian day −0.14 0.11 0.95
% variance explained 52 18 13
Soil
1 2
Latitude 0.97 −0.08
Permafrost∗∗
0.96 −0.13
DOC initial −0.83 0.30
BDOC 0.81 0.15
Longitude −0.22 0.79
Julian day 0.06 0.78
% variance explained 55 22
ies. Despite total DOC loss increasing with longer incubation time, the rate of DOC loss decreases over time.
Soil leachate BDOC was not clearly affected by incubation time across experiments (Table 2). We suggest that the effects of incubation time may have been masked by multiple ad-ditional methodological factors significantly influencing the soil BDOC experiments in particular. For example, the pres-ence of O2within incubations or regular bottle shaking
ap-peared to play a crucial role in soil BDOC losses (Table 2). As soil extractions typically have higher initial DOC concen-trations (despite some degree of dilution applied in the exper-iment), they may be more susceptible to oxygen drawdown, increasing the importance of regular bottle shaking. Also, the method of assessing carbon loss appeared to play a critical role in the amount of BDOC measured during soil incuba-tions, but not so clearly in aquatic experiments. This finding contradicts with the finding of McDowell et al. (2006) that found largely comparable results between available methods. We compared different methods conducted on different sam-ples, which may explain our contrasting findings.
(
b)
(
a)
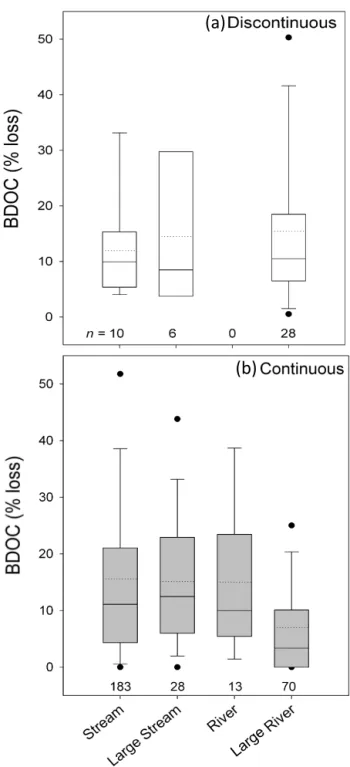
Figure 4. Aquatic BDOC data for 15–25◦C after 28–34 days incubation for streams (< 250 km2), large streams (> 250 km2, < 25 000 km2), rivers (> 25 000 km2, < 500 000 km2), and large rivers (> 500 000 km2)clustered for(a)discontinuous and(b)
con-tinuous permafrost zones. Symbology as in Fig. 3. A plot for “no permafrost regions” is not shown as here only BDOC data for rivers were available (median BDOC=0.44 %, mean BDOC=0.69 %;
n=25). The number of data points used are listed below the box
4.2 Environmental factors influencing BDOC
4.2.1 Permafrost extent and longitude
Aquatic and soil BDOC losses were significantly lower in re-gions without permafrost than in discontinuous or continuous permafrost regions (Fig. 3). This could be explained by shal-lower hydrologic flow paths in permafrost-affected regions, which would constrain water flow, and DOC origin, to rel-atively shallow soils. Or, alternrel-atively, the unique dissolved organic matter (DOM) composition of yedoma permafrost (Abbott et al., 2014; Spencer et al., 2015), containing high levels of aliphatics and carbohydrates, could allow for more rapid degradation after thaw. Yedoma permafrost occupies a part of the continuous permafrost domain and its unique composition will therefore contribute to the composition of the DOC release from continuous permafrost. Furthermore, permafrost DOM is relatively well-preserved due to limited processing of organic carbon in soils under long-term frozen conditions (Khvorostyanov et al., 2008; Schuur et al., 2008), though permafrost-derived DOC still shows signs of process-ing (Wickland et al., 2012; Abbott et al., 2014). Continu-ous permafrost regions thus seem to receive relatively well-preserved, unique DOC into soil leachates and aquatic sys-tems leading to higher losses, whereas discontinuous per-mafrost regions and regions without perper-mafrost receive DOC that has already been subject to some degree of degradation. The presence of permafrost also impacts hydrological flow-paths and transport times, which may result in a more effi-cient delivery of relatively less-processed terrestrial DOC to aquatic systems (Striegl et al., 2005; Walvoord et al., 2012). Alternatively, preferential sorption of specific compounds, freeze-thaw effects, or sub-zero metabolism in permafrost could increase DOC biodegradability (Abbott et al., 2014 and references therein). The difference in BDOC with per-mafrost extent is stronger in soils than in aquatic systems (Table 3, Fig. 3), likely attributable to a fresher, less altered permafrost DOC signature in soils compared to aquatic DOC that has already undergone some processing. Newly leached DOC from yedoma permafrost soils, representing part of our continuous permafrost soil data (Fig. 1), will be subject to more rapid degradation (Spencer et al., 2015).
Aquatic BDOC was negatively correlated with longitude. Judging from the prevailing geographical regions in the data set (Fig. 1) this suggests that aquatic BDOC in Alaska and Canada was on average higher than in Eastern Siberia. This could be related to a combination of the spatial spread in our data set with the distribution of yedoma. Yedoma is Pleistocene-aged permafrost (Zimov et al., 2006) predomi-nantly present in northeast Siberia, but also in Alaska and NW Canada (Kanevskiy et al., 2011), that releases extremely biolabile DOC upon thaw (BDOC between 40–65 % after 30–40 days of incubation, Vonk et al., 2013b; Abbott et al., 2014). In our meta-analysis, most of the aquatic BDOC
in-Figure 5.Seasonal BDOC losses (shown against Julian day) at 15–25◦C after 28–34 days incubation for (a)soil leachates, (b) streams and(c)clustered large streams, rivers and large rivers for regions without permafrost, discontinuous permafrost and continu-ous permafrost. Trend lines denote significant relationships where present. Solid line represents linear fit in discontinuous permafrost (r2=0.33, p=0.0003) and dashed line continuous permafrost
(r2=0.29,p< 0.0001).
Figure 6.BDOC losses (at 20◦C) after 28-day incubation for soil leachates from three cores collected near Toolik, Alaska, as part of our circum-arctic incubation experiment (see Sect. 2.1). Soil leachates were collected and incubated both in spring (circles) and fall (diamonds). The three cores are indicated in blue (core 1), or-ange (core 2), and green (core 3). In core 1 we observed active plant growth during the spring and fall incubations.
4.2.2 Patterns within the fluvial network
In continuous permafrost regions, aquatic BDOC changes within the fluvial network (Fig. 4). Here, large rivers (de-fined as watersheds larger than 500 000 km2)showed
signif-icantly lower BDOC than streams, large streams, and rivers. We should note here that streams (< 250 km2,n=149) and
large rivers (> 500 000 km2, n=60) are over-represented
in the continuous permafrost data set, when compared to large streams (250–25 000 km2,n=46) and rivers (25 000–
500 000 km2,n=18). Nevertheless, this suggests that
con-tinuous permafrost regions may release DOC that degrades more rapidly with the movement from headwaters to larger rivers in the fluvial network than DOC that is released from discontinuous permafrost regions or regions without per-mafrost. Pleistocene yedoma could be such a source, as its strong degradation potential (Vonk et al., 2013a, b; Abbott et al., 2014) leads to preferential utilization in headwater streams (Mann et al., 2015; Spencer et al., 2015).
4.2.3 Seasonality
BDOC decreased with Julian day for large streams, rivers and large rivers (Fig. 5c) in both continuous and discontin-uous permafrost regions, whereas streams (Fig. 5b) and soil leachates (Fig. 5a) showed no seasonal pattern. This pattern may be associated with shifts in carbon source (winter and spring DOC in several Arctic rivers is more biolabile than in summer; Wickland et al., 2012; Mann et al., 2012; Holmes et al., 2008) but it is likely more related to a changing hy-drologic residence time. In boreal and Arctic systems soil thaw-depth increases throughout the summer, resulting in
longer water residence times in soils and headwater streams (Harms and Jones, 2012; Jones and Rinehart, 2010; Koch et al., 2013). This allows more time for biodegradable carbon compounds to be mineralized before reaching the river late in the season, effectively reducing measured BDOC in higher-order streams and rivers later in the season. Increasing wa-ter temperature through the season could magnify this effect with little mineralization early in the year when soils and streams are cold but accelerating biolabile carbon removal in summer. Hydrologic connectivity between soils and sur-face waters is generally weaker later in summer (Striegl et al., 2005; Spencer et al., 2008; Koch et al., 2013), which could explain the absence of seasonal trends for soils and streams (Fig. 5a, b). Furthermore, soil core leachates from a near-surface core that developed fresh plant growth during the growing season showed higher BDOC than cores without fresh plant growth (Fig. 6). These local plant growth-induced spikes in BDOC, likely induced by root exudates (Marschner and Kalbitz, 2003) could also mask seasonal trends in soil leachate BDOC and instead highlight spatial variability.
4.2.4 Other factors affecting BDOC
There are multiple factors that affect in situ BDOC that nei-ther we nor the investigated literature studies have consid-ered. One of these factors is the effect of light. Photochem-ical processes can lead to rapid DOC losses (up to 30 % in 14 days; Mann et al., 2012) and may alter the DOC compo-sition so that it is more susceptible to microbial degradation (Cory et al., 2013; Laurion and Mladenov, 2013). The pres-ence of clay minerals can affect photochemical decomposi-tion of DOC (Tietjen et al., 2005). Furthermore, POC also serves as an important catalyst in DOC biolability (Battin et al., 2008). In this study we do not investigate any poten-tial co-metabolizing effects of POC degradation, or for the biodegradability of POC itself, which could be substantial (Sánchez-García et al., 2011; Richardson et al., 2013).
Something we could not directly address in our synthesis was the effect of DOM composition, which can be related to the depth of the active layer and the associated retention of certain fractions of the DOC pool. For example, sugars and microbially derived organic matter appear more biolabile than plant-derived organic matter (Balcarczyk et al., 2009; Mann et al., 2012). Also, permafrost DOM appears to be en-riched in hydrogen-rich, aliphatic compounds that are prefer-entially degraded in incubation experiments (Spencer et al., 2015). The preferential degradation of biolabile components of the bulk DOC results in an enrichment of more recalcitrant components in soil pore waters (Wickland et al., 2007) and in larger rivers downstream (Spencer et al., 2015).
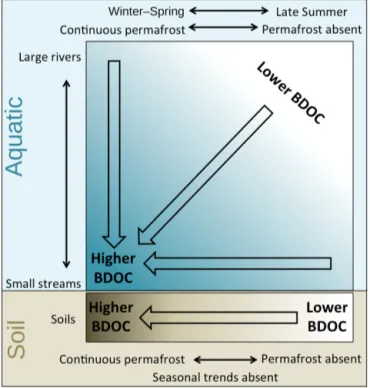
cor-Figure 7.Conceptual graph of landscape-scale and seasonal trends in % BDOC where the upper blue box represents aquatic systems, and the lower brown box represents soils. Aquatic BDOC increases with decreasing catchment area, and aquatic and soil BDOC in-crease with increasing permafrost extent in the landscape. Aquatic BDOC in watersheds varies temporally, with more BDOC found in winter and spring than late summer.
relation in our meta-analysis and other studies show little re-sponse of BDOC to inorganic nutrient additions (Abbott et al., 2014; Mann et al., 2015).
4.3 Circum-arctic patterns in BDOC
4.3.1 Geographical and seasonal patterns in BDOC We identified distinct large-scale patterns in the biodegrad-ability of DOC, which we illustrate in a conceptual diagram (Fig. 7). The percentage BDOC in both soil and aquatic systems increased from regions without permafrost to re-gions with continuous permafrost. We attribute this increase to better preservation of DOC in permafrost regions where frozen storage has limited processing of the soil organic mat-ter, and to stronger hydrologic connectivity between terres-trial and aquatic systems. Furthermore, within aquatic net-works, BDOC was lower in large river systems compared with streams, and this pattern was most pronounced in con-tinuous permafrost regions. This suggests that concon-tinuous permafrost regions release DOC sources such as Pleistocene yedoma that degrade rapidly in the fluvial network (Vonk et al., 2013b; Abbott et al., 2014; Mann et al., 2015; Spencer et al., 2015).
Aquatic BDOC in large streams and rivers decreased as the Arctic summer progressed. This pattern was absent for soils and streams. This could be related to a variety of fac-tors such as seasonal shifts in carbon sources, changing DOC residence time related to increasing thaw-depth, increasing water temperatures later in the summer, as well as decreas-ing hydrologic connectivity between soils and surface wa-ters when the season progresses. Alternatively, the integrat-ing character of rivers and larger streams could mask local-scale heterogeneity that is more apparent in small streams and soil leachates.
4.3.2 Circum-arctic fluxes of BDOC
Evaluating aquatic DOC export fluxes through sampling at river mouth locations near the Arctic Ocean underestimates the importance of the fluvial network for processing DOM. Literature estimates of watershed-scale aquatic C gas fluxes vary widely between 0.5 and 10 gC m−2yr−1 (all
normal-ized to catchment area; Striegl et al., 2012; Lundin et al., 2013; Denfeld et al., 2013; Crawford et al., 2013). When ex-trapolated to the Arctic Ocean watershed (20.5×10⁶km2; Holmes et al., 2013) this could result in a total gaseous C emission between 10 and 200 Tg C yr−1. These estimates seem reasonable compared to an annual Arctic Ocean water-shed DOC flux of 34 Tg (Holmes et al., 2012), where 34 Tg is based on river mouth monitoring and ignores processing within the watershed prior to arriving at the river mouth. Also, a significant fraction of the emitted flux originates from weathering and soil respiration sources (Striegl et al., 2005; Humborg et al., 2009).
Wickland et al. (2012) estimated that the combined BDOC exported by the six largest Arctic rivers to the Arctic Ocean is 2.3 Tg C yr−1, based on empirical relations between BDOC
ef-fects of permafrost thaw on BDOC inputs to streams are not yet well characterized.
4.4 Method considerations and recommendations In order to compare BDOC losses across Arctic, and alter-nate systems, it is crucial to standardize the methods with which biodegradability is assessed. Our meta-analysis high-lighted the significant variability in incubation design across the currently available literature making robust comparisons of BDOC across studies challenging. We suggest the follow-ing DOC incubation method, which is intentionally kept sim-ple to be feasible at more remote field sites (a more detailed protocol is available in the supplementary information). Ad-ditionally, we suggest a few optional protocol steps that could be used to assess further environmental controls on BDOC.
4.4.1 Standardized DOC incubation protocol
– As soon as possible after collection, filter water samples through pre-combusted (450◦C > 4 h) 0.7 µm glass fiber filters and chill (ca. 4◦C) until ready to incubate. – Rapid incubation setup is strongly recommended since
many biolabile DOC compounds have turnover times of hours. We advocate against freezing samples due to DOC flocculation, compositional and structural changes in the DOC, and bacterial viability (Fellman et al., 2008).
– Decant filtrate into triplicate sets of 40 mL pre-combusted (550◦C > 4 h) glass vials, and fill each vial with 30 mL filtrate. Use a triplicate glass vial set for each time point in your incubation. We recommend five time points at which one triplicate set will be consec-utively removed from incubation:T=0,T=2,T =7,
T =14 andT =28 days. Use clean caps with silicone or teflon septa (avoid rubber which can leach DOC). Potentially, a longer time step (T =90; e.g. Holmes et al., 2008) can be added to assess less labile DOC. In that case, we also recommend assessing DIC production (see additional protocol steps, below) as this method is more sensitive in detecting small changes. We want to point out, however, that the majority of the incubations will respond within 28 days, and longer incubations will introduce issues such as bottle effects.
– Our reasons for recommending 40mL glass vials are several; they are commonly available, they can be cleaned through pre-ashing, the required total volume per incubation is relatively small but sufficient for anal-ysis, and our analyses suggest that variation in bottle size may affect BDOC results.
– Inoculation of samples is not needed as filtration through 0.7 µm allows for a sufficient amount of bac-teria to pass the filter.
– Incubate the vials in the dark (to avoid autotrophic res-piration and photodegradation), with loose caps and reg-ular shaking to avoid oxygen-depletion.
– We recommend performing sample incubation at room temperature (20◦C), as this is most common, relatively easy to maintain, and allows comparison between stud-ies. This will provide the potential BDOC as 20◦C is generally above ambient temperature. Document the temperature throughout the experiment precisely. ⇒If possible, the incubations should be carried out at a stable temperature for example by using an oven or incubator.
– Re-filter the incubated samples through pre-combusted (450◦C > 4 h) 0.7 µm filters (to avoid problems with flocculation and remove most microbial biomass) for each time step. Store the filtered samples in pre-combusted (550◦C > 4 h) 40 mL glass vials, acidify to pH 2 with 30 µL concentrated HCl. Cap tightly and store dark and chilled until analysis.
– For logistical reasons, we recommend assessment of BDOC through DOC loss (see Eq. 1).
– For details regarding DOC analysis, see the supple-mentary information. Note that samples with low initial DOC concentrations may approach the detection limit of OC analyzers.
4.4.2 Additional protocol steps
– Ambient incubation temperature: incubate at the ambi-ent temperature of the water or soil from where the sam-ple was collected to allow for application of results to ambient conditions. Run control incubations at 20◦C.
– Nutrient amendment: because the effect of nutrients on DOC processing is unclear, we recommend run-ning experiments both with and without added nutri-ents. Amount of added nutrients should be adapted in relation to initial nutrient concentration according to the Redfield ratio, but in general an amendment of NO−
3
(to a concentration of 80 µm), NH+
4 (80 µm) and PO34−
(10 µm; Holmes et al., 2008) is appropriate for aquatic and soil leachates. Run control incubations without nu-trient amendment.
– DIC production: if field and laboratory settings allow we recommend also assessing C loss through DIC pro-duction, to provide BDOC estimates through two inde-pendent methods. We suggest to measure the CO2
con-centration in the headspace of the incubation flask and calculate the change in DIC (headspace CO2 plus
dis-solved CO2, carbonate, and bicarbonate in the aqueous
Keep all other parameters (such as filter pore size, in-cubation temperature, and approximate sample volume) similar to the control incubation that measures DOC loss.
– Light incubation: dark incubations eliminate effects of autotrophic respiration and photodegradation; however to simulate realistic DOC drawdown, light is a critical factor (Mann et al., 2012; Cory et al., 2013).
– DOC “quality” (composition) measurements: If possi-ble, we recommend assessing DOM compositional in-formation for, at least, initial water samples or soil leachates and, if possible, also on incubated waters and soil leachates (i.e., post-incubation). These mea-sures may include optical properties (specific ultraviolet absorbance, fluorescence excitation-emission matrices), and compound-specific analyses (carbohydrates, amino acids, lignin phenols, Fourier transform ion cyclotron resonance mass spectrometry, etc.). Note that short sam-ple storage times are desirable for most analyses.
5 Conclusions
Half of the global belowground soil OC pool is stored in circum-arctic permafrost but little is known about the pro-cesses controlling transport and degradation of DOC, a key regulator of the rate of permafrost carbon release from the Arctic watershed to the atmosphere. We synthesized results from 14 BDOC studies from the permafrost region and com-plemented this with novel BDOC data determined using a standardized method from across the Arctic. We observed a large variability in soil and aquatic BDOC, even under uni-form conditions. Despite the significant heterogeneity, we found that both soil and aquatic DOC is more biodegradable in regions with continuous permafrost compared to regions without permafrost. Within continuous permafrost regions, the degradability of DOC decreased from headwater streams to larger river systems, suggesting that permafrost DOC is preferentially utilized within the network. Furthermore, we discovered that aquatic BDOC in large streams and rivers de-creased as the Arctic summer progressed, whereas this pat-tern was absent for soils and small streams.
Based on our synthesis of BDOC studies and additional measurements, we predict that slow future transformation of continuous permafrost into discontinuous permafrost re-gions could release an initial, relatively short-term, pulse of biodegradable DOC but will on longer timescales possibly lead to the release of DOC that is more recalcitrant. The to-tal gaseous watershed C flux may, however, increase as more DOC could be processed within soils prior to release into aquatic networks due to deeper thaw depths and increasing residence time (Striegl et al., 2005). Furthermore, a length-ening of the arctic summer thaw period could result in lower
DOC biodegradability in large streams and rivers, but higher biodegradability in small streams and soils.
The Arctic is changing, and so is the coupling between its carbon and hydrologic cycles. There still are large uncer-tainties related to processing and transport of DOC, and few data are available from northern Canada and Russia, from discontinuous permafrost regions, and across all seasons. We strongly recommend that future studies of DOC degradabil-ity assess BDOC by means of our standardized DOC incu-bation protocol, to facilitate optimal use and integration of future data sets with existing knowledge.
The Supplement related to this article is available online at doi:10.5194/bg-12-6915-2015-supplement.
Acknowledgements. We would like to thank Greg Fiske for help with spatial analyses and creating Fig. 1. For financial support, we would like to thank the Dutch NWO (Veni grant #863.12.004), the Permafrost Carbon Network, and the US-NSF (Arctic Great Rivers Observatory, The Polaris Project #1044610, and Detecting the signature of permafrost thaw in Arctic rivers #1203885; #1500169), NSERC Discovery and Northern Research Supplement funds, the Graduate School at the University of New Hampshire, and USGS Climate and Land Use and Water Mission Areas. For field and laboratory support we would like to thank the Aurora Research Station in Inuvik, NWT/Canada, North-East Science Station, Cherskii/Russia (Nikita Zimov, Anya Davydova), the Woods Hole Research Center (Ekaterina Bulygina, Sue Natali), and Travis Drake (USGS). We thank Britta Voss (USGS) and Travis Drake (USGS) for comments on an early draft. Any use of trade or product names is for descriptive purposes only and does not imply endorsement by the US Government.
References
Abbott, B. W., Jones, J. B., Schuur, E. A. G., Chapin III, F. S., Bow-den, W. B., Bret-Harte, M. S., Epstein, H. E., Flannigan, M. D., Harms, T. K., Hollingsworth, T. N., Mack, M. C., McGuire, A. D., Natali, S. M., Rocha, A. V., Tank, S. E., Turetsky, M. R., Vonk, J. E., Wickland, K. P., and the Permafrost Carbon Net-work: Biomass offsets little or none of permafrost carbon release from soils, streams, and wildfire. An expert assessment, Environ. Res. Lett., submitted, 2015.
Abbott, B. W., Larouche, J. R., Jones, J. B., Bowden, W. B., and Balser, A. W.: Elevated dissolved organic carbon biodegradabil-ity from thawing and collapsing permafrost, J. Geophys. Res., 119, 2049–2063, 2014.
Aufdenkampe, A. K., Mayorga, E., Raymond, P. A., Melack, J. M., Doney, S. C., Alin, S. R., Aalto, R. E., and Yoo, K.: Riverine coupling of biogeochemical cycles between land, oceans, and at-mosphere, Front. Ecol. Environ., 9, 53–60, 2011.
Avis, C. A., Weaver, A. J., and Meissner, K. J.: Reduction in areal extent of high-latitude wetlands in response to permafrost thaw, Nat. Geosci., 4, 444–448, 2011.
Balcarczyk, K. L., Jones, J. B., Jaffé, R., and Maie, N.: Stream dissolved organic matter bioavailability and composition in wa-tersheds underlain with discontinuous permafrost, Biogeochem-istry, 94, 255–270, 2009.
Battin, T. J., Kaplan, L. A., Findlay, S., Hopkinson, C. S., Marti, E., Packman, A. I., Newbold, J. D., and Sabater, F.: Biophysical con-trols on organic carbon fluxes in fluvial networks, Nat. Geosci. 1, 95–100, 2008.
Bradlow, E. T.: Exploring repeated measures data sets for key fea-tures using principal components analysis, Intern. J. Res. Mar-ket., 19, 167–179, 2002.
Cory, R. M., Crump, B. C., Dobkowski, J. A., and Kling, G. W.: Surface exposure to sunlight stimulates CO2release from
per-mafrost soil carbon in the Arctic, P. Natl. Acad. Sci. USA, 110, 3429–3434, 2013.
Crawford, J. T., Striegl, R. G., Wickland, K. P., Dornblaser, M. M., and Stanley, E. H.: Emissions of carbon dioxide and methane from a headwater stream network of interior Alaska, J. Geophys. Res.-Biogeosci., 118, 482–494, 2013.
del Giorgio, P. A. and Pace, M. L.: Relative independence of dis-solved organic carbon transport and processing in a large tem-perate river: The Hudson River as both pipe and reactor, Limnol. Oceanogr. 53, 185–197, 2008.
Denfeld, B. A., Frey, K. E., Sobczak, W. V., Mann, P. J., and Holmes, R. M.: Summer CO2evasion from streams and rivers in the Kolyma River basin, north-east Siberia, Polar Res., 32, 19704, doi:/10.3402/polar.v32i0.19704, 2013.
Fellman, J. B., D’Amore, D. V., and Hood, E.: An evaluation of freezing as a preservation technique for analyzing dissolved or-ganic C, N and P in surface water samples, Sci. Total Environ. 392, 305–312, 2008.
Frey, K. E. and McClelland, J. W.: Impacts of permafrost degrada-tion on arctic river biogeochemistry, Hydrol. Process., 23, 169– 182, 2009.
Harden, J. W., Koven, C. D., Ping, C.-L., Hugelius, G., McGuire, A. D., Camill, P., Jorgenson, T., Kuhry, P., Michaelson, G. J., O’Donnell, J. A., Schuur, E. A. G., Tarnocai, C., Johnson, K., and Grosse, G.: Field information links permafrost carbon to
physi-cal vulnerabilities of thawing, Geophys. Res. Lett., 39, L15704, doi:10.1029/2012GL051958, 2012.
Harms, T. K. and Jones, J. B.: Thaw depth determines reaction and transport of inorganic nitrogen in valley bottom permafrost soils, Glob. Change Biol. 18, 2958–2968, 2012.
Harms, T. K., Abbott, B. W., and Jones, J. B.: Thermo-erosion gul-lies increase nitrogen available for hydrologic export, Biogeo-chemistry, 117, 299–311, 2014.
Holmes, R. M., McClelland, J. W., Raymond, P. A., Frazer, B. B., Peterson, B. J., and Stieglitz, M.: Lability of DOC transported by Alaskan rivers to the Arctic Ocean, Geophys. Res. Lett., 35, L03402, doi:10.1029/2007GL032837, 2008.
Holmes, R. M., McClelland, J. W., Peterson, B. J., Tank, S. E., Bu-lygina, E., Eglinton, T. I., Gordeev, V. V., Gurtovaya, T. Y., Ray-mond, P. A., Repeta, D. J., Staples, R., Striegl, R. G., Zhulidov, A. V., and Zimov, S. A.: Seasonal and annual fluxes of nutrients and organic matter from large rivers to the Arctic Ocean and sur-rounding seas, Estuar. Coast., 35, 369–382, 2012.
Holmes, R. M., Coe, M. T., Fiske, G. J., Gurtovaya, T., McClel-land, J. W., Shiklomanov, A. I., Spencer, R. G. M., Tank, S. E., and Zhulidov, A. V.: Climate change impacts on the hydrology and biogeochemistry of Arctic rivers, in: Climatic Change and Global Warming of Inland Waters: Impacts and Mitigation for Ecosystems and Societies, edited by: Goldman, C. R., Kuma-gai, M., and Robarts, R. D., John Wiley & Sons, Ltd, Chichester, United Kingdom, 3–26, 2013.
Hugelius, G., Strauss, J., Zubrzycki, S., Harden, J. W., Schuur, E. A. G., Ping, C.-L., Schirrmeister, L., Grosse, G., Michaelson, G. J., Koven, C. D., O’Donnell, J. A., Elberling, B., Mishra, U., Camill, P., Yu, Z., Palmtag, J., and Kuhry, P.: Estimated stocks of circumpolar permafrost carbon with quantified uncertainty ranges and identified data gaps, Biogeosciences, 11, 6573–6593, doi:10.5194/bg-11-6573-2014, 2014.
Humborg, C., Mörth, C.-M., Sundbom, M., Borg, H., Blenckner, T., Giesler, R., and Ittekkot, V.: CO2supersaturation along the aquatic conduit in Swedish watersheds as constrained by ter-restrial respiration, aquatic respiration and weathering, Glob. Change Biol., 16, 1966–1978, 2009.
IPCC: Climate Change 2013: The physical science basis, Contribu-tion of Working group I to the Fifth Assessment Report of the In-tergovernmental Panel on CLimate Change, edited by: Stocker, T. F., Qin, D., Plattner, G.-K., Tignor, M. M. B., Allen, S. K., Boschung, J., Nauels, A., Xia, Y., Bex, V., and Midgley, P. M., Cambridge University Press, Cambridge, UK and New York, USA, 1535 pp., 2013.
Jones, J. B. and Rinehart, A. J.: The long-term response of stream flow to climatic warming in headwater streams of interior Alaska, Can. J. For. Res. 40, 1201–1218, 2010.
Kalbitz, K., Schmerwitz, J., Schwesig, D., and Matzner, E.: Biodegradation of soil-derived dissolved organic matter as re-lated to its properties, Geoderma, 113, 273–291, 2003.
Kanevskiy, M., Shur, Y., Fortier, D., Jorgenson, M. T., and Stephani, E.: Cryostratigraphy of late Pleistocene syngenetic permafrost (yedoma) in northern Alaska, Itkillik River exposure, Quat. Re., 75, 584–596, 2011.
Keuper, F., van Bodegom, P. M., Dorrepaal, E., Weedon, J. T., van Hal, J., van Logtestijn, P., and Aerts, R.: A frozen feast: thawing permafrost increases plant-available nitrogen in subarctic peat-lands, Glob. Change Biol., 18, 1998–2007, 2012.
Khvorostyanov, D. V., Ciais, P., Krinner, G., and Zimov, S. A.: Vulnerability of East Siberia’s frozen carbon stores to future warming, Geophys. Res. Lett., 35, L10703, doi:10.1029/2008GL033639, 2008.
Kicklighter, D. W., Hayes, D. J., McClelland, J. W., Peterson, B. J., McGuire, A. D., and Melillo, J. M.: Insights and issues with sim-ulating terrestrial DOC loading of Arctic river networks, Ecol. Appl., 23, 1817–1836, 2013.
Kiikkilä, O., Kitunen, V., and Smolander, A.: Properties of dis-solved organic matter derived from silver birch and Norway spruce stands: degradability combined with chemical character-istics, Soil Biol. Biochem., 43, 421–430, 2011.
Kling, G. W., Kipphut, G. W., and Miller, M. C.: The flux of CO2 and CH4from lakes and rivers in Arctic Alaska, Hydrobiologia,
240, 23–36, 1992.
Koch, J. C., Runkel, R. L., Striegl, R., and McKnight, D. M.: Hy-drological controls on the transport and cycling of carbon and nitrogen in a boreal catchment underlain by discontinuous per-mafrost, J. Geophys. Res., 118, 698–712, 2013.
Lammers, R. B., Shiklomanov, A. I., Vorosmarty, C. J., Fekete, B. M., and Peterson, B. J.: Assessment of contemporary Arctic river runoff based on observational discharge records, J. Geo-phys. Res., 106, 3321–3334, 2001.
Larouche, J. R., Abbott, B. W., Bowden, W. B., and Jones, J. B.: The role of watershed characteristics, permafrost thaw, and wildfire on dissolved organic carbon biodegradability and water chem-istry in Arctic headwater streams, Biogeosciences, 12, 4221– 4233, doi:10.5194/bg-12-4221-2015, 2015.
Laudon, H., Buttle, J., Carey, S. K., McDonnell, J., McGuire, K., Seibert, J., Shanley, J., Soulsby, C., and Tetzlaff, D.: Cross-regional prediction of long-term trajectory of stream water DOC response to climate change, Geophys. Res. Lett., 39, L18404, doi:10.1029/2012GL053033, 2012.
Laurion, I. and Mladenov, N.: Dissolved organic matter photolysis in Canadian arctic thaw ponds, Environ. Res. Lett., 8, 035026, doi:10.1088/1748-9326/8/3/035026, 2013.
Loveland, T. R., Reed, B. C., Brown, J. F., Ohlen, D. O., Zhu, Z., Yang, L., and Merchant, J. W.: Development of a global land cover characteristics database and IGBP DISCover from 1 km AVHRR data, Int. J. Remote Sens., 21, 1303–1330, 2000. Lundin, E. J., Giesler, R., Persson, A., Thompson, M. S., and
Karls-son, J.: Integrating carbon emissions from lakes and streams in a subarctic catchment, J. Geophys. Res., 118, 1–8, 2013.
Manisera, M., van der Kooij, A. J., and Dusseldorp, E.: Identifying the component structure of satisfaction scales by nonlinear prin-cipal components analysis, Qual. Technol. Quantitat. Manage., 7, 97–115, 2010.
Mann, P. J., Davydova, A., Zimov, N., Spencer, R. G. M., Davy-dov, S., Bulygina, E., Zimov, S., and Holmes, R. M.: Controls on the composition and lability of dissolved organic matter in Siberia’s Kolyma River basin, J. Geophys. Res., 117, G01028, doi:10.1029/2011JG001798, 2012.
Mann, P. J., Eglinton, T. I., McIntyre, C. P., Zimov, N., Davydova, A., Vonk, J. E., Holmes, R. M., and Spencer, R. G. M.: Utilization
of ancient permafrost carbon in headwaters of Arctic fluvial net-works, Nat. Commun., 6, 7856, doi:10.1038/ncomms8856, 2015. Marschner, B. and Kalbitz, K.: Controls of bioavailability and biodegradability of dissolved organic matter in soils, Geoderma, 113, 211–235, 2003.
McClelland, J. W., Stieglitz, M., Pan, F., Holmes, R. M., and Peter-son, B. J.: Recent changes in nitrate and dissolved organic carbon export from the upper Kuparuk River, North Slope, Alaska, J. Geophys. Res., 112, G04S60, doi:10.1029/2006JG000371, 2007. McDowell, W. H., Zsolnay, A., Aitkenhead-Peterson, J. A., Gre-gorich, E. G., Jones, D. L., Jödemann, D., Kalbitz, K., Marschner, B., and Schwesig, D.: A comparison of methods to determine the biodegradable dissolved organic carbon from dif-ferent terrestrial sources, Soil Biol. Biochem., 38, 1933–1942, 2006.
McGuire, A. D., Anderson, L. G., Christensen, T. R., Dallimore, R., Guo, L., Hayes, D. J., Heimann, M., Lorenson, T. D., Macdon-ald, R. W., and Roulet, N.: Sensitivity of the carbon cycle in the Arctic to climate change, Ecol. Monogr., 79, 523–555, 2009. Michaelson, G. J., Ping, C.-L., Kling, G. W., and Hobbie, J. E.:
The character and bioactivity of dissolved organic matter at thaw and in the spring runoff waters of the arctic tundra north slope, Alaska, J. Geophys. Res., 103, 28939–28946, 1998.
O’Donnell, J. A., Aiken, G. R., Kane, E. S., and Jones, J. B.: Source water controls on the character and origin of dissolved organic matter in streams of the Yukon River basin, Alaska, J. Geophys. Res., 115, G03025, doi:10.1029/2009JG001153, 2010.
Olefeldt, D., Devito, K. J., and Turetsky, M. R.: Sources and fate of terrestrial dissolved organic carbon in lakes of a boreal plains region recently affected by wildfire, Biogeosciences, 10, 6247– 6265, doi:10.5194/bg-10-6247-2013, 2013a.
Olefeldt, D., Turetsky, M. R., and Blodau, C.: Altered composition and microbial versus UV-mediated degradation of dissolved or-ganic matter in boreal soils following wildfire, Ecosystems, 16, 1396-1412, doi:10.1007/s10021-013-9691-y, 2013b.
Petrone, K. C., Jones, J. B., Hinzman, L. D., and Boone, R. D.: Seasonal export of carbon, nitrogen, and major solutes from Alaskan catchments with discontinuous permafrost, J. Geophys. Res., 111, G02020, doi:10.1029/2005JG000055, 2006.
Quinn, G. P. and Keough, M. J. (Eds): Experimental design and data analysis for biologists, Cambridge University Press, Cambridge, United Kingdom, 2002.
Richardson, D. C., Newbold, J. D., Aufdenkampe, A. K., Taylor, P. G., and Kaplan, L. A.: Measuring heterotrophic respiration rates of suspended particulate organic carbon from stream ecosystems, Limnol. Oceanogr. Method., 11, 247–261, 2013.
Roehm, C. L., Giesler, R., and Karlsson, J.: Bioavailability of terres-trial organic carbon to lake bacteria: the case of a degrading sub-arctic permafrost mire complex, J. Geophys. Res., 114, G03006, doi:10.1029/2008JG000863, 2009.
Sánchez-García, L., Alling, V., Pugach, S., Vonk, J. E., van Don-gen, B., Humborg, C., Dudarev, O, Semiletov, I., and Gustafs-son, Ö.: Inventories and behavior of particulate organic carbon in the Laptev and East Siberian seas, Global Biogeochem. Cy., 25, GB2007, doi:10.1029/2010GB003862, 2011.
Schuur, E. A. G., Bockheim, J., Canadell, J. G., Euskirchen, E., Field, C. B., Goryachkin, S. V., Hagemann, S., Kuhry, P., Lafleur, P. M., Lee, H., Mazhitova, G., Nelson, F. E., Rinke, A., Ro-manovksy, V. E., Shiklomanov, N., Tarnocai, C., Venevsky, S., Vogel, J. G., and Zimov, S. A.: Vulnerability of permafrost car-bon to climate change: implications for the global carcar-bon cycle, Bioscience, 58, 701–714, 2008.
Slater, A. G. and Lawrence, D. M.: Diagnosing Present and Future Permafrost from Climate Models, J. Climate, 26, 5608–5623, 2013.
Spencer, R. G. M., Aiken, G. R., Wickland, K. P., Striegl, R. G., and Hernes, P. J.: Seasonal and spatial variability in dis-solved organic matter quantity and composition from the Yukon River basin, Alaska, Global Biogeochem. Cy., 22, GB4002, doi:10.1029/2008GB003231, 2008.
Spencer, R. G. M., Mann, P. J., Dittmar, T., Eglinton, T. I., McIn-tyre, C., Holmes, R. M., Zimov, N., and Stubbins, A.: Detecting the signature of permafrost thaw in Arctic rivers, Geophys. Res. Lett., 42, 2830–2835, 2015.
Striegl, R. G., Aiken, G. R., Dornblaser, M. M., Raymond, P. A., and Wickland, K. P.: A decrease in discharge-normalized DOC export by the Yukon River during summer to autumn, Geophys. Res. Lett., 32, L21413, doi:10.1029/2005GL024413, 2005. Striegl, R. G., Dornblaser, M. M., McDonald, C. P., Rover, J. R.,
and Stets, E. G.: Carbon dioxide and methane emissions from the Yukon River system, Global Biogeochem. Cy., 26, GB0E05, doi:10.1029/2012GB004306, 2012.
Tank, S. E., Frey, K. E., Striegl, R. G., Raymond, P. A., Holmes, R. M., McClelland, J. W., and Peterson, B. J.: Landscape-level controls on dissolved carbon flux from diverse catch-ments of the circumboreal, Glob. Biogeochem. Cy., 26, GB0E02, doi:10.1029/2012GB004299, 2012.
Tarnocai, C., Canadell, J. G., Schuur, E. A. G., Kuhry, P., Mazhi-tova, G., and Zimov, S.: Soil organic carbon pools in the north-ern circumpolar permafrost region, Global Biogeochem. Cy., 23, GB2023, doi:10.1029/2008GB003327, 2009.
Tietjen, T., Vähätalo, A. V., and Wetzel, R. G.: Effects of clay min-eral turbidity on dissolved organic carbon and bacterial produc-tion, Aquat. Sci., 67, 51–60, 2005.
Vonk, J. E. and Gustafsson, Ö.: Permafrost-carbon complexities, Nat. Geosci., 6, 675–676, 2013.
Vonk, J. E., Mann, P. J., Dowdy, K. L., Davydova, A., Davydov, S. P., Zimov, N., Spencer, R. G. M., Bulygina, E. B., Eglinton, T. I., and Holmes, R. M.: Dissolved organic carbon loss from yedoma permafrost amplified by ice wedge thaw, Environ. Res. Lett., 8, 035023, doi:10.1088/1748-9326/8/3/035023, 2013a.
Vonk, J. E., Mann, P. J., Davydov, S., Davydova, A., Spencer, R. G. M., Schade, J., Sobczak, W. V., Zimov, N., Zimov, S., Bulygina, E., Eglinton, T. I., and Holmes, R. M.: High biolability of an-cient permafrost carbon upon thaw, Geophys. Res. Lett., 40, 1–5, doi:10.1002/grl.50348, 2013b.
Walvoord, M.A., Voss, C. I., and Wellman, T. P.: Influence of permafrost distribution on groundwater flow in the context of climate-driven permafrost thaw: Example from Yukon Flats Basin, Alaska, United States, Water Resour, Res., 48, W07524, doi:10.1029/2011WR011595, 2012.
Wickland, K. P., Neff, J. C., and Aiken, G. R.: Dissolved organic carbon in Alaskan boreal forest: sources, chemical characteris-tics, and biodegradability, Ecosystems, 10, 1323–1340, 2007. Wickland, K. P., Aiken, G. R., Butler, K., Dornblaser, M. M.,