Passive Acoustic Monitoring of the Temporal
Variability of Odontocete Tonal Sounds from
a Long-Term Marine Observatory
Tzu-Hao Lin1, Hsin-Yi Yu1, Chi-Fang Chen2, Lien-Siang Chou1*
1Institute of Ecology and Evolutionary Biology, National Taiwan University, No. 1, Sec. 4, Roosevelt Road, Taipei 10617, Taiwan (R.O.C.),2Department of Engineering Science and Ocean Engineering, National Taiwan University, No. 1, Sec. 4, Roosevelt Road, Taipei 10617, Taiwan (R.O.C.)
*chouls@ntu.edu.tw
Abstract
The developments of marine observatories and automatic sound detection algorithms have facilitated the long-term monitoring of multiple species of odontocetes. Although classifica-tion remains difficult, informaclassifica-tion on tonal sound in odontocetes (i.e., toothed whales, includ-ing dolphins and porpoises) can provide insights into the species composition and group behavior of these species. However, the approach to measure whistle contour parameters for detecting the variability of odontocete vocal behavior may be biased when the signal-to-noise ratio is low. Thus, methods for analyzing the whistle usage of an entire group are nec-essary. In this study, a local-max detector was used to detect burst pulses and representa-tive frequencies of whistles within 4.5–48 kHz. Whistle contours were extracted and classified using an unsupervised method. Whistle characteristics and usage pattern were quantified based on the distribution of representative frequencies and the composition of whistle repertoires. Based on the one year recordings collected from the Marine Cable Hosted Observatory off northeastern Taiwan, odontocete burst pulses and whistles were primarily detected during the nighttime, especially after sunset. Whistle usage during the nighttime was more complex, and whistles with higher frequency were mainly detected dur-ing summer and fall. Accorddur-ing to the multivariate analysis, the diurnal variation of whistle usage was primarily related to the change of mode frequency, diversity of representative frequency, and sequence complexity. The seasonal variation of whistle usage involved the previous three parameters, in addition to the diversity of whistle clusters. Our results indicat-ed that the species and behavioral composition of the local odontocete community may vary among seasonal and diurnal cycles. The current monitoring platform facilitates the evaluation of whistle usage based on group behavior and provides feature vectors for spe-cies and behavioral classification in future studies.
OPEN ACCESS
Citation:Lin T-H, Yu H-Y, Chen C-F, Chou L-S (2015) Passive Acoustic Monitoring of the Temporal Variability of Odontocete Tonal Sounds from a Long-Term Marine Observatory. PLoS ONE 10(4): e0123943. doi:10.1371/journal.pone.0123943
Academic Editor:Michael L Fine, Virginia Commonwealth Univ, UNITED STATES
Received:July 23, 2014
Accepted:March 9, 2015
Published:April 29, 2015
Copyright:© 2015 Lin et al. This is an open access article distributed under the terms of theCreative Commons Attribution License, which permits unrestricted use, distribution, and reproduction in any medium, provided the original author and source are credited.
Data Availability Statement:Data used in this paper have been archived in the Geophysical Database Management System of Central Weather Bureau of Taiwan (R.O.C.). Contact corresponding author for access to the database.
Introduction
Odontocetes (or toothed whales) play an important role in the marine ecosystem and use a wide range of habitat for obtaining sufficient food resources. The distribution and habitat use of odontocetes fluctuate with temporal variations in habitat and prey availability [1–3]. Thus, information on the temporal variation in their habitat use can provide insights into the dynam-ics of habitat function and marine community structure [4].
Study of the temporal variation in odontocete habitat use remains difficult because of weather constraints and limited visibility in the ocean. Passive acoustic monitoring (PAM) has been widely used in field surveys of all cetaceans, i.e., odontocetes and mysticetes (or baleen whales) [5]. A cabled monitoring system, such as a marine observatory, is able to collect under-water recordings in real-time [6]. Long-term recording also facilitates the examination of tem-poral occurrence pattern of cetaceans [2,7–9]. Several automatic detectors have been developed to search for cetacean calls from a large amount of recordings [10–15]. Through the automatic processing and long-term monitoring, a marine observatory is expected to increase our knowl-edge on the community ecology of odontocetes.
Toothed whales produce a series of broadband clicks with extremely short interclick inter-vals, termed as burst pulses, during feeding [16,17]. These whales also use whistles to identify a signaler or report their own position [18,19]. The whistle contour [20,21] and repertoire com-position [22] have been identified as factors crucial for recognizing different group behaviors. However, the whistle repertoire of toothed whales exhibits high inter- and intraspecific varia-tion [23,24]. Identifying correct species and classifying different behaviors are challenging for a marine observatory, which may encounter multiple species, because the correlations between vocalizations and group behaviors have not been established for many species. Although a da-tabase for species and behavior classification is difficult to establish, investigating the temporal change of whistle characteristics and repertoire composition can provide insights into the tem-poral change of species composition or group behavior in the involved monitoring location.
To detect the variability of whistle usage, contour parameters are typically extracted to ex-amine the acoustic features of whistles [23,24]. However, manual contour extraction is labor-and cost-intensive, labor-and thus is not possible to perform during long duration recording. Several algorithms, such as the pitch-tracking algorithm, have been used to decrease the amount of la-borious work involved in contour extraction [12,13,25,26] and to provide detailed information on an individual contour and the whistle repertoire. However, the performance of automatic contour extraction highly depends on the signal-to-noise ratio (SNR) of a recorded whistle. The uncertainty of extraction accuracy is elevated when the noise level is high. In addition to contour parameters, Lin et al. used a local-max detector for extracting representative frequen-cies from cetacean tonal sounds [15]. The distribution of representative frequencies provides additional information on the frequency characteristics and composition of whistle repertoires. This kind of information is useful in identifying usage patterns from multiple whistles instead of a single whistle.
The whistle repertoire composition is crucial for interpreting the vocal behavior of odonto-cetes. The classification of whistle contours obtained from long-duration recordings can be overwhelming to human operators, and thus requires assistance from automatic classification algorithms. However, the subjective categorization can highly influence the automatic classifi-cation result based on a supervised method, and some distinct whistle types might be ignored if only few classes are adopted. An alternative would be to perform an unsupervised classification on a considerable number of tonal sounds. This involves measuring the acoustic similarity be-tween each contour pair and distinguishing different classes based on the clustering pattern of feature vectors [27,28].
In the present study, the local-max detector was used to detect burst pulses and whistles of odontocetes from recordings collected from a long-term marine observatory off northeastern Taiwan. The characteristics of whistle usage were analyzed based on the distribution of repre-sentative frequencies. The repertoire composition and sequence complexity were examined using a pitch-tracking algorithm and an unsupervised classification method. This paper dis-cusses the potential change in the calling species and behavior of the local odontocetes among diurnal and seasonal cycles based on the temporal variation of whistle usage.
Methods
Study Area
The water off northeastern Taiwan is characterized by the Kuroshio Current, a warm current that flows northward along the east coast of Taiwan, and complex bathymetry, including basin and ridge. This area has the highest number of whale-watching boats in Taiwan, and several toothed whale species, such as the spinner dolphin (Stenella longirostris), Risso’s dolphin
(Grampus griseus), spotted dolphin (S.attenuata), bottlenose dolphin (Tursiops truncatus),
Fraser’s dolphin (Lagenodelphis hosei), and false killer whale (Pseudorca crassidens), are fre-quently encountered in this area. Although some preliminary studies have investigated distri-bution and abundance [1], the habitat use and community ecology of the local odontocetes remain unclear. The seasonal changes of species composition and distribution are not well studied due to the severe weather conditions during winter and fall (north-eastern monsoon period).
Marine Cable Hosted Observatory
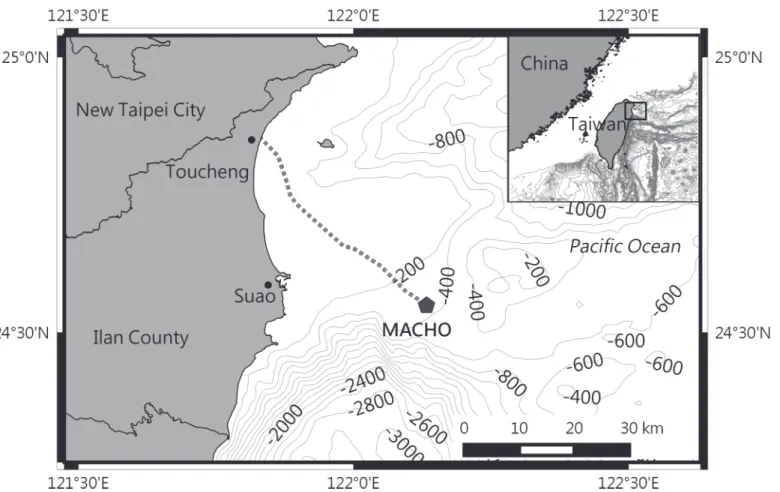
In this study, the acoustic recordings were collected from the Marine Cable Hosted Observato-ry (MACHO). The access of MACHO recordings was permitted by the Central Weather Bu-reau of Taiwan (R.O.C.). Recordings are archived in the Geophysical Database Management System (http://gdms.cwb.gov.tw/index.php). The MACHO (N24°33.0’E122°07.9’) is located on the seafloor of the Ilan Ridge, off Suao Town (Fig 1). A hydrophone (model TC-4032; Reson, Slangerup, Denmark; receiving sensitivity,–164 dB re 1 V/μPa; preamplifier gain, 10 dB; and frequency response, 10 Hz—80 kHz ± 2.5 dB) is bottom mounted at a water depth of 277 m. The recordings were collected continuously with a sampling frequency of 384 kHz and saved in the waveform audio format every 30 s. The continuous recording resulted in 64.5 GB of data per day. The acoustic monitoring system of the MACHO has a consistent systematic noise in the 3–4.5 kHz range; therefore, only the 4.5–48 kHz range was processed to prevent the influence of noise.
Acoustic Data Processing
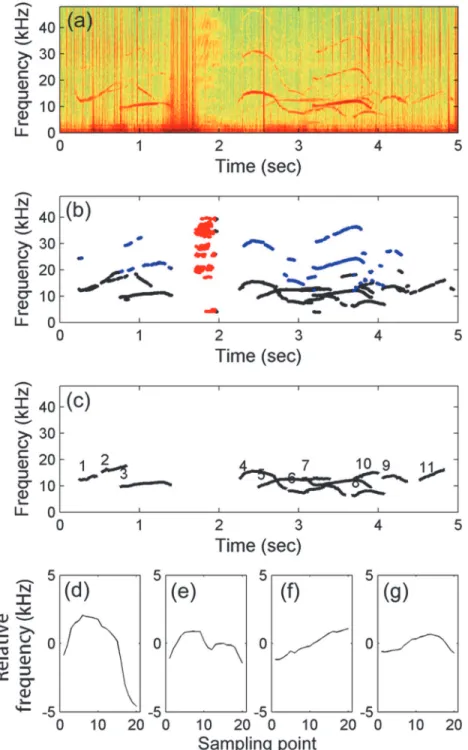
The acoustic recordings collected from October 2011 to September 2012 were examined using the automatic detection and classification algorithm, a Matlab (MathWorks, Natrick, MA)-based program, developed by Lin et al. [15,29]. This algorithm includes 4 steps: automatic de-tection of tonal sounds, separation of burst pulses and harmonics, contour extraction, and un-supervised classification (Fig 2).
on the short-time transient characteristic of tonal sounds. Detection results include whistles and burst pulses with a strong tonal appearance on the spectrogram. The burst pulses were sep-arated when the density of the tonal spectral peaks within 10 ms was higher than 0.2. The den-sity is calculated by dividing the number of tonal spectral peaks by the area based on the number of frequency and time bins with detections. Furthermore, harmonics were separated by searching for the positive integral multiple of any detected tonal segment. The tonal seg-ments belonging to the fundamental frequency were claimed as the representative frequencies of tonal sound and saved for further analysis. The representative frequencies were manually verified after automatic detection procedures to remove the tonal segments detected from the artificial noise, such as sonar signals and systematic noise.
Information on whistle contour is necessary for examining the whistle repertoire composi-tion. Individual contours were extracted from the representative frequencies by using the pitch-tracking algorithm. This algorithm searched for candidate whistle fragments within a predefined frequency range and connected consecutive fragments together. When a represen-tative frequency was located at timetiand frequencyfj, the representative frequency between
fj± 1 kHz atti+1with a minimum difference in amplitude was considered the candidate
con-tour. The termsiandjrespectively represented the indices of time and frequency on the spec-trogram. When no candidate contour was found atti+a(arepresents a positive integer), the
pitch-tracking algorithm extrapolated a line fitted through the previous 0.1 s of the existing track and repeated the extrapolation untilti+a—tiwas greater than 0.05 s. The candidate
Fig 1. Location of the marine cable hosted observatory.The MACHO is connected with a land station at Toucheng Town through a 45-km-long submarine cable (dashed line).
contour was considered to end at timeti. To decrease the influence of incomplete segments,
contours shorter than 0.2 s were not used for further analysis.
The whistle repertoire composition was analyzed using the unsupervised classification method developed by McCowan [27]. Twenty frequency points were sampled at equal intervals Fig 2. Example of automatic tonal sound detection and unsupervised classification.(a) Spectrograms produced from MACHO recording using fast Fourier transform with a Hamming window. (b) Burst pulses (red dots), harmonics (blue dots), and representative frequencies (black dots) obtained by the local-max detector. (c) Whistle contours were extracted using the pitch-tracking algorithm; different contours were labeled with different numbers. (d–g) The four whistle types were classified using the unsupervised method.
from each extracted contour. Instead of calculating the correlation coefficients between all con-tours in a large data set, the twenty frequency points were normalized according to their mean frequency and were used as feature vectors [30]. Principle component analysis was conducted to reduce the number of collinear feature vectors. To group contours with distinguishable shapes into different clusters, only components explaining more than 90% of the variances were used as feature vectors ink-means cluster analysis. Clusters were grouped by minimizing the squared Euclidean distances from the observations to the centroid of each cluster. During iterative calculations of point-to-centroid distances, a new cluster comprising the point farthest from its centroid was created if all observations of a cluster were lost. The number of clusters (k) was selected when the mean intracluster variation (sum of point-to-centroid distances with-in each cluster) was reduced to 1% of the variation of the entire data set.
Temporal Analysis of the Structural Usage of Tonal Sounds
To examine the seasonal variation in tonal sound usage, the study period was divided into 4 seasons: January–March (winter), April–June (spring), July–September (summer), and Octo-ber–December (fall). The data were also separated into daytime and nighttime based on the times of sunrise and sunset (Central Weather Bureau of Taiwan) to analyze the diurnal varia-tion. The number of seconds with detected burst pulses and whistles was measured to quantify the vocal activity of odontocetes. The factorial ANOVA function of the generalized linear model was used to test the statistical differences in the detected durations of burst pulses and whistles between two diurnal periods and among four seasons [31]. The data distribution was set as an overdispersed Poisson distribution with a log link function in the generalized linear model.
The whistle usage of odontocetes was quantified based on the mode frequency, the probabil-ity distribution of representative frequencies and whistle clusters, and the sequence complexprobabil-ity of whistles in each daytime and nighttime. The mode frequency represented the most com-monly detected frequency, which can provide information on the frequency characteristic of calling species. Measuring mode frequency depended on theΔf of spectrograms during auto-matic tonal sound detection. In this study, the measuring resolution of mode frequency was 93.75 Hz.
The probability distribution of representative frequency also provides information on the frequency characteristic of calling species. The diversity index measured the evenness of repre-sentative frequency distribution. Higher diversity suggested that whistles with wider frequency ranges or different frequency characteristics were detected. The diversity index was calculated using
H0¼ X
N
k¼1
pklogpk; 1
wherepkrepresents the proportion of the number of representative frequencies in thekth
fre-quency band (1 kHz bandwidth) in the spectrogram.
The diversity index was also employed to measure the complexity of whistle repertoire. The diversity of whistle clusters can vary according to the number of whistle clusters and the occur-rence probability of each cluster. A higher number of clusters and even probability distribution can also result in higher diversity.
whistle pairs.
H0¼log2N; 2
H1 ¼ X
N
i¼1
pilog2pi; 3
H2¼ X
N
i¼1
piX
N
j¼1
pjjilog2pjji; 4
Nrepresents the number of whistle clusters,pirepresents the probability of theithcluster in
the whistle sequence, andpj|irepresents the conditional probability that the present whistle is
thejthcluster in the sequence, given that the previous whistle is theithcluster. Thereafter, the
entropic slope, a measurement of whistle sequence complexity, can be determined based on the 3 entropic values and their entropic orders. An entropic slope closer to zero indicates that the structure of whistle sequence is nearly random (more complex). By contrast, a more negative entropic slope indicates that the sequence is more regular (predictable) [32,33]. Only periods with more than 3 whistle types were included in the statistical analysis regarding the
whistle usage.
The principle component analysis was conducted to summarize the variation within a mul-tivariate space by using the standardized matrix of recorded parameters (standardized by the mean and standard deviation of each parameter). The permutational multivariate analysis of variance (PERMANOVA) was conducted to test the significant difference among different pe-riods. The homogeneity test of multivariate dispersions (PERDISP) was also used to test the significant difference in variation around the centroid among different periods. All multivariate analyses were conducted in the R Programming Environment (The R Project for Statistical Computing,http://www.r-project.org/) using the vegan package (http://vegan.r-forge.r-project. org/).
Results
During Oct 1, 2011 to Sep 29, 2012, the MACHO had successfully transmitted recordings of 363 d and 22.73 h back to the land station. Some recording files were not received because of broken hard disk or because of other unexpected reasons. Serious data loss (>1% recording
time) occurred in 12 different days. Data recorded on these days were not included in the further analysis.
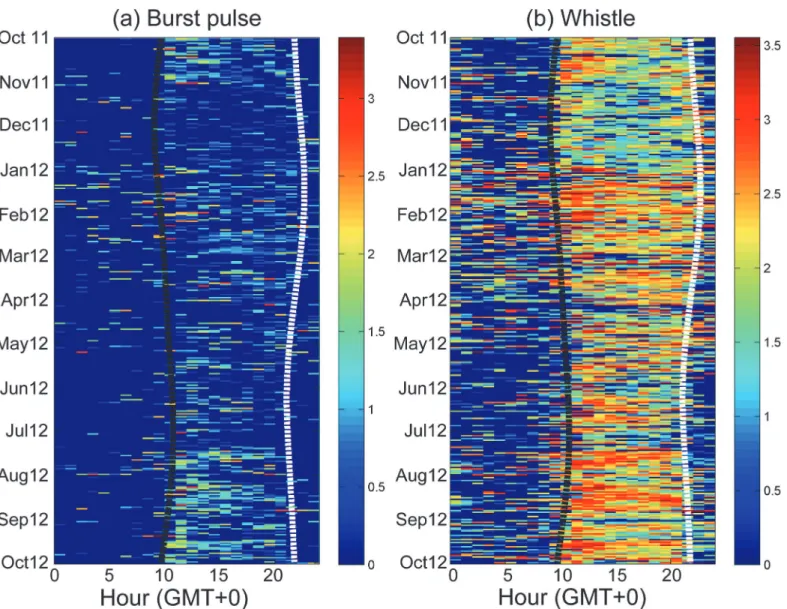
The detected durations of burst pulses and whistles revealed evident seasonal as well as diur-nal changes (Table 1). The detected durations of burst pulses were higher during winter and summer. By contrast, the detected durations of whistles were highest during winter (Table 2). Regarding the diurnal variation, the detected duration of both sounds revealed a similar chang-ing pattern; the detected durations were significantly higher durchang-ing the nighttime (Table 2). In addition, the detection rates of local odontocetes during 5:00 to 7:00 and 17:00 to 19:00 ap-peared to change with the seasonal shift of sunrise and sunset. Although no clear crepuscular behavior could be observed, the detection rates of burst pulses and whistles were slightly higher after sunset compared with the other nighttime periods (Fig 3).
representative frequencies in the daytime were generally lower than in the nighttime. The differences were more obvious in winter and spring. For the diversity indices of whistle clusters, the diurnal variation was not as evident. However, the seasonal variation showed that the diversity indices of whistle clusters were higher in winter. The seasonal and diurnal changing patterns of sequence complexity were much more complicated. The entropic slopes tended to be lower in the daytime, but this phenomenon can be observed only during certain months. Permutational multivariate analysis of variance revealed that the whistle usage varied significantly between day and night periods (Pseudo-P<0.001) and among four seasons
(Pseudo-P<0.001). Furthermore, the level of data dispersion changed significantly among
di-urnal (Pseudo-P<0.001) and seasonal cycles (Pseudo-P<0.001) based on the homogeneity
test of multivariate dispersions.
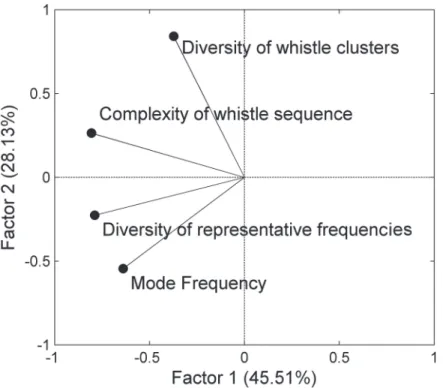
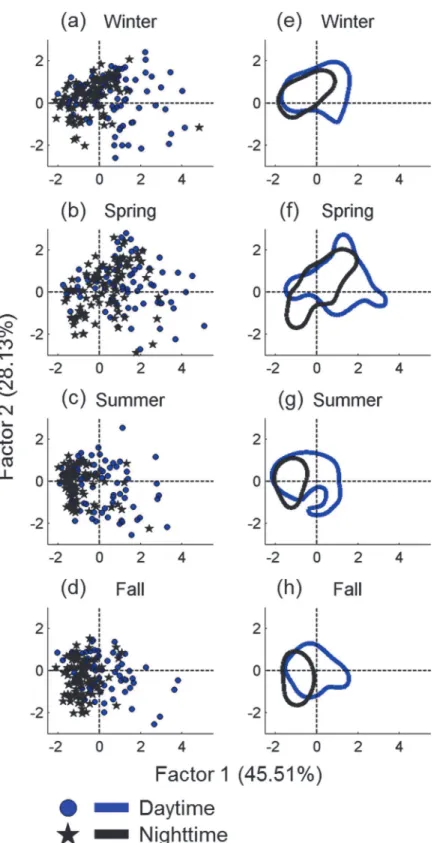
The contribution of each parameter to the temporal variation of whistle usage was analyzed based on principle component analysis.Fig 5shows the component loadings of the four pa-rameters for the two principle factors. The diversity of representative frequencies and the en-tropic slope contributed most of the variation in Factor 1. The diversity of whistle clusters contributed most of the variation in Factor 2. The mode frequency is essential for Factors 1 and 2; however, this parameter makes a minor contribution compared to those parameters men-tioned previously. According to the temporal change of whistle usage summarized based on the 2 principle factors, the diurnal change of whistle usage was clearly correlated with Factor 1. However, the seasonal change of whistle usage was correlated with both factors (Fig 6). The
Table 2. The mean and standard deviation on each whistle usage parameter in the two diurnal periods and the four seasons.
Burst pulses (sec)
Whistles (sec) Whistle usage Mode Frequency (kHz) Representative frequency diversity Whistle cluster diversity Whistle sequence complexity
Season Diurnal period N Mean S.D. Mean S.D. N Mean S.D. Mean S.D. Mean S.D. Mean S.D.
Winter Day 89 68 138 1944 2068 85 9.04 2.53 0.97 0.11 2.86 0.31 -0.43 0.19
Night 89 179 337 4251 3526 89 9.92 2.73 1.05 0.08 2.96 0.24 -0.32 0.14
Spring Day 90 33 97 988 1438 76 8.46 2.76 0.92 0.12 2.77 0.42 -0.49 0.22
Night 90 63 113 2879 2558 88 9.01 2.95 1.00 0.11 2.80 0.34 -0.36 0.15
Summer Day 86 78 341 1229 1707 75 11.25 2.58 1.00 0.07 2.84 0.38 -0.41 0.21
Night 86 177 249 3471 2431 86 12.23 1.80 1.05 0.05 2.92 0.30 -0.28 0.15
Fall Day 87 28 100 768 881 69 10.36 2.40 1.00 0.08 2.76 0.36 -0.40 0.18
Night 87 86 267 2036 1886 87 11.67 1.94 1.07 0.04 2.82 0.30 -0.29 0.10
doi:10.1371/journal.pone.0123943.t002
Table 1. Results of the factorial ANOVA for seasonal and diurnal effects on the detected duration of (a) burst pulses and (b) whistles.
(a) Burst pulse
df Wald p
Season 3 14.98 <0.01
Diurnal phase 1 15.31 <0.001
Interaction 3 0.51 0.92
(b) Whistle
df Wald p
Season 3 54.61 <0.001
Diurnal phase 1 128.37 <0.001
Interaction 3 2.39 0.50
Significant effects (p<0.05) are bolded.
analysis results show that the diurnal change of whistle usage was primarily contributed by the whistle sequence complexity, diversity of representative frequencies, and mode frequency. The seasonal change of whistle usage involved all parameters. In addition, the data dispersion (the size of the 50% central area shown inFig 6) enlarged during spring, indicating that the varia-tions in whistle usage were greatest during spring.
Discussion
In the present study, odontocete tonal sounds were effectively detected at the current marine observatory by using the local-max detector. In contrast to the traditional template detectors, the local-max detector can detect various types of tonal sound for facilitating the acoustic mon-itoring of multiple odontocete species. Applying the pitch-tracking algorithm and unsuper-vised classification also facilitates the examination of whistle usage. The current monitoring Fig 3. Seasonal and diurnal variation of detected durations in burst pulses (a) and whistles (b).The number of detected seconds was calculated hourly and is presented in log scale (colorbar). The black dashed line represents the time of sunset, and the white dashed line represents the time of sunrise.
platform can expand knowledge on the temporal changing pattern of the local odontocete community regarding their detection rate and vocal behavior.
The performance of automatic detection is a major concern for an automatic detection algo-rithm. The local-max detector can detect 60% of tonal sounds recorded by the MACHO and has only a 3% false alarm rate [29], indicating that odontocete tonal sounds can be reliably ex-amined using the current monitoring platform. To detect the variability of odontocete behavior based on whistle usage, previous studies have indicated contour parameters and the repertoire composition as predictive parameters for different surface behavioral states [20–22]. However, the SNR of a whistle recorded from a deep water marine observatory typically exhibits poor quality when the calling animal is far away from the observatory. In such a situation, contour parameters may be extracted at a lower frequency. Lin et al. [15] reported that the local-max detector could not detect some contour segments that undergo rapid changes in frequency. However, the representative frequency distribution obtained using the local-max detector was only slightly different from that obtained using the manual analysis. Therefore, instead of the maximum and minimum frequency of a contour, the mode frequency and the diversity index of representative frequencies were measured as they are less likely to be biased during a low SNR condition. Although the entire contour may not be effectively extracted, the changing Fig 4. Seasonal and diurnal variation of whistle usage in mode frequency (a), diversity of representative frequencies (b), diversity of whistle clusters (c), and complexity of whistle sequence (d).The box plot shows the median (center point), interquartile range (box), minimum to maximum (error bar), and outliers (empty circles).
pattern of composition and sequence complexity of whistle segments calculated from a large data set should reflect the relative change of the original whistle repertoire.
In contrast to contour parameters, which are typically related to the vocal behavior of a sin-gle individual, the parameters used in this study are related to the species and behavior of an entire odontocete group. Based on the few recordings collected along the east coast of Taiwan during onboard surveys, the parameters used in this study play crucial roles regarding the inter- and intraspecific variation of whistle usage. According to the loadings of the first two component factors (S1 Fig) and the factor scores of the 7 toothed whale species (S2 Fig), the in-terspecific variation of whistle usage can be primarily explained by mode frequencies and di-versity indices of representative frequencies. Toothed whales with smaller body sizes (such as spinner and spotted dolphins) tended to produce higher mode frequencies and wider diversity indices of representative frequencies, which agree with the correlation of frequency characteris-tics and body size reported in previous studies [34,35]. On the contrary, the complexity of whistle repertoire and whistle sequence only explained a small percentage of the intraspecific variation. Instead, these two parameters varied between different groups of the same toothed whale species. Thus, analyzing the whistle usage in terms of the representative frequency distri-bution and repertoire composition may provide information related to odontocete species and group behavior.
For a long-term marine observatory, the detection rates of cetaceans can provide informa-tion on their relative change of vocal activity, and can be used to understand the temporal change of distribution and behavior [36,37]. The lower detection probability of calling animals during a period may suggest that animals either have a low calling rate or they move temporari-ly outside the monitoring area. However, because ontemporari-ly a single sensor was used in this study, examining the movement of odontocetes was impossible. Although information on their Fig 5. Component loadings for each whistle usage parameter.The black points represent the vectors of four whistle usage parameters on the two component factors. Factor 1 explained 45.51% of the variation of whistle usage. Factor 2 explained 28.13% of the variation of whistle usage.
Fig 6. Seasonal and diurnal variation of whistle usage summarized based on the two component factors.Each data point represents one of two diurnal periods in each season after principle component analysis (a–d). The circled areas represent the 50% central areas of the two diurnal periods in each season estimated using the kernel density method (e–h).
movement might be lacking, detecting burst pulses and whistles can facilitate understanding the changing pattern of their vocal behavior in the study area. Burst pulses have been reported to function in social communication and feeding behavior for odontocetes [16,17,38]. Detect-ing burst pulses can facilitate identifyDetect-ing the foragDetect-ing period of local odontocete communities. In addition, the long-term monitoring on whistle usage can also provide insights on temporal change of calling species and behaviors.
During the one year monitoring period, local odontocetes were primarily detected after sun-set and foraged before midnight. The temporal change of whistle usage also indicated that the composition of odontocete species and group behavior possibly changed with diurnal and sea-sonal cycles. The higher detection rate, greater diversity of representative frequencies, and greater sequence complexity during the nighttime suggests that odontocete vocal behaviors were more complex during the nighttime. The higher mode frequencies suggest that odonto-cetes with smaller body sizes mainly occurred near the recording station in summer and fall. In addition, the seasonal change in the data dispersion showed that the composition of odontocete community may be more complex during spring. According to previous visual observations during spring to fall, Risso's dolphins, spinner dolphins, and spotted dolphins were sighted more often in Ilan waters during summer [1]. The preliminary results also suggested that the species diversity was higher during spring and summer, which supports the current acoustic monitoring results.
The temporal change in odontocete behavior can be correlated to prey availability [2,3]. Lee et al. [39] reported the diurnal migration of the deep scattering layer near the monitoring area. The foraging probability of odontocetes can be elevated when the deep scattering layer rises to the surface water after sunset. Furthermore, the seasonal variation in the cetacean species com-position may be related to the seasonal change in the ocean environment. The northeastern Taiwan waters are highly influenced by the seasonal Kuroshio movement and upwelling [40– 42]. The seasonal variation in the ocean environment may alter prey availability, and thus affect cetacean habitat use [2,3,43]. The effect of environmental change on cetacean habitat use needs to be investigated for marine conservation, and the research is only possible when data are col-lected for long periods and large areas.
The long-term acoustic recording system was demonstrated as a powerful tool for detecting the occurrence of odontocetes and their vocal behaviors. The current algorithm provides an ob-jective platform for analyzing the whistle usages related to group behavior. The results can be considered as feature vectors for species and behavior classification once a database has been established. Even without a large database, the current monitoring platform still provides in-sights regarding the temporal change of odontocete vocal usage. Additional marine observatory networks will be constructed throughout the entire ocean. In the future, temporal variations in cetacean species composition and habitat use pattern across a large geographical area can be monitored effectively based on the network of marine observatories.
Supporting Information
S1 Fig. Component loadings for each whistle usage parameter in odontocete recordings collected from the onboard survey.During 2010–2012, 70 recordings were collected from seven odontocete species during the onboard surveys off the east coast of Taiwan. Whistle usage was examined using the same methodology as that for the MACHO recordings. The black points represent the vectors of four whistle usage parameters for the two component fac-tors. Factor 1 explained 42.22% of the variation of whistle usage, and Factor 2 explained 37.17% of the variation of whistle usage.
S2 Fig. Variation of whistle usage in odontocete recordings collected from the onboard sur-vey.There were 50 recording files (total length: 3.35 hr) with an acceptable SNR of odontocete whistles. Each data point represents each recording file after principle component analysis. Whistle usage on seven species were analyzed, including bottlenose dolphinsTursiops trunca-tus(red), false killer whalesPseudorca crassidens(green), Fraser's dolphinsLagenodelphis hosei (blue), short-finned pilot whalesGlobicephala macrorhynchus(magenta), Risso’s dolphins
Grampus griseus(cyan), spinner dolphinsStenella longirostris(yellow), and spotted dolphins
Stenella attenuata(black).
(TIF)
Acknowledgments
We thank all staff for establishing and maintaining the MACHO system, and the Central Weather Bureau of Taiwan (R.O.C.) for accessing the MACHO recordings. This study was sup-ported by the Ministry of Science and Technology of Taiwan (R.O.C.) under the project of MOST 101-2221-E-002-028-MY2 and MOST 103-3113-E-002–013 -. We thank Florence Eva-citas for improving the manuscript.
Author Contributions
Conceived and designed the experiments: THL HYY CFC LSC. Performed the experiments: THL HYY. Analyzed the data: THL. Contributed reagents/materials/analysis tools: THL CFC. Wrote the paper: THL HYY LSC.
References
1. Chen Y (2001) Ecological aspects of cetaceans in Ilan waters of Taiwan: abundance, distribution, habi-tat partitioning, and acoustics. M.Sc. Thesis, The University of Charleston.
2. Akamatsu T, Nakamura K, Kawabe R, Furukawa S, Murata H, Kawakubo A, et al. (2010) Seasonal and diurnal presence of finless porpoises at a corridor to the ocean from their habitat. Mar Biol 157: 1879–
1887.
3. Kimura S, Akamatsu T, Li S, Dong L, Wang K, Wang D, et al. (2012) Seasonal changes in the local dis-tribution of Yangtze finless porpoises related to fish presence. Mar Mammal Sci 28: 308–324.
4. Fernández R, MacLeod CD, Pierce GJ, Covelo P, López A, Torres-Palenzuela J, et al. (2013) Inter-spe-cific and seasonal comparison of the niches occupied by small cetaceans off north-west Iberia. Cont Shelf Res 64: 88–98.
5. Mellinger DK, Stafford KM, Moore SE, Dziak RP, Matsumoto H (2007) An overview of fixed passive acoustic observation methods for cetaceans. Oceanography 20: 36–45.
6. André M, van der Schaar M, Zaugg S, Houégnigan L, Sánchez A, Castell JV (2011) Listening to the deep: Live monitoring of ocean noise and cetacean acoustic signals. Mar Pollut Bull 63: 18–26. doi:10. 1016/j.marpolbul.2011.04.038PMID:21665016
7. Soldevilla MS, Wiggins SM, Hildebrand JA, Oleson EM, Ferguson MC (2011) Risso’s and Pacific white-sided dolphin habitat modeling from passive acoustic monitoring. Mar Ecol-Prog Ser 423: 247–
260.
8. Lin T-H, Akamatsu T, Chou L-S (2013) Tidal influences on the habitat use of Indo-Pacific humpback dolphins in an estuary. Mar Biol 160: 1353–1363.
9. Lin T-H, Akamatsu T, Chou L-S (2014) Seasonal distribution of Indo-Pacific humpback dolphins at an estuarine habitat: influences of upstream rainfall. Estuar Coast (in press). doi: 10.1007/s12237-014-9886-2
10. Erbe C, King AR (2008) Automatic detection of marine mammals using information entropy. J Acoust Soc Am 124: 2833–2840. doi:10.1121/1.2982368PMID:19045771
12. Mellinger DK, Martin SW, Morrissey RP, Thomas L, Yosco JJ (2011) A method for detecting whistles, moans, and other frequency contour sounds. J Acoust Soc Am 129: 4055–4061. doi:10.1121/1. 3531926PMID:21682426
13. Roch MA, Brandes TS, Patel B, Barkley Y, Baumann-Pickering S, Soldevilla MS (2011) Automated ex-traction of odontocete whistle contours. J Acoust Soc Am 130: 2212–2223. doi:10.1121/1.3624821 PMID:21973376
14. Zaugg S, Houégnigan L, André M (2012) A framework for the automated real-time detection of short tonal sounds from ocean observatories. Appl Acoust 73: 281–290.
15. Lin T-H, Chou L-S, Akamatsu T, Chan H-C, Chen C-F (2013) An automatic detection algorithm for ex-tracting the representative frequency of cetacean tonal sounds. J Acoust Soc Am 134: 2477–2485. doi:10.1121/1.4816572PMID:23968045
16. Akamatsu T, Wang D, Wang K, Naito Y (2005) Biosonar behaviour of free-ranging porpoises. P Roy Soc B-Biol Sci 272: 797–801. PMID:15888412
17. Madsen PT, Johnson M, de Soto NA, Zimmer WMX, Tyack P (2005) Biosonar performance of foraging beaked whales (Mesoplodon densirostris). J Exp Biol 208: 181–194. PMID:15634839
18. Smolker R, Mann J, Smuts B (1993) Use of signature whistles during separations and reunions by wild bottlenose dolphin mothers and infants. Behav Ecol Sociobiol 33: 393–402.
19. Janik VM, Slater PJ. (1998) Context-specific use suggests that bottlenose dolphin signature whistles are cohesion calls. Anim Behav 56: 829–838. PMID:9790693
20. Hernandez EN, Solangi M, Kuczaj SA II (2010) Time and frequency parameters of bottlenose dolphin whistles as predictors of surface behavior in the Mississippi Sound. J Acoust Soc Am 127: 3232–3238. doi:10.1121/1.3365254PMID:21117771
21. Díaz López B (2011) Whistle characteristics in free-ranging bottlenose dolphins (Tursiops truncatus) in the Mediterranean Sea: Influence of behaviour. Mamm Biol 76: 180–189.
22. Van Parijs SM, Corkeron PJ (2001) Vocalizations and behaviour of Pacific humpback dolphinsSousa chinensis. Ethology 107: 701–716.
23. Oswald JN, Barlow J, Norris TF (2003) Acoustic identification of nine delphinid species in the eastern tropical Pacific Ocean. Mar Mammal Sci 19: 20–37.
24. Gannier A, Fuchs S, Quèbre P, Oswald JN (2010) Performance of a contour-based classification
meth-od for whistles of Mediterranean delphinids. Appl Acoust 71: 1063–1069.
25. Mallawaarachchi A, Ong SH, Chitre M, Taylor E (2008) Spectrogram denoising and automated extrac-tion of the fundamental frequency variaextrac-tion of dolphin whistles. J Acous Soc Am 124: 1159–1170. doi: 10.1121/1.2945711PMID:18681604
26. Gillespie D, Caillat M, Gordon J, White P (2013) Automatic detection and classification of odontocete whistles. J Acous Soc Am 134: 2427–2437. doi:10.1121/1.4816555PMID:23968040
27. McCowan B (1995) A new quantitative technique for categorizing whistles using simulated signals and whistles from captive bottlenose dolphins (Delphinidae,Tursiops truncatus). Ethology 100: 177–193.
28. Janik VM (1999) Pitfalls in the categorization of behaviour: a comparison of dolphin whistle classifica-tion methods. Anim Behav 57: 133–143. PMID:10053080
29. Lin T-H, Yu H-Y, Chen C-F, Chou L-S (2013) Automatic detection and classification of cetacean tonal sounds from a long-term marine observatory. Underwater Technology Symposium (UT), 2013 IEEE In-ternational. Tokyo: IEEE. pp. 1–6. Available:http://ieeexplore.ieee.org/xpls/abs_all.jsp?arnumber= 6519820. Accessed 26 February 2014.
30. Seekings PJ, Yeo KP, Chen ZP, Nanayakkara SC, Tan J, Tay P, et al. (2010) Classification of a large collection of whistles from Indo-Pacific humpback dolphins (Sousa chinensis). OCEANS, 2010 IEEE. Sydney: IEEE. pp. 1–5. Available:http://ieeexplore.ieee.org/xpls/abs_all.jsp?arnumber=5603596. Ac-cessed 26 September 2012.
31. Soldevilla MS, Wiggins SM, Hildebrand JA (2010) Spatial and temporal patterns of Risso’s dolphin echolocation in the Southern California Bight. J Acoust Soc Am 127: 124–132. doi:10.1121/1.3257586 PMID:20058956
32. McCowan B, Hanser SF, Doyle LR (1999) Quantitative tools for comparing animal communication sys-tems: information theory applied to bottlenose dolphin whistle repertoires. Anim Behav 57: 409–419. PMID:10049481
34. Wang D, Würsig B, Evans W (1995) Comparisons of whistles among seven odontocete species. In: Kastelien RA, Thomas JA, Nachtigal PE, editors. Sensory systems of aquatic mammals: De Spil Press, Woerden, The Netherlands. pp. 299–323.
35. Frankel AS, Yin S (2010) A description of sounds recorded from melon-headed whales ( Peponoce-phala electra) off Hawai’i. J Acoust Soc Am 127: 3248–3255. doi:10.1121/1.3365259PMID: 21117773
36. Moore SE, Stafford KM, Mellinger DK, Hildebrand JA (2006) Listening for large whales in the offshore waters of Alaska. BioScience 56: 49–55.
37. Stanistreet JE, Risch D, Van Parijs SM (2013) Passive acoustic tracking of singing humpback whales (Megaptera novaeangliae) on a Northwest Atlantic feeding ground. PLoS ONE 8: e61263. doi:10. 1371/journal.pone.0061263PMID:23593447
38. Overstrom NA (1983) Association between burst-pulse sounds and aggressive behavior in captive At-lantic bottlenosed dolphins (Tursiops truncatus). Zoo Biol 2: 93–103.
39. Lee MA, Chao MH, Weng JS, Lan YC, Lu HJ (2011) Diel distribution and movement of sound scattering layer in Kuroshio waters, northeastern Taiwan. J Mar Sci Technol 19: 253–258.
40. Chuang W-S, Liang W-D (1994) Seasonal variability of intrusion of the Kuroshio water across the conti-nental shelf northeast of Taiwan. J Oceanogr 50: 531–542.
41. Chang Y-L, Wu C-R, Oey L-Y (2009) Bimodal behavior of the seasonal upwelling off the northeastern coast of Taiwan. J Geophys Res 114. Available:http://doi.wiley.com/10.1029/2008JC005131. Ac-cessed 26 February 2014.
42. Hsin Y-C, Qiu B, Chiang T-L, Wu C-R (2013) Seasonal to interannual variations in the intensity and cen-tral position of the surface Kuroshio east of Taiwan. J Geophys Res-Oceans 118: 4305–4316.