Novel Altered Region for Biomarker Discovery in
Hepatocellular Carcinoma (HCC) Using Whole
Genome SNP Array
Novel cytogenetic aberration for hepatocellular carcinoma
Esraa M. Hashem
1 1Biomedical Engineering Department
Misr University for Science and Technology (MUST University)
Cairo, Egypt
Mai S. Mabrouk
2* 2Biomedical Engineering Department
Misr University for Science and Technology (MUST University)
Cairo, Egypt
Ayman M. Eldeib
3 3Systems and Biomedical Engineering
Faculty of engineering, Cairo University, Cairo, Egypt
Abstract—cancer represents one of the greatest medical causes of mortality. The majority of Hepatocellular carcinoma arises from the accumulation of genetic abnormalities, and possibly induced by exterior etiological factors especially HCV and HBV infections. There is a need for new tools to analysis the large sum of data to present relevant genetic changes that may be critical for both understanding how cancers develop and determining how they could ultimately be treated. Gene expression profiling may lead to new biomarkers that may help develop diagnostic accuracy for detecting Hepatocellular carcinoma. In this work, statistical technique (discrete stationary wavelet transform) for detection of copy number alternations to analysis high-density single-nucleotide polymorphism array of 30 cell lines on specific chromosomes, which are frequently detected in Hepatocellular carcinoma have been proposed. The results demonstrate the feasibility of whole-genome fine mapping of copy number alternations via high-density single-nucleotide polymorphism genotyping, Results revealed that a novel altered chromosomal region is discovered; region amplification (4q22.1) have been detected in 22 out of 30-Hepatocellular carcinoma cell lines (73%). This region strike, AFF1 and DSPP, tumor suppressor genes. This finding has not previously reported to be involved in liver carcinogenesis; it can be used to discover a new HCC biomarker, which helps in a better understanding of hepatocellular carcinoma.
Keywords—Hepatocellular carcinoma; copy number alternation; biomarkers; single-nucleotide polymorphism
I. INTRODUCTION
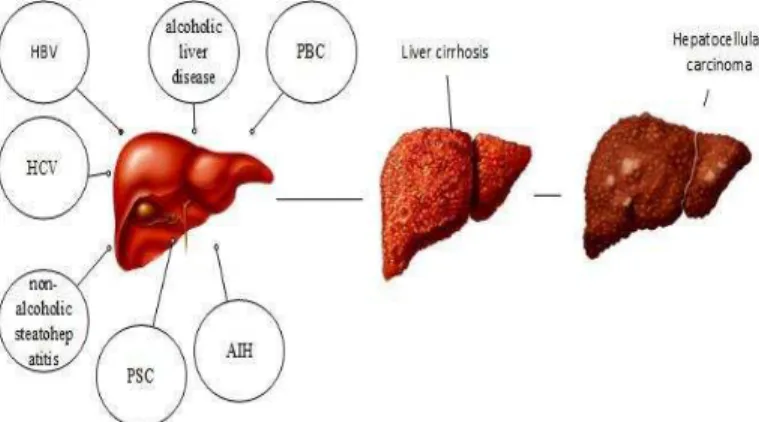
Cancer begins when cells in a part of the body begin to grow out of control. There are many types of cancer, but they all starts duo to out-of-control growth of abnormal cells. In many cases, the cancer cells form a tumor. Liver cirrhosis is the end stage of chronic liver diseases. Cirrhosis is a disease in which hepatic cells become damaged. People with cirrhosis have an increased risk of liver cancer. The main causes of cirrhosis are alcoholic liver disease (ALD), hepatitis B (HBV), hepatitis C (HCV), non-alcoholic steatohepatitis (NASH), 10 haemochromatosis, auto-immune hepatitis (AIH), primary biliary cirrhosis (PBC) and primary sclerosing cholangitis (PSC) [1], as shown in Fig. 1. Chronic HCV infection is the
main reasons for cirrhosis and HCC [2]. Rates for liver cancers in men are usually 2 to 4 times higher than in women [3]. The most common primary malignancy of the liver is Hepatocellular carcinoma (HCC), it accounts for as many as one million deaths annually around the world [4].
Fig. 1. The main causes of liver cirrhosis
One of the characteristics in cancer is chromosomal instability it results in the structural alterations of DNA copy number alterations (CNAs) and it is expressed as loss, gain, amplifications and deletions, which are frequently contributing to tumorigenesis. That alterations change the level of gene expression, which modify normal growth control and survival pathway [5]; identification of cancer specific CNAs will not only provide new insight into understanding the molecular basis of tumorigenesis but also facilitates the discovery of new cancer genes. Among such alternations, frequently detected of DNA copy number gains at 1q, 8q, 11q, 17q, and 20q [6-8] and losses at 4q, 8p, 9p, 13q, 16q, and 17p have been identified in HCC [9-11] using traditional methodology.
Early efforts focus on discover and categories CNAs depend on a technique called comparative genomic hybridization (CGH) which used to provide a genome-wide investigation of CNAs in cancer. The disadvantage of CGH method is the resolution of mapping copy number alteration limited by 2 Mbp (high- copy number amplifications) to 10 Mbp (low-copy-number amplification or deletion) [12].
Through the uses of DNA clones spotted in array format on slides as targets for hybridization of normal and test DNA array comparative genomic hybridization (a-CGH) opened the way for a marked increase in resolution up to 30 kb [13-14] however, the main drawback of a-CGH its difficult to detect aberrations that do not result in copy number changes and is limited in detect mosaicism [15].
During the last decade, the whole genome single nucleotide polymorphism (SNP) array has been the common element in a highly productive synergistic relationship between advances in biological understanding and computational methodologies. SNP is a single base change in a DNA sequence, with a usual alternative of two possible nucleotides at a specific position. The Illumina Bead Array has gradually increased in capacity over the years from 100 000 SNPs (Human-1) to the current (HumanHap1M) one million, with intermediary steps 240- 000, 317 000, 550 000 and 650- 000 [16].
The use of SNP arrays in copy number detection has a number of advantages. Instead of the two applications for the data that are SNP genotyping and copy number analysis, other aspects promote their use more than other techniques. SNP arrays work with fewer samples per experiment compared to a-CGH. The SNP array is a cost-effective technique, which allows the user to increase the number of samples examined on a limited budget. Although the progress in high-throughput sequencing technology has made copy number discovery much easier, the application of known CNA information means that we can target structural variation in a sample using less expensive techniques such as the SNP array without a large reduction in genome- wide coverage [17].
There are many automated algorithms used to determine the characteristic of genomic profiles, Justin K. et al. use Hidden Markov Models (HMM) algorithm to demonstrate that highly accurate SNP genotypes can infer from very low coverage shotgun [18]. Cooper et al. use SNP conditional mixture modelling (SCIMM) by applied a mixture-likelihood
clustering method within the R statistical package to identify deletions of copy number changes [19]. Franke et al. present a combined approach focus on single SNP interpretation; Tri-typer uses maximum likelihood estimation to detect deletions in Illumina SNP data in unrelated samples [20].
Signal noise often causes false positive predictions and it is a strong limitation of many automated algorithms to detect biomarkers in CNAs [21]. To fill this draw back, segmentation method is implemented based on wavelet decomposition and threshold in which detects significant breakpoints in the data called: Discrete Stationary Wavelet transforms (DSWT), that helps to understanding of the genomic basis of the disease process and develop a method to find biomarkers for early diagnosis of HCC by, identification of genome-wide alternations in copy number from whole genome SNP genotyping. The normalized R-value is uses as a representation of intensity on individual SNP plots. The log R ratio value can calculate from the expected normalized intensity of a sample and observed normalized intensity, log R ratio used by a number of copy number event detection algorithm [17].
In the work at hands, one-dimensional DSWT model is proposed to analyze 30- HCC cell line SNP array data to identify gain, amplification, deletion and loss of chromosomes and try to predict new biomarkers that help to pre-diagnose of HCC.
II. MATERIAL AND METHOD
SNP array plays a key role in genome-wide association and population genetic studies, which are the most common genetic variants in the human genome [21]. Wavelet analysis unlike traditional Fourier transform (FT), it is able to decay time series into time-frequency space and gets more attention as a potential tool to study cancer genomic data.
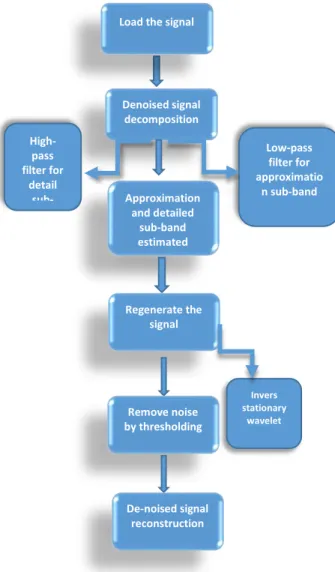
To remove noise from the signal by using DSWT algorithm First, load the data 30 cell lines, then decompose the signal at single-level, then estimate the approximation and detail sub bands to generate the signal using inverse stationary wavelet transform, finally remove the noise and display denoised signal with ideogram of a specific chromosome. The steps of the proposed algorithm summarized in Fig.2
A. SNP Genotyping Array Data:
experiment overall normalized signal intensity on the A and B alleles, respectively. As normalization measure of the total signal intensity, the log R Ratio (LRR) value for each SNP is calculated as LRR = log2 (R observed/R expected), where (R expected) is computed from linear interpolation of accepted genotype clusters [23]. LRR of Zero means copy number neutral, positive values mean copy number gains and negative values mean copy number losses. The data of normalized log R based intensity ratios was stored in Excel files and are available at: [http://www.ncbi.nlm.nih.gov/geo].
Fig. 2. The steps of discrete stationary wavelet algorithm
B. DISCRETE stationary wavelet TRANSFORM (DSWT):
Hepatocarcinogenesis is a complex multi-state process occurring usually after many years of chronic hepatitis providing mutagenic environments to precipitate random genetic alterations.
With the rapid development of high-density single-nucleotide polymorphism array and array-based comparative genomic hybridization, it has become feasible to characterize CNAs involved in tumor development and progression across the entire genome. Advances in SNP genotyping technologies have played a key role in the proliferation of large-scale
genomic studies, leading to the discovery of hundreds of genes associated with complex human diseases (HCC). Wavelet bases are generated by dilation and translation of a single wavelet function (x) called the mother wavelet (Haar basis). It is simplest wavelet base, which generated by the Haar
function in equation 1, it identifies statistically significant breakpoints in the data, using the maxima of the Haar wavelet transform, and segments accordingly [5]. The advantage of wavelets is their excitability.
{ √ √ ⁄⁄
The family of dyadic dilations and translations {ψjk}j,k∈z where ψ jk(x) = 2j\2 ψ (2jx-k) forms an orthonormal(two vectors in an inner product space are orthonormal if they are orthogonal and all of unit length) basis for the space of L2 functions, where j and k are indices for the scale and location, respectively [24]. After using Haar function, there is a need to remove noise from the signal by decomposing, the input signal into an approximation sub-bands and a set of detail sub-bands at different resolution scales using a set of high pass and low pass filters [25]. The number of samples contained by each sub-band at level N, so the number of input samples divided by 2N [26]. Sub-band coding found to yield a fast computation of wavelet transform, in the work at hand, only one level of approximation and detail sub-bands need to implement, then regenerate the signal using inverse stationary wavelet transform, after that, remove the noise by threshold selection rule to display denoised signals.
Wavelet thresholding is very simple non-linear technique, which operates on one wavelet coefficient at same time. In its simplest form, each coefficient is threshold by compare against threshold, if the coefficient is smaller than threshold, set to 0, otherwise it is modified or kept. There are two thresholds frequently used, hard threshold, and soft threshold. The soft-thresholding function has a somewhat different rule from the hard-thresholding function. It shrinks the wavelet coefficients by λ towards zero in equation 2, the threshold λ chosen according to the signal energy and the noise variance [27].
λ if ≥ λ
=0 if
‹
λ (2) = + λ if ≤- λFinally, to display the denoised signal with specific chromosome the ideogram added to the denoised signal. A threshold level assigned to each dyadic resolution level according to the principle of minimizing the Stein Unbiased Estimate of Risk (SURE) for estimate the threshold. SURE provides a means for unbiased estimation of the true mean-squared error (MSE). Without the need knowledge of the noise-free signal, this unbiased evaluate solely depends on the given data and on some description of the first-order dependence of the denoising operator with respect to the data [5].
III. RESULTS
The most common adult genetic liver disease in which a particular genetic defect leads to iron accumulation in the
Invers stationary
wavelet
Denoised signal decomposition
Low-pass filter for approximatio
n sub-band
High-pass filter for
detail
sub- Approximation
and detailed sub-band estimated
Regenerate the signal
Remove noise by thresholding
liver, leading to liver cirrhosis and liver cancer in some cases. Liver cancer is one of the few cancers that is increasing in incidence and in mortality. It is difficult to find HCC early because signs and symptoms often do not appear until it is in its later stages [28].
Comprehensive identification of CNVs is required to provide a complete view of human genetic variation, which frequently detected during the development of HCC. Mapping of chromosome gains, amplifications, deletions and losses have frequently resulted in the identification of oncogenes and tumor suppressors gens. Recently, there has been increased interest in inferring copy number from SNP arrays due to their widespread use in genome-wide association studies and significantly greater probe density.
In this study, the genome-wide CNAs have been
systematically analyzed on specific
chromosomes(1q,4q,4p,8q,8p,9q,11q,13q,16p,17q,17p,20q) by applying discrete stationary wavelet transform technique on HCC cell lines data using high-density SNP-array. This allowed us to identify regions in the HCC genome that have undergone recurrent high-level amplifications or deletions. The 30 HCC cell lines data can download from GEO with accession number [GSE38207].
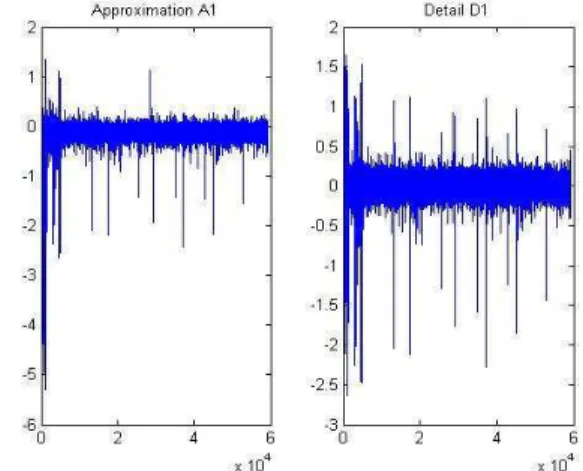
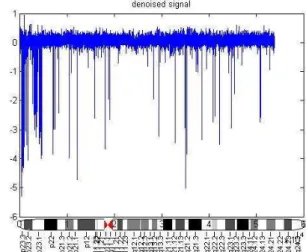
Figure.3 shows the coefficients of approximation and detail sub-band at level (1) in chromosome 4, sample (GSM936756-39376). Figure 4 displays the original and denoised signal using the soft threshold rule for chromosome 4. By performing DSWT algorithm in HCC cell lines using SNP array, it has been noticed that the most commonly gained region of chromosome 1q22.1–23.1 in 17 out of 30-hepatocellular carcinoma (57%), Fig.5 gains of 1q are the most frequent aberrations and occur early during tumorigenesis [29]. This region contains the tumor suppressors gens JTB, SHC1, CCT3and COPA [30].
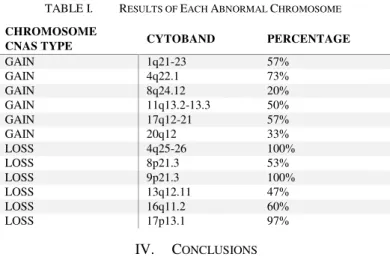
A region of 4q25-26 losses in 30 out of 30-hepatocellular carcinoma (100%) Fig.6. The allelic loss of chromosome 4q was significantly associated with hepatocellular carcinoma having elevated serum AFP [31].Gain of 8q observed in 6 out of 30-hepatocellular carcinoma (20%), Fig. 7 a loss of 8p was detected in 16 out of 30-HCC (53%) Fig.8 loss for 9p was observed in 30 out of 30-HCC (100%), Figu.9 gain of 11q was observed in 15 out of 30-HCC (50%), Fig.10 loss of 13q was observed in 14 out of 30 HCC (47%), Fig. 11 loss of 16q was observed in 18 out of 30-HCC (60%), Fig. 12 gain of 17q was detected in 17 out of 30-HCC (57%), deletion of 17p was observed in 29 out of 30-HCC (97%), Fig. 13 loss of 17p is one of the most frequent chromosomal aberration in primary hepatocellular carcinoma [32]. It has may affect the tumor suppressor gene TP53. TP53 is responsible for regulation of the cell cycle at G1/S and G2/M interfaces, as well as induction of apoptosis in response to severe damage to cellular DNA [33]. Gain of 20q was observed in 10 out of 30-HCC (33%), Fig. 14. All the results summarized in table 1.
Mai.S.Mabrouk et al [5], applied discrete stationary wavelet transform technique to a number of human chromosomes for analyzing array-CGH data to evaluate the prognosis of 67 HCC patients. The results show that a gain of 1q detected in 55% and a gain of 20q detected in 67% of HCC cases. In addition, a loss of 4q detected in 67%, a loss and gain of 8q, 8p detected in 87%, a loss of 13q detected in 72%, loss in 16q detected in 75%, and loss of 17q detected in 33% of HCC. Comparing the results obtained in this work with previous study it has been found that, high-density SNP array have better resolution and detect copy number variation regions better than array-CGH. That can help for mapping the whole genome of CNAs.
Performing DSWT analysis shows that there is an important observation for a novel altered region that detected an amplification region of 4q22.1 in 22 out of 30 HCC cell lines (73%) of AFF1 and DSPP genes, as shown in Figure 13, this finding have not previously reported to be involved in liver carcinogenesis. This observation may lead to discover new biomarker for HCC patients, or may be associated with other types of cancer [34]. It should be considered for future work on detecting copy number alternation regions.
Fig. 3. The coefficients of approximation and detail sub band
Fig. 5. Gain of chromosome 1q21-23
Fig. 6. Loss of chromosome 4q25-26
Fig. 7. Gain of chromosome 8q24.12
Fig. 8. loss of chromosome 8p21.3
Fig. 9. loss of chromosome 9q21.3-23
Fig. 11.loss of chromosome 13q12.11
Fig. 12.loss of chromosome 16q11.2
Fig. 13.Gain and loss of chromosome 17q12,17p13.1
Fig. 14.Gain of chromosome 4q22.1
TABLE I. RESULTS OF EACH ABNORMAL CHROMOSOME
CHROMOSOME
CNAS TYPE CYTOBAND PERCENTAGE
GAIN 1q21-23 57%
GAIN 4q22.1 73%
GAIN 8q24.12 20%
GAIN 11q13.2-13.3 50%
GAIN 17q12-21 57%
GAIN 20q12 33%
LOSS 4q25-26 100%
LOSS 8p21.3 53%
LOSS 9p21.3 100%
LOSS 13q12.11 47%
LOSS 16q11.2 60%
LOSS 17p13.1 97%
IV. CONCLUSIONS
The prognosis for patients with hepatocellular carcinoma is poor due to, the low chance of therapeutic treatment. The large majority of HCC cases happened in those with chronic liver disease, particularly HBV and HCV. To date, the exact mechanism of hepatocarcinogens is still remaining unclear. Many disease states, different types of cancer, can be better understood by discovering tumor biomarkers. These markers not only help in prediction of prognosis or recurrence but can also help in deciding appropriate modality of therapy and may represent novel potential targets for therapeutic interventions
result with a-CGH data. DNA-SNP array studies aim to identify novel serological markers, by targeting genes that characteristically highly expressed in HCC tissues.
This study demonstrates that genomic high-density SNP-array test could be used to detect and characterize genome-wide copy number alterations on more than one thousand clones arising from several chromosomes. By applying one-dimensional discrete stationary wavelet transform technique on 30 HCC cell lines, it has been found that there is a certain number of chromosome aberration including gains of
1q,8q,11q,17q,20q chromosomes and losses of
4q,8p,13q,16q,17p. A new observation region has been altered for amplification of chromosome 4 region 4q22.1. Genes expression profiling DSPP and SPP1 can lead to discover new biomarkers that may help improve diagnostic for detect HCC, represent novel targets for therapeutic agents, andallow us to identify regions in the HCC genome that have undergone frequent high-level focal amplifications or deletions.
REFERENCES
[1] N.I. Guha, J.P. Iredale, ‘’Clinical and diagnostic aspects of cirrhosis. In: Textbook of hepatology from basic science to clinical practice. 3rd edition. Edited by: Rodés J, Benhamou J-P, Blei A, Reichen J, Rizzetto
M. Oxford’’, Blackwell Publishing, 2007, pp.604-622.
[2] E.S.Hashim, M.S.Mabrouk, ‘’A study of support vector machine algorithm for liver disease diagnosis’’, American Journal of Intelligent Systems, 2014, vol.4(1),pp. 9-14
[3] F.X. Bosch, J. Ribes, M. Díaz, R. Cléries, ‘’Primary liver cancer:
Worldwide incidence and trends’’ Gastroenterology, 2004, vol.127, pp.5:16.
[4] A. S. Befeler and A. M. Bisceglie, ‘’ Hepatocellular Carcinoma:
Diagnosis and Treatment’’, GASTROENTEROLOGY, 2002, vol.122,
pp.1609-1619.
[5] M.S.Mabrouk, E.S.Hashim, A.Shrawy, ‘’ Discrete Stationary Wavelet Transform of Array CGH Data for Biomarkers Identification of Hepatocellular Carcinoma’’, 2012, vol. 1 (2), pp.148-154.
[6] R. Beroukhim, CH. Mermel, D. Porter, G. Wei, S. Raychaudhuri, J.
Donovan, et al. ‘’The landscape of somatic copy-number alteration across human cancers’’,Nature,2010, vol.463, pp.899-905.
[7] S.A. Lee, C .Ho, R. Roy, C .Kosinski, M.A Patil, A.D. Tward, et al.
‘’Integration of genomic analysis and in vivo transfection to identify
sprouty 2 as a candidate tumor suppressor in liver cancer.’’, HEPATOLOGY 2008, vol.47, pp.1200-1210.
[8] Y. Tanaka, F .Kanai , M .Tada, R .Tateishi M. Sanada M, Y. Nannya
,‘’Gain of GRHL2 is associated with early recurance of hepatocellular carcinoma’’J Hepatol. 2008, vol.49 (5), pp.746-57.
[9] Y. Midorikawa, W. Tang, Y .Sugiyama, ‘’High-resolution mapping of copy number aberrations and identification of target genes in
hepatocellular carcinoma’’, Biosci Trends 2007; 1:26-32.
[10] M.A Patil, I.Gutgemann, J. Zhang , C. Ho, S.T. Cheung, D.Ginzinger, et
al. ‘’Array-based comparative genomic hybridization reveals recurrent chromosomal aberrations and Jab1 as a potential target for 8q gain in
hepatocellular carcinoma.’’, Carcinogenesis, 2005,vol.26,pp.2050-2057. [11] T.C.Chen ,L.L. Hsieh , T.T. Kuo , K.F. Ng , W.C. YH, et.al, ‘’p16INK4
gene mutation and allelic loss of chromosome 9p21-22 in Taiwanese
hepatocellular carcinoma’’ Anticancer Res. 2000, vol.20(3A),pp.1621-6. [12] A.Kallioniemi, O.P Kallioniemi, D .Sudar, D. Rutovitz, J.W Gray, F.
Waldman, et al. ‘’Comparative genomic hybridization for molecular cytogenetic analysis of solid tumors.’’, Science 1992, vol.258, pp.818 -821.
[13] B.P Coe,B. Ylstra , B.Carvalho,G.A. Meijer, et al. ‘’Resolving the resolution of array CGH.’’ Genomics 2007, vol.89, pp.647–653. [14]Mai.S.M, Esraa. M. H, Amr. Sh. ‘’Statistical Approaches for
Hepatocellular Carcinoma (HCC) Biomarker Discovery.’’ American Journal of Bioinformatics Research, 2012, vol.2 (6), pp.102-109.
[15] A.E. Ostlander, G.A. Meijer, B. Ylstra, ‘’Microarray-based comparative
genomic hybridization and its applications in human genetics’’. Clin
Gene, 2004, vol.66, pp.488-495.
[16] T.L.Framboise, ‘’ Single nucleotide polymorphism arrays: a decade of biological, computational and technological advances’’, Nucleic Acids Research, 2009, Vol. 37(13), pp. 4181–4193.
[17] L.Winchester, C. Yau and Jiannis Ragoussis, ‘’ Comparing
CNVdetection methods for SNP arrays’’, BRIEFINGS IN
FUNCTIONAL GENOMICS AND PROTEOMICS, 2009, VOL 8(5), pp.353:366.
[18] J.Kennedy, ‘’ Efficient Algorithms for SNP Genotype Data Analysis
using Hidden Markov Models of Haplotype Diversity’’, M.Sc.,
Rensselaer, Hartford, CT, USA, 2002.
[19] G.M. Cooper, T. Zerr, J.M. Kidd, et al. ‘’Systematic assessment of copy number variant detection via genome-wide SNP genotyping.’’ Nat Genet 2008, vol.40 (10), pp.1199–203.
[20] L.Franke, C.G. Kovel, Y.S Aulchenko, et al. ‘’Detection, imputation, and association analysis of small deletions and null alleles on
oligonucleotide arrays.’’ AmJ Hum Genet, 2008, vol.82 (6), pp.1316– 33.
[21] L. Kruglyak, D.A. Nickerson,’’Variation is the spice of life’’,Nat. Genet., 27 (2001), pp. 234–236.
[22] https://icom.illumina.com/ icom/software.ilmn, 2015.
[23] K. Wang,M. Li, D. Hadley, R. Liu, J. Glessner, S. F. Grant, H. Hakonarson, and M. Bucan, ‘PennCNV: An integrated hidden Markov model designed for high-resolution copy number variation detection in whole-genome SNP genotyping data’’, Cold Spring Harbor Laboratory Press,2007, vol.17, pp. :1665–1674.
[24] R.S. Stankovic, B.J.Falkowski, ‘’ The Haar wavelet transform: its
status and achievements’’, Computers and Electrical Engineering, 2003,
vol. 29, pp.25:44.
[25] E.S.Hashim, M.S.Mabrouk, ‘’Impact of parallel computing on
identifying biomarkers of hepatocellular carcinoma’’, J. Med. Imaging Health Inf, 2014, vol.4, pp. 1–5.
[26] Nha Nguyen, S. Oraintara, H.Huang,and Y. Wang, ‘’ Denoising of Array-Based DNA Copy Number Data Using The Dual-tree Complex
Wavelet Transform’’ International Conference on Bioinformatics and Bioengineering,2007, pp. 137 – 144.
[27] P. Hedaoo1 and S.S Godbo, ‘’ wavelet thresholding approach for image
denoising’’, International Journal of Network Security & Its
Applications (IJNSA), Vol.3, No.4, July 2011.
[28] E. M.Hashim, M. S. Mabrouk, A.Sharawy, ‘’Circular Binary Segmentation Modeling of Array CGH Data on Hepatocellular carcinoma.’’, Radio Science Conference (NRSC), 29th National, 2012, pp. 667 – 674.
[29] A. Subramanian, P. Tamayo, V.K. Mootha, et al. ‘’Gene set enrichment analysis: a knowledge-based approach for interpreting genome-wide
expression profiles.’’, Proc Natl Acad Sci USA, 2005, vol.102,
pp.15545–15550.
[30] Y .Wang, M.C. Wu, J.S. Sham, W .Zhang, W.Q .Wu, and X.Y. Guan.
“Prognostic significance of c-myc and AIB1 amplification in hepatocellular carcinoma. A broad survey using high-throughput tissue
microarray.’’ Cancer, 2002, vol.95, pp.2346–52.
[31] Q. Deng, S. Huang. “PRDM5 is silenced in human cancers and has growth suppressive activities.’’, Oncogene, 2004, vol.23, pp.4903–10. [32] RS. Cornelis, M.v. Vliet, CB. Vos, AM. Cleton-Jansen, MJ .van de
Vijver, JL .Peterse, et al. “Evidence for a gene on 17p13.3, distal to TP53, as a target for allele loss in breast tumors without p53 mutations.’’
Cancer Res1994, vol.54, pp. 4200–6.
[33] A. Singhal , M.Jayaraman , D.N. Dhanasekaran , V. Kohli, ‘’ Molecular and serum markers in hepatocellular carcinoma: Predictive tools for
prognosis and recurrence’’, Critical Reviews in
Oncology/Hematology,2012, vol. 82 ,pp.116–140.
[34] R.Hill , RK .Kalathur , L .Colaço , R. Brandão , S .Ugurel ,M. Futschik
, ‘’TRIB2 as a biomarker for diagnosis and progression of melanoma.’’