www.nat-hazards-earth-syst-sci.net/12/2411/2012/ doi:10.5194/nhess-12-2411-2012
© Author(s) 2012. CC Attribution 3.0 License.
and Earth
System Sciences
Grid based calibration of SWAT hydrological models
D. Gorgan1, V. Bacu1, D. Mihon1, D. Rodila1, K. Abbaspour2, and E. Rouholahnejad2
1Computer Science Department, Technical University of Cluj-Napoca, Romania 2EAWAG, Swiss Federal Institute for Aquatic Science and Technology, Switzerland
Correspondence to:D. Gorgan ([email protected])
Received: 6 April 2012 – Revised: 26 May 2012 – Accepted: 30 May 2012 – Published: 31 July 2012
Abstract.The calibration and execution of large hydrologi-cal models, such as SWAT (soil and water assessment tool), developed for large areas, high resolution, and huge input data, need not only quite a long execution time but also high computation resources. SWAT hydrological model sup-ports studies and predictions of the impact of land manage-ment practices on water, sedimanage-ment, and agricultural chem-ical yields in complex watersheds. The paper presents the gSWAT application as a web practical solution for environ-mental specialists to calibrate extensive hydrological mod-els and to run scenarios, by hiding the complex control of processes and heterogeneous resources across the grid based high computation infrastructure. The paper highlights the ba-sic functionalities of the gSWAT platform, and the features of the graphical user interface. The presentation is concerned with the development of working sessions, interactive control of calibration, direct and basic editing of parameters, pro-cess monitoring, and graphical and interactive visualization of the results. The experiments performed on different SWAT models and the obtained results argue the benefits brought by the grid parallel and distributed environment as a solu-tion for the processing platform. All the instances of SWAT models used in the reported experiments have been devel-oped through the enviroGRIDS project, targeting the Black Sea catchment area.
1 Introduction
The studies and the predictions of environmental phenomena are based also on complex hydrological models by process-ing huge spatial data sets in order to obtain high resolution re-sults. Actually, the simulation sessions and the searching for a convergence toward the optimum calibrated model are not trivial processes, and require the use of flexible interactive
tools. Sometimes the obtained results are not relevant enough to obtain meaningful predictions, and the processing has to be repeated several times by the user. Better predictions re-quire a great number of simulations, which increase the com-putation resources needed to process all this data. Moreover, extensive resources are imperatively required by high qual-ity services in a scalable system. The scalabilqual-ity is defined in terms of number of users, number of application instances, number of running models, and number of computation and storage resources.
Grid infrastructure offers such a solution for high power computation and extensive resources, but it involves as well a lot of issues such as the management of interoperable soft-ware and hardsoft-ware platforms, distribution of huge spatial data model over storage nodes, process scheduling, parallel and distributed processing, execution monitoring, load bal-ancing, security, scalability, and many others.
One of the main challenges of the user application is to hide the complexity of grid infrastructure management, and to offer all the main functionality to the specialist user, sim-ilar with the case of processing and visualization through a local application, similar with a single user of resources, data protection, and good control of processing. The user must have all the time feedback information about the model sta-tus, progression of the task execution, results, quality of pro-cessing, and user interaction.
supported by the graphical user interface, in order to provide good usability.
The presentation is concerned with the development of the working sessions (i.e. projects), interactive control of the cal-ibration, direct and basic editing of parameters, process mon-itoring, and the graphical and interactive visualization of the results. A few practical experiments have been performed on different SWAT models (SWAT, 2012), and the achieve-ments argue indeed the benefits brought by the grid paral-lel and distributed environment as a solution for the process-ing platform. The gSWAT application and the SWAT hydro-logical models used in the reported experiments have been developed through the enviroGRIDS (Black Sea Catchment Observation and Assessment System supporting Sustainable Development), funded by the European Commission (EC) through 7th Framework Programme (FP7) (enviroGRIDS, 2012), targeting the Black Sea catchment area, and partic-ularly the Danube River.
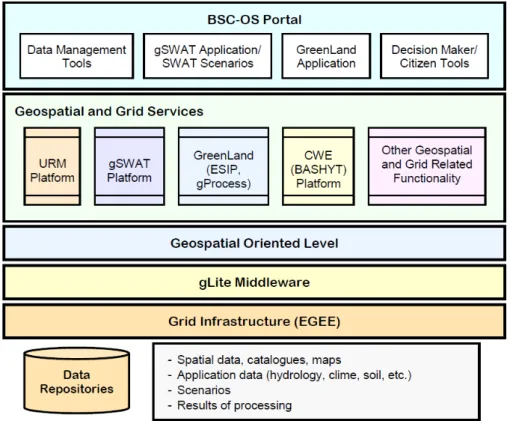
The enviroGRIDS system resources are accessible to the large community of users through the Black Sea Catch-ment Observation System (BSC-OS) portal that includes the gSWAT application as well as other web applications for data management, satellite image processing, report generation and visualization, and virtual training center (Fig. 1).
The gSWAT platform and application improve the features and the performance by significantly reducing the total cali-bration time through high storage and computing capabilities due to the grid infrastructure, multicalibration processing, exposure as web application, and interactive results manage-ment. Calibration and execution results of the SWAT model could be analysed and visualized over interactive maps, using different image processing algorithms in order to correctly classify the land management practices on water, sediment or agricultural chemical yields. All of these features will be described in the following sections.
The paper is structured as follows: Section 2 presents the works and achievements related with the enviroGRIDS project. Section 3 describes the SWAT hydrological model as the main model used by gSWAT application. Section 4 anal-yses the requirements of the parallel and distributed process-ing of SWAT models. Section 5 enumerates the high power computation possible solutions, and concerns mainly on grid infrastructure. The gSWAT solution is described in Sect 6. Section 7 details the graphical user interface and the avail-able features. Section 8 enumerates the user categories re-lated with gSWAT based scenarios. Three experiments are described and analyzed in Sect. 9. The last section sketches the conclusions and the future research directions regarding the hydrological model processing.
2 Related works
The enviroGRIDS project aims to use the SWAT model as a high-resolution (i.e. sub-catchment spatial and daily
temporal resolution) water balance model for the entire Black Sea catchment. The model will be calibrated and validated using river discharge data, river water quality data, and crop yield data as in Abbaspour et al. (2007). The Black Sea wa-tershed related hydrological model is very complex due to the highly interconnected and continuously evolving inter-actions at many spatial and temporal scales, and requires to gather and integrate different sets of environmental data (e.g. physical, chemical, biological) (GEO, 2007). Other Eu-ropean projects aim environmental related subjects (Environ-ment, 2011). IS-ENES project develops the European Net-work for Earth System Modeling (ENES), which calls to-gether the European climate/Earth system modeling commu-nity in order to work on understanding and prediction of fu-ture climate change. Many other European projects such as SAW-GEO, CYCLOPS, GDI-grid, GEO-grid, DEEGREE, DORII, and GENESI-DR address the management of spatial data and environmental tools and applications.
The hydrological models can be developed by some simi-lar tools such as SWAT (SWAT, 2012), HSPF (HSPF, 2012), and SHETRAN (Ewen et al., 2000). HSPF (Hydrological Simulation Program – Fortran) is a software application that simulates the hydrological and associated water quality pro-cesses on pervious and impervious land surfaces. SHETRAN (Syst`eme Hydrologique Europ´ean) models coupled surface and subsurface water flow in river basins. The process-ing results are visualized by animated graphics. SHETRAN could be used in the analysis of environmental impacts: land erosion, pollution, climate change, or in surface-water and ground-water resources studies.
One of the main goals of the gSWAT application is related to the assessment of the sustainability and vulnerability in the Black Sea catchment. Calibrating the SWAT model becomes an important problem when applying the model on such large watersheds. In these cases the calibration time could take days to complete, even on the finest standalone machines. There are a few approaches and tools that could be used to calibrate the SWAT model. The first one is to execute the calibration process on a single-core machine. An important progress was already established in this direction through the SWAT-CUP (SWAT Calibration and Uncertainty Proce-dures) application (Abbaspour et al., 2008). SWAT-CUP is a software tool designed to calibrate the SWAT model, based on some input parameters. The tool provides complex ca-pabilities regarding the analysis of the calibrated outputs by charts. This solution supports efficiently small watershed SWAT models. The second solution extends the SWAT-CUP application to work on multicore machines. This significantly reduces the total calibration time, but still could not be ap-plied on large watersheds (e.g. huge Black Sea catchment models), just on small and medium ones. Even though the SWAT-CUP application is used for several years to perform the SWAT model calibration process.
Fig. 1.BSC-OS portal architecture.
high computation and storage capabilities. The main differ-ence between them is that the grid could be used free of charge as long as the user has valid grid certificates, signed by a competent CA (Certificate Authority). Meantime, using the cloud infrastructure, users have to pay for each time they use its services. With proper configuration and scheduling mech-anisms of the large scale distributed systems, analysed and experimented in Pop et al. (2008); Simion et al. (2007); Pop (2010), the grid infrastructure could provide significant speed up, regarding the calibration and execution of the SWAT hy-drological model. The Experimental results section details all these aspects.
The goal of the DRIHMS project (DRIHMS, 2012) is to systematically build a bridge between the HMR (hydro-meteorological research) and ICT (information and comput-ing technology) communities, and to identify requirements of HMR users and match them to capabilities of the newly developed ICT infrastructure.
The projects EGEE (EGEE, 2010), SEE-GRID-SCI (SEE-GRID-SCI, 2010), and C3grid (C3Grid, 2012) provide solu-tions for sharing complex spatial and environmental data sets and grid based processing tools and applications. The aim of the C3grid project, for instance, is to create a grid based working environment for Earth system research.
The coordination of the grid infrastructure is now taken over by the European grid initiative (EGI, 2012), which is the future sustainable computing grid infrastructure in Europe.
The new European middleware initiative (EMI) aims to im-prove and standardize the dominant existing various middle-ware in order to produce one simplified and interoperable middleware (EMI, 2012). EMI attempts to unify a few grid platforms such as ARC (ARC, 2012), gLite (gLite, 2012), Unicore (UNICORE, 2012) and dCache (dCache, 2012). The EMI platform will empower the EGI infrastructure with more stable, usable and manageable software.
Although a recent survey (Lecca et al., 2011) indicates that grid technology in hydrology has been successfully tested to improve flood prediction and ground-water resources man-agement, only minimal efforts on reduction of computation time have been made in the past for SWAT modeling (Whit-taker, 2004).
The enviroGRIDS project gathers solutions and experi-ence from all these mentioned projects in order to approach the particularity of the Black Sea catchment in terms of SDI, platforms interoperability (i.e. geospatial and grid, and soft-ware platforms like URM, gSWAT, ESIP, eGLE, etc), high resolution models, processing scalability, user interaction us-ability, and processing efficiency (Gorgan et al., 2011).
3 Hydrological models
hydrologic prediction. One of the main problems that exist when using the hydrological models is that different combi-nations of parameters or even different model structures yield similar results in terms of a defined performance measure, or objective function. This is a serious problem as it leads to dif-ficulties in interpreting past behavior of the catchment system but also future predictions.
SWAT (Soil and Water Assessment Tool) (SWAT, 2012) is a large scale hydrological model developed to estimate the impact of different land management practices on wa-ter quantity and quality, sediment and agricultural chemical yields in large, complex watersheds. It allows a number of physical processes to be simulated in a basin (Yalewa et al., 2010). Basic data requirements for SWAT models include elevation, soil properties, topography, land use, and climate data. Depending on the objective of the model information, the calibration of the model requires river discharge data, water quality information (sediment concentration, levels of nitrate, levels of phosphate, etc.), and agricultural practices (fertilizer application, harvesting, irrigation, etc.). The inputs of SWAT models can be grouped by different levels of de-tail: watershed, sub-basin, HRU and reservoirs, and the input files can be gathered from different sources and in different formats.
Applying hydrological models and obtaining meaningful predictions requires performing both a good calibration and a good prediction analysis. The need for a model calibration is a major limitation, especially where no stream-flow mea-surements are available. To calibrate a selected model struc-ture to a large number of catchments, statistical relationships between the parameters and the characteristics of the catch-ment, such as size, land use or soil types, must be established. These relationships can then be used to derive parameter val-ues for an un-sized (not-calibrated) catchment. In the model calibration process, the parameters are adjusted until the sys-tem output and the model output show an acceptable level of agreement, usually measured by an objective function. Man-ual calibration is time consuming and difficult in the presence of parameter dependence, especially for non-specialist users. From the hydrological point of view, SWAT model calibra-tion consists of three steps: water balance and stream flow, sediment and nutrients. This process is very expensive, as it is based on the Monte Carlo approach. From the computa-tional point of view, the SWAT calibration is the process of running SWAT iterations several times, using different pa-rameter sets, until the calibration criteria is satisfied (Rodila et al., 2011b). Each such iteration consists of hundred of sim-ulations which are independent one from another.
4 Parallel and distributed execution of SWAT hydrological models
Some large problems can be subdivided into smaller ones, which can run in parallel. There are several forms of parallel
computation, each one dealing with different strategies, such as with instruction, data or task parallelism. For SWAT, the parallelism at instruction level is quite a difficult task. The data parallelism is much easier to accomplish based on the idea of the calibration process. The task parallelism would re-quire splitting the high resolution SWAT hydrological model into smaller components that could be computed in parallel.
The parallel computation can run on various infrastruc-tures, such as multicore machine, cluster, grid or cloud. A multicore machine can offer limited computational resources where the grid or cloud can offer theoretically unlimited re-sources. In addition, based on the execution requirements, the computational infrastructure could select the best suitable re-source.
The calibration process takes, in general, very much time, mainly because of the complexity of the SWAT hydrolog-ical models and the necessity to run multiple iterations. In each iteration we need to execute a high number of simula-tions. To decrease the execution time, we must parallelize the application at some level (simulation, executable or model). The resources needed for calibrating SWAT models are dis-tributed: data on a dedicated storage resource and execution on different computational resources. The easiest way is to parallelize the execution at the simulation level. This paral-lelization is implicit for the calibration process because each simulation runs independently of the other ones. In this way, we can theoretically execute each simulation on a different processor. We don’t need to split the model, we just run each simulation on another machine.
For the gSWAT application, we have chosen this method, parallelization at the simulation level, because it can be used for any SWAT hydrological model, it does not depend on the model itself.
5 High power computation infrastructure
Both the calibration and the execution of SWAT models re-quire a large number of input and output data files. Due to the large set of input and output data and the high number of simulations required for obtaining a good and meaning-ful SWAT model calibration, there are some basic compu-tational requirements needed to be fulfilled. These require-ments can no longer be assured by a desktop computer or a single server; they require a high power computation infras-tructure able to offer high computational resources as well as storage resources.
5.1 Multicore architecture
exploited as execution environment for SWAT models cali-bration (Rouholahnejad et al., 2011) and the obtained results were quite promising compared to desktop execution. 5.2 Cloud infrastructure
The definition of cloud computing, given by the European expert group, is the following: “A cloud is an elastic execu-tion environment of resources involving multiple stakehold-ers and providing a metered service at multiple granularities for a specified level of quality (of service)”. The research in-terests in the cloud computing area are oriented on solving problems like interoperability, portability, data distribution and protection, automatic management of resources, elastic scalability, etc. In the context of SWAT hydrological models, we are planning to experiment the execution of SWAT cali-bration over an experimental cloud and to make a compara-tive analysis for the advantages offered by cloud compared to the grid infrastructure.
5.3 Computer cluster
By computer cluster, we understand a set of connected com-puters that are working together and from the outside the cluster can be viewed as a single system, or a virtual com-puter. In such a system architecture, each cluster component, or node, runs its own instance. They are mainly used to im-prove computational performance and availability. The solu-tion to parallelize the calibrasolu-tion process on computer clus-ters is somehow similar to the one for the grid infrastructures, but lacking the scalability offered by grid.
5.4 Grid infrastructure
The grid infrastructures are offering both computational and storage solutions for scientific communities. The provided functionality is exposed through a set of services, dealing with security, data management, execution, information, etc. Grid users are grouped under the umbrella of a so-called vir-tual organization (VO) and are sharing the same resources, data, processors, software components and the hardware in-frastructure. Each VO is in particular addressed to a specific scientific community, such as earth science, physics, biology, oceanography, etc.
In order to access the grid resources each user must first be authenticated and authorized. To authenticate, the user must have a grid certificate, which can be viewed as a per-sonal identity card, issued by a certification authority (CA). For each VO the virtual organization membership service (VOMS) allows defining privileges for each user that makes part of that VO (meaning the authorization). The typical en-try point in a grid infrastructure is the user interface (UI), which allows the users to perform some operations using a command line interface. For instance, the users can submit jobs for execution, manage their running jobs (cancel the ex-ecution, retrieve the output from the completed jobs, view the
status of the running jobs, etc.), manage data, or interrogate the Information System to retrieve information related with available resources. This approach is not suitable for all kinds of users, so in many cases the users access the grid function-ality through a graphical user interface that hides some of the complexity of the underlying infrastructure.
A job represents a unit of work and is described by spec-ifying some information such as the name of the program to run, the input files, the output files that are produced and the requirements that must be fulfilled by the machine that will execute the job. Each job will be executed on a worker node (WN), basically the computational resource. To sub-mit jobs, the users interact with a computing element (CE). The CE is a collection of computing resources (WNs) that are localized at a site (similar to a cluster). Each CE has an entry point, which is the generic interface to the computing resources, and a local resource management system, which manages grid jobs.
A user or an application stores data on a storage element (SE), which is a specialised machine that provides uniform access to data storage resources. The data that is stored on a SE is considered read-only, meaning that the data can be changed only by physically removing it or replacing it. The information service (IS) provides information regarding the grid resources used mainly for monitoring purposes. The most important grid middlewares are gLite and Globus. Both of them are offering services related to job and data manage-ment, security, monitoring, etc.
In the enviroGRIDS project, we have created a VO called envirogrids.vo.eu-egee.org. Currently we have integrated one CE (ce01.mosigrid.utcluj.ro) and one SE (se01.mosigrid. utcluj.ro). The computational resources consist of 128 physi-cal CPUs, meaning a total of 1024 logiphysi-cal CPUs. The storage capacity is approximately of 13 TB.
5.5 Grid based solution for SWAT calibration
The most important algorithms that could be used for cal-ibrating SWAT hydrological modes are SUFI2 (Sequential Uncertainty Fitting), GLUE (Generalized Likelihood Uncer-tainty Estimation) and ParaSol (Parameter Solution). SUFI2 can be used for obtaining quick calibration results, but it is not as accurate as GLUE or ParaSol algorithms. It per-forms uncertainty analysis for the SWAT hydrological model, based on some objective functions, including Chi square, Nasch-Sutcliffe, R2 and bR2. It is the most suitable algorithm for parallelization because each simulation can run indepen-dently.
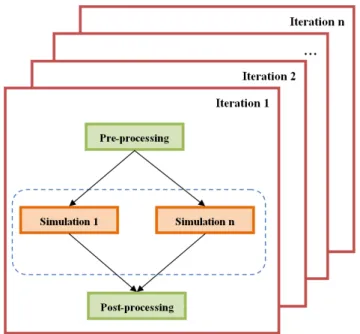
Fig. 2.SWAT model calibration process.
The calibration process (Fig. 2) consists of running a vari-able number of iterations until a calibration goal is fulfilled. For each iteration, we are performing the same steps:
1. pre-processing – we generate the parameter sets for each simulation using the Latin hypercube sampling. Together with the SWAT model, it represents the input data for one simulation;
2. execution of simulations – we execute each simulation on a WN from the grid infrastructure;
3. post-processing – we compute the goal function value for each simulation and we determine new parameter ranges.
The pre-processing and post-processing steps are not so computational intensive so we are executing them on the server side, not in grid. We are submitting only the simu-lations to be executed on the grid resources. The monitoring of simulations is very important because we need all the sim-ulations to provide some output results. If the execution of one simulation fails then we need to execute again the same simulation.
Depending on the SWAT hydrological model complexity, we reserve a number of WNs to be used to run the simula-tions. Because the number of simulations will be in general higher than the number of WNs that we are reserving, each WN will execute one or more simulations. For each simu-lation, we copy the initial SWAT hydrological model from SE, we copy the parameter set that was generated from the gSWAT server, we run the SWAT model and in the end, we collect the results.
Fig. 3.gSWAT application flow.
6 gSWAT application
The gSWAT is a client-server platform (Fig. 3) used in the process of calibrating medium and large SWAT hydrologi-cal models. Because it is a web-based application, it does not require any kind of installation for which the house-hold user should be concerned. It is a remote application, which could be accessed over the Internet. It is worth mentioning that the implementation of such a system raised several prob-lems, such as processing large volumes of data, security is-sues regarding data access, implementing simple but power-ful human-computer interaction techniques, etc. The follow-ing paragraphs will describes these kinds of problems along with their technical solutions.
Another important feature of the gSWAT platform is re-lated to the possibility of creating prediction scenarios (e.g. water-use sustainability, improving irrigation systems, im-proving crops growth by changing the quantity of nutrients, etc) based on data obtained through the SWAT model. Be-cause this data mainly consist of estimated values, first a cal-ibration algorithm is needed to bring these values as close as possible to measured values for the same watersheds. These estimated values are used mainly in the prediction process (e.g. what impact will have a larger quantity of nutrients on surrounding land crops?) (Pohlert et al., 2007; Zhang et al., 2008).
Fig. 4.Functional layers of the gSWAT application.
interface through user requests. The main advantage of the web services are their accessibility and compatibility with all software platforms and programming languages.
This section points out the most important user interaction techniques implemented within the gSWAT application and describes them in a simple and intuitive manner.
6.1 gSWAT based hydrological model processing
In this section, we are presenting the entire flow regarding the SWAT hydrological model integrated in the enviroGRIDS portal. Most of the tools and applications involved in this flow are developed in the frame of the enviroGRIDS project. SWAT hydrological models are developed using special-ized software such as ArcSWAT or AvSWAT. The ArcSWAT application is an ArcGIS-ArcView extension providing a flexible graphical user input interface for developing SWAT models. To be able to define specific scenarios on a SWAT model, the user has to calibrate it. The calibration process re-quires huge computation resources for high-resolution mod-els (involves the running of hundreds and even thousands of simulations) that can be offered by the grid infrastruc-tures. After the calibration process is completed and the model is calibrated we need to upload the calibrated model to BASHYT (the basin scale hydrological tool) (Manca et al., 2009). BASHYT is a web-based interface that allows to define new scenarios in a flexible manner. New scenarios, which represent new SWAT models, are transferred to the gSWATSim (Bacu et al., 2011) component, which is special-ized in executing scenarios. gSWATSim application runs the scenario also on the grid infrastructure and then uploads the execution results to BASHYT. The user has the possibility to visualize reports developed in BASHYT and based on the scenario execution. A report aggregates different information such as maps, charts, tables, images, text, etc.
6.2 gSWAT oriented architecture
The gSWAT application is composed of three different func-tional layers (Fig. 4):
1. the Graphical User Interface – it is developed in Adobe Flex and allows the users to define the calibration
parameters, to start and monitor the calibration process, to visualize and download the output results;
2. the gSWAT Services – create new calibration projects, upload SWAT models, start new iterations, save finished iterations, delete iterations, upload data to grid in Stor-age Element, download output data, monitor the execu-tion of the calibraexecu-tions, update the iteraexecu-tion status; 3. the Computational and Storage resources – are the
re-sources that are used in the calibration process; the users access these resource in a transparent manner, using the graphical user interface. The gSWAT services are ex-posed as web services and can be used to define other applications or to integrate the calibration functionality.
7 gSWAT graphical user interface
7.1 gSWAT features overview
This application has a simple design that adopts the Nielsen heuristics. This design is divided into three main sections: the menu bar options, the projects list and a user actions ded-icated section. The menu provides a set of options that be-came active based on the user’s current operation (e.g. the upload menu item is active only for projects with empty or in-complete uploading statuses). Projects management, grid ex-ecution and monitoring capabilities and output visualization are the most important features provided to the user through-out the gSWAT menu module.
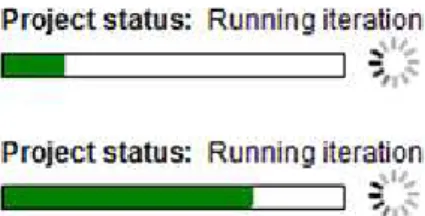
It is worth mentioning that each project has a status that reflects its grid calibration progress. The supported statuses are (Fig. 5): Empty project (the project exists in the database only by name, but no physical inputs were attached), incom-plete upload (uploading SWAT model inputs failed due to technical inconsistencies), uploading project (uploading in-put data set in progress), loaded project (all files were suc-cessfully uploaded to the server), running iteration (SWAT model calibration is in progress), incomplete iteration (gen-erated by different technical problems, such as grid or net-work failure), and finished iteration (the calibration process successfully ended for the current iteration). A progress bar is displayed for the projects that have uploading project or running iteration status. This feature estimates the remaining time to complete the action. The projects list contains min-imal information about all the users’ projects. By default, a project has a private access attribute for all other users.
Fig. 5.User projects list.
Fig. 6.Project information details.
Each action of the user is recorded into the system log that acts like a history mechanism for the users’ actions. At each new user’s operation, some specific information will be au-tomatically added into this log, along with the project name and the time stamp related to this operation. Error messages are also part of this mechanism in order to increase the re-cover from error usability.
7.1.1 Search and filter mechanism
When the projects list grows in size, the search and filter sys-tem is very useful for the user. The search mechanism allows the finding of projects based on keywords that are contained in the project’s name or description. For generality, the search is not case sensitive, meaning that capitalized and lowercase letters could be used with the same effect. The filter mecha-nism updates as well the projects list in real time. The possi-ble filters are closely related to the project status, but a date filter is also implemented (Fig. 7).
Fig. 7.Filter settings for user projects list.
Taking into account the fact that the user may access the application from different geographical locations or different physical machines, a new mechanism should be implemented in order to apply the same filters, defined by the user, from one session to another. In the gSWAT preloading phase, a web service provides from a centralized database the filter settings for the logged in user. Figure 7 presents the possible list of filters that the user could choose from. For saving these settings, the last check box should be selected.
7.1.2 Input data specification
After creating a new project by using the gSWAT menu fea-tures, it’s time to assign it with input data (TxtInOut folder from a SWAT model in our case). This action is performed through an upload mechanism integrated within the gSWAT platform. After this stage, the project displays the loaded sta-tus. Because the gSWAT application is designed to deal with medium and large watersheds, the TxtInOut folder could reach thousands of files in size. Taking this into account the user is restricted to upload folders archived as zip, rar or tar.gz. The limitation refers only to the files packaging and has no restriction regarding their size. The upload mecha-nism requires two user related actions:
Fig. 8.SWAT calibration in multiple process phases.
with the new incoming information. A progress bar in-dicates the stage of the upload process. It is worth men-tioning that the upload mechanism is highly dependent on the network traffic and bandwidth and on the num-ber of users that simultaneously access the application server.
7.1.3 Starting SWAT calibration process
Using the start calibration menu feature, the user is able to calibrate an already uploaded SWAT model. Before this ac-tion, all the internal parameters that could affect the calibra-tion result should be specified. This pre-processing step is done through the text editor module that will be presented in the following paragraphs.
When the SWAT calibration process starts a general timer is activated that periodically interrogates the database. This way the graphical user interface of the gSWAT application is always up to date with the calibration progress on the worker nodes of the grid. It is worth mentioning that all the SWAT calibration processes are done on the grid infrastructure due to its high computation and storage capabilities.
The calibration progress in the gSWAT user interface is represented by a progress bar, that starts from 0 % (initial phase) up to 100 % (at the end of the calibration). As each job finishes its execution this progress bar updates accordingly. Also an animated spinning wheel is placed along with this graphical feature, to give the user an extra execution feed-back (Fig. 8). In this step the project displays the running iteration status.
At any time in the calibration process the user is able to stop the grid execution by clicking on a single button, called stop calibration. The actions performed in the background are transparent for the user, and have the effect of cancelling all calibration related tasks.
Before starting a new calibration of the same SWAT model, the user has the possibility to save its previous work. All the saved iterations are accessible to the user in the itera-tion history folder, placed in the TxtInOut tree structure. 7.1.4 Output results analysis
When creating a new project in the gSWAT application, a predefined folders and files structure as created on the server side. This structure is then loaded into the graphical user in-terface, where it could be explored by the user.
The gSWAT editor module offers the possibility to edit the files contained in this TxtInOut structure. On double click event on these files, their content is displayed into a text area, readable and editable for the user. This text editor supports multiple files opened at the same time, where each such file is located in a different tab.
The basic operations that exist in any other text editor tools were already implemented into the gSWAT application (save file, save all file, close file, redo, undo, copy and paste etc). When the content of a file is modified by the user, an asterisk (*) appears at the beginning of the file name. This alerts the user that the content inside that tab was not saved. Also, the action of editing large files, with tens of thousands of lines is supported by the editor module.
The output results of the SWAT model calibration pro-cesses consists of several data files that contain values of the calibrated parameters. One of these files is extremely impor-tant because it could be displayed to the user as an interactive chart, as presented in Fig. 9.
All the data represented in the chart module is parsed from the 95ppu.txt file. The plotted values are not dependable on the number of parameters listed in this file. The example de-scribed in Fig. 6 contains only 5 such parameters. This chart defines the best estimated parameters values (obtained during the SWAT calibration process) and the observed ones (mea-sured from station spread across the entire watershed) so that the specialist could make a statistical approximation of the calibration accuracy. An uncertainty analysis could be per-formed based on this kind of data representation.
The tool tips button displays numerical values for the chart key points. Each inflexion point gives the user the possibility to visualize the best estimated and ground measured values of the SWAT parameters. The x-axis of the chart represents the temporal scale used in the calibration process. The y-axis displays the numerical values for the current selected param-eter. The user could also increase or decrease the temporal interval by using an animated slider with two thumbs. Each thumb represents one of the extremities of this interval (e.g. if 17 months data is available, the user could reduce it to dis-play only usable information for the time interval represented by the 12th and 17th month value on the x-axis of the chart).
8 gSWAT user categories
The gSWAT platform is useful in developing use case scenar-ios, based on calibrated SWAT models. The purpose of these scenarios is the prediction and analysis of different Earth phenomena, in the hydrological domain field. The gSWAT application could be used by specialists in the hydrology and computer science domains, or by non-technical persons who are interested in visualizing the output results of different scenarios created by the specialists.
Fig. 9.Detailed visualization of the gSWAT calibration results.
the grid and the web data levels. The first one allows the users the possibility to calibrate SWAT models over the grid in-frastructure and to transfer data between the grid nodes and the application server. The second role restricts the users to access only public data, available outside the grid infrastruc-ture. This means that they could only analyze the SWAT cali-bration outputs, create use case scenarios based on the SWAT calibrated models, perform statistic measurements, etc. At a closer look, the gSWAT user categories could be further di-vided into data providers, specialists, decision makers and citizens:
– Data providers – this category includes the governmen-tal agencies, hydrology domain field specialists or other persons who are willing to share SWAT models with the gSWAT community. The data confidentiality is assured by the grid certificates and web credentials owned by these users.
– Specialists – they are involved in the SWAT calibration process over the grid infrastructure. The specialists have access to both web and grid data repositories. The main goal of this user category is to provide calibrated SWAT models that could be used in the creation process of use case scenarios.
– Decision makers – these types of users operate only at the web application layer. They analyze the results ob-tained during the SWAT calibration processes and de-cide if the models are suited to be used in predicting different Earth natural phenomena.
– Citizens – they can only access results obtained during the scenarios execution process. These results play an
informative role regarding the predictions for the simu-lated Earth phenomena.
9 Grid based experiments
The calibration of SWAT hydrological models has been suc-cessfully executed over the grid infrastructure in several ex-periments performed on different SWAT models and the ob-tained results were able to sustain the benefits brought by the grid parallel and distributed environment as execution plat-form. All the instances of SWAT models used in our exper-iments have been developed by our enviroGRIDS partners from EWAG and they are targeting the Black Sea catchment area.
Fig. 10.Danube 1 total calibration time over the grid.
9.1 Medium SWAT model processing
The first experiment consists in executing the calibration of Danube1 over the grid infrastructure with 48 simulations. We have performed several tests, with a varying number of com-puting elements (worker nodes in the case of the grid) and we have also made a comparative analysis (Rodila et al., 2011a,b) based on the obtained results and these obtained by our partners (Rouholahnejad et al., 2011) when execut-ing the same model instance on a multicore architecture. The reference point for this experiment is the execution of the model calibration process on a single server, without any par-allelization options which took approximately 2 days (1 day, 11 h and 30 min – 127 920 s).
Figure 10 (Rodila et al., 2011a) presents the execution results in seconds obtained for running one iteration with 48 simulations in the process of Danube1 calibration over the grid while varying the number of worker nodes (processing units): 20, 30, 40 and 50 nodes.
The calibration of Danube1 took around 39 min when us-ing 20 processus-ing units and around 31 min with 50 process-ing units, compared to almost 2 days in which it took to exe-cute the same process sequentially on a single server. These results clearly emphasize the strength of the grid infrastruc-ture in executing large scale processing as well as the suc-cessful parallelization of the SWAT calibration process at the simulation level.
9.2 Large SWAT model processing
The second experiment consists in executing the calibration of the Danube2 instance (larger in size than Danube1) with a varying number of simulations: 24, 100 and 500, highlighting the scalability of the grid for large scale applications. To have an idea about the size of the model instance, the number of input files used for calibration is 327 000, grouped in 1.3 GB. All these files have to be backup for execution, obtaining at
Fig. 11.Danube 2 total calibration time over the grid.
Fig. 12.Danube 2 execution per simulation over the grid.
the end, considering also the SWAT executables and default files, an archive of approximately 1.6 GB.
Figure 11 presented in (Rodila et al., 2011a), shows the scalability of the grid infrastructure for executing the cali-bration of Danube2 as the number of simulations increases. This scalability is assured by the large number of resources available in the grid. The differences in executing the cali-bration of a large model over the grid with 100 and, respec-tively, 500 simulations are quite small due to this scalability: approximately 30.18 h compared to 30.85 h.
The time needed to execute one simulation in an itera-tion decreases considerable as the number of simulaitera-tions in-creases: while for 24 simulations the average time for exe-cuting one simulation is 57 min, when exeexe-cuting 500 simula-tions it is 3.7 min – Fig. 12 (Rodila et al., 2011a).
9.3 User scalability
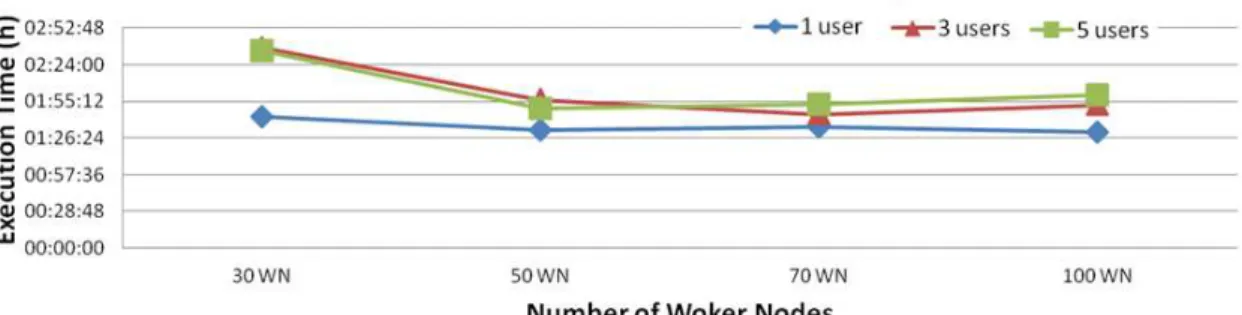
Fig. 13.Calibration time as a function of number of workers and number of current users.
that are running simultaneous iterations using the gSWAT ap-plication. We varied the number of grid jobs between 30 and 100. For all experiments, we used the same number of sim-ulations, that is 100. The results of the experiment are pre-sented in Fig. 13. In all cases, the execution time decreases by using more WNs. In some cases, even though the execu-tion time decreases, it is not a good soluexecu-tion to start more WNs because the improvement is not so high (see for exam-ple the results for 70 and 100 WNs for one user). Obviously, the execution time depends not only on the SWAT hydro-logical model complexity, but also on the availability of free WNs. If multiple users are running the calibration process at the same time, the performance of the system is decreasing, mainly because the number of WNs is limited. Another rea-son for this decrease is that the CE has to manage a higher number of grid jobs.
10 Conclusions
The development of the BSC-OS portal and generally the re-search through the enviroGRIDS project have revealed a lot of challenges regarding the gathering of data into a dedicated SDI, interoperability between geospatial and grid infrastruc-tures, and interoperability between platforms developed by different partners (e.g. URM, gSWAT, ESIP, gProcess, gLite, BASHYT, and eGLE), huge spatial data sets involved in the development of hydrological models and environmental sce-narios (e.g. Danube, Black Sea catchment, Istanbul, and Ri-oni River in Georgia), security and access management in different platforms, application development in distributed and heterogeneous systems, etc.
Another issue the portal development has to face is the compatibility with new technologies and functional require-ments. One main concern is the compatibility with the new European middleware initiative (EMI) that aims to improve and standardize the dominant existing middlewares in or-der to produce one simplified and interoperable middle-ware (EMI, 2012). EMI attempts to unify a few grid plat-forms such as ARC, gLite, Unicore and dCache. The EMI and Globus platforms will empower the EGI (European grid
infrastructure) with more stable, useable and manageable software.
We have to develop extended and high resolution models and scenarios, to improve the tool and application functional-ity, and to improve the user interaction techniques with spa-tial data models.
The service oriented architecture, multicore, GPGPU based systems, cloud processing are other technologies that we intend to explore in order to extend the functionality, ap-plication usability, system efficiency, and to improve the per-formance of data processing.
Acknowledgements. This research is supported by the FP7 envi-roGRIDS Project funded by the European Commission, through the Contract 226740.
Edited by: N. Rebora
Reviewed by: H. Astsatryan and another anonymous referee
References
Abbaspour, K. C., Yang, J., Maximov, I., Siber, R., Bogner, K., Mieleitner, J., Zobrist, J., and Srinivasan, R.: Spatially-distributed modelling of hydrology and water quality in the pre-alpine/alpine Thur watershed using SWAT, J. Hydrol., 333, 413– 430, 2007.
Abbaspour, K. C.: SWAT-CUP2: SWAT Calibration and Uncer-tainty Programs A User Manual, Department of Systems Anal-ysis, Integrated Assessment and Modeling, Eawag, Swiss Fed-eral Institute of Aquatic Science and Technology, Duebendorf, Switzerland, available at: http://www.eawag.ch/forschung/siam/ software/swat/downloads/Manual SwatCup.pdf (last access: 24 February 2012), 2008.
ARC: Advanced Resource Connector, available at: http://www. nordugrid.org/middleware (last access: 14 March 2012), 2012. Bacu, V., Mihon, D., Stefanut, T., Rodila, D., Gorgan, D., Cau, P.,
C3Grid, Collaborative Climate Community Data and Processing Grid, available at: http://verc.enes.org/c3web (last access: 22 March 2012), 2012.
dCache project: available at: http://www.dcache.org/ (last access: 15 March 2012), 2012.
Distributed Research Infrastructure for Hydro-Meteorology Study (DRIHMS): available at: http://www.drihms.eu/ (last access: 15 March 2012), 2012.
EGEE: Enabling Grids for E-sciencE project, available at: http:// www.eu-egee.org/ (last access: 23 March 2012), 2010.
EGI: European Grid Infrastructure, available at: http://www.egi.eu/ (last access: 23 March 2012), 2012.
EMI: European middleware initiative, available at: http://www. eu-emi.eu/ (last access date: 17 February 2012), 2012.
enviroGRIDS Project: available at: http://www.envirogrids.net/ (last access: 30 March 2012), 2012.
European Commission, Research and Innovation – Environment: available at: http://ec.europa.eu/research/environment/ (last ac-cess: 30 March 2012), 2011.
Ewen, J., Parkin, G., and O’Connell, E.: SHETRAN: Distributed Basin Flow and Transport Modeling System, J. Hydrol. Eng., 5, 250–258, 2000.
gLite: Lightweight Middleware for Grid Computing, available at: http://glite.cern.ch/ (last access: 16 March 2012), 2012. Gorgan, D., Abbaspour, K., Cau, P., Bacu, V., Mihon, D., Giuliani,
G., Ray, N., and Lehmann, A.: Grid Based Data Processing Tools and Applications for Black Sea Catchment Basin, IDAACS 2011 – The 6th IEEE International Conference on Intelligent Data Ac-quisition and Advanced Computing Systems: Technology and Applications, IEEE Computer Press, 223–228, 2011.
Group on Earth Observations (GEO): The Full Picture, avail-able at: http://www.earthobservations.org/documents/fullpicture/ fp ps p136 we cl.pdf (last access: 22 March 2012), 2007. Hydrological Simulation Program: FORTRAN (HSPF), available
at: http://water.usgs.gov/software/HSPF/ (last access: 21 January 2012), 2012.
Lecca, G., Petitdidier, M., Hluchy, L., Ivanovic, M., Kussul, N., Ray, N., and Thieron, V.: Grid computing technology for hydro-logical applications, J. Hydrol., 403, 186–199, 2011.
Manca, S., Soru, C., Cau, P., Meloni, G., and Fiori, M.: A multi model and multiscale, GIS oriented Web framework based on the SWAT model to face issues of water and soil resource vulner-ability, Presentation at the 5th International SWAT Conference, available at: http://www.brc.tamus.edu/swat/4thswatconf/docs/ rooma/session5/Cau-Bashyt.pdf (last access: 16 March 2012), 2009.
Pohlert, T., Breuer, L., Huisman, J. A., and Frede, H.-G.: Assessing the model performance of an integrated hydrological and biogeo-chemical model for discharge and nitrate load predictions, Hy-drol. Earth Syst. Sci., 11, 997–1011, doi:10.5194/hess-11-997-2007, 2007.
Pop, F.: A Fault Tolerant Decentralized Scheduling in Large Scale Distributed Systems, chapter in: Handbook of Research on P2P and Grid Systems for Service-Oriented Computing: Models, Methodologies, and Applications, edited by: Antonoupoulos, N., Exarchakos, G., Li, M., and Liotta, A., Information Science Ref-erence (IGI Global), 566–588, 2010.
Pop, F., Dobre, C., and Cristea, V.: Evaluation of Multi-Objective Decentralized Scheduling for Applications in Grid Environment, ICCP 2008 – 4th International Conference on Intelligent Com-puter Communication and Processing, IEEE ComCom-puter Society, 231–238, 2008.
Rodila, D., Bacu, V., and Gorgan, D.: Comparative Parallel Execu-tion of SWAT Hydrological Model on Multicore and Grid Archi-tectures, in: International Journal of Web and Grid Services, in press, 2011a.
Rodila, D., Bacu, V., and Gorgan, D.: Comparative Analysis of Mul-ticore and Grid Based Execution of SWAT Model, in: Proceed-ings of International Workshop on Middleware for Large Scale Distributed Systems – MiDiS2011, Barcelona, Spain, 26–28 Oc-tober, 273–278, 2011b.
Rouholahnejad, E., Abbaspour, K. C., Vejdani, M., Srinivasan, R., and Lehmann, A.: Parallelizing SWAT Calibration in Windows using SUFI2 Program, J. Environ. Model. Softw., in press, 2011. SEE-GRID-SCI: SEE-GRID eInfrastructure for regional eScience, available at: http://www.see-grid-sci.eu/ (last access: 22 March 2012), 2010.
Simion, B., Leordeanu, C., Pop, F., and Cristea, F.: A Hybrid Al-gorithm for Scheduling Workflow Applications in Grid Environ-ments (ICPDP), Springer Verlag, 4804, 1331–1348, 2007. SWAT: Soil and Water Assessment Tool, available at: http://
swatmodel.tamu.edu/ (last access: 4 February 2012), 2012. UNICORE: Uniform Interface to Computing Resources, available
at: http://www.unicore.eu/ (last access: 14 March 2012), 2012. Whittaker, G.: Use of a Beowulf cluster for estimation of risk using
SWAT, Agronomy J., 96, 1495–1497, 2004.
Yalew, S. G., van Griensven, A., and Kokoszkiewicz, L.: Parallel computing of a large scale spatially distributed model using the Soil and Water Assessment Tool (SWAT), International Envi-ronmental Modelling and Software Society (iEMSs), 2010 In-ternational Congress on Environmental Modelling and Software, Modelling for Environment’s Sake, Fifth Biennial Meeting, Ot-tawa, Canada, edited by: Swayne, D. A., Yang, W., Voinov, A. A., Rizzoli, A., and Filatova, T., available at: http://www.iemss. org/iemss2010/proceedings.html, S.10.24, 2010.